Global warming, climate change, all these things are just a dream come true for politicians. I deal with evidence and not with frightening computer models because the seeker after truth does not put his faith in any consensus. The road to the truth is long and hard, but this is the road we must follow. People who describe the unprecedented comfort and ease of modern life as a climate disaster, in my opinion have no idea what a real problem is.
How a new method of inferring ancient population size revealed a severe bottleneck in the human population which almost wiped out the chance for humanity as we know it today.
An unexplained gap in the African/Eurasian fossil record may now be explained thanks to a team of researchers from China, Italy and the United States.
[…]
These findings indicate that early human ancestors went through a prolonged, severe bottleneck in which approximately 1,280 breeding individuals were able to sustain a population for about 117,000 years. While this research has illuminated some aspects of early to middle Pleistocene ancestors, there are many more questions to be answered since uncovering this information.
[…]
Reasons suggested for this downturn in human ancestral population are mostly climatic: glaciation events around this time lead to changes in temperatures, severe droughts, and loss of other species, potentially used as food sources for ancestral humans.
The African hominin fossil gap and the estimated time period of chromosome fusion is shown on the right. Credit: Science (2023). DOI: 10.1126/science.abq7487
An estimated 65.85% of current genetic diversity may have been lost due to this bottleneck in the early to middle Pleistocene era, and the prolonged period of minimal numbers of breeding individuals threatened humanity as we know it today.
What was going on from 1,000-800 ka that may have nearly wiped out our ancestors? Temperatures plunged, glaciers and ice sheets started expanding, sea levels fell & began oscillating with
and atmospheric CO2 dropped to its lowest level in 400 million years.
Kenneth G. Miller et al. ,Cenozoic sea-level and cryospheric evolution from deep-sea geochemical and continental margin records.Sci. Adv.6,eaaz1346(2020).DOI:10.1126/sciadv.aaz1346
Parisians have voted to ban rental electric scooters in their city, dealing a blow to scooter operators and a triumph for road safety campaigners.
Almost 90% of votes cast on Sunday favoured a ban the battery-powered devices, official results showed.
But under 8% of those eligible turned out to vote.
The referendum was called in response to a rising number of people being injured and killed on e-scooters in the French capital.
Of the 1.38 million people on the city’s electoral register, just over 103,000 took part, according to official figures. Of these, over 91,300 voted against the scooters.
Paris was one of the first cities to adopt the electric vehicles – but critics argue they were causing more harm than good.
There was growing concern with the way some people were driving the scooters – weaving through traffic, dodging pedestrians on pavements, and getting up to speeds of 17mph (27km/h).
Riders often did not wear helmets and children as young as 12 could legally hire the e-scooters.
The AEMO (manager of the Australian grid) has finally released the major report on problems coming in the next ten years on our national grid, and it’s worse than they thought even six months ago. They euphemistically refer to the coming “reliability gaps”. They could have said “blackouts” instead, but a gap in reliability sounds so much nicer.
The AEMO (manager of the Australian grid) has finally released the major report on problems coming in the next ten years on our national grid, and it’s worse than they thought even six months ago. They euphemistically refer to the coming “reliability gaps”. They could have said “blackouts” instead, but a gap in reliability sounds so much nicer.
Bizarrely, the lead graph of the 175-page AEMO report goes right off the scale, mysteriously peaking in the unknown and invisible real estate off the top of the chart. And they’re not projecting troubles fifty years from now. Those cropped peaks of invisible pain hit from 2027.
And even the pain we can see is apparently quite bad. Two states are already likely to breach “the interim reliability measure” this coming summer. The AEMO is calling for tenders for “reliability reserves” in South Australia and Victoria just one day after releasing the report. Apparently, they want offers of industries ready to shut down who aren’t already on the list, and they want spare generation too — get this — even asking for “small onsite generators”. Does that sound bad to you? It sounds bad to me.
“Based on current trajectory, we’re in for a world of pain ahead. …theAEMO projections are looking pretty dire.”
Consider Figure 1: A decade of blackouts coming
Have you ever seen a graph like this that hides the peaks? In the “central scenario” of the cropped graph — “only” four states of Australia go off the charts. Imagine what the bad scenario looks like…
AEMO, ESOO, 2023. Figure 1 shows the reliability and indicative reliability forecasts for the 2023 ESOO Central scenario. This forecast considers only the sub-set of known developments that have demonstrated sufficient commitment towards commissioning in the NEM (those developments classified as committed or anticipated), including announced retirements. It allows for project delivery schedules that may be slower than proponents have advised based on observed development, approval, and commissioning requirements.
Given that South Australia flew in diesel jet engines for backup generation at one point (General Electric aero-derivative turbines) — perhaps we can ask Qatar Airlines if they can plug some planes straight into our grid. (The government won’t let them fly in more passengers, in case it screws up Qantas profits, but that means they must have a few planes they can spare.)
A leap to Figure 43 suggests those hidden peaks of Figure 1 might be quite high in NSW and Victoria. Figure 43 shows the same “Central Scenario” as Figure 1 — this time as dotted lines — and we can see a bit more of the graph. The y axis is the same Expected Unserved Energy (%) this time reaching up to 0.007%. But the NSW (blue) and Victorian (grey) lines are doing the Moonshot thing in 2027. They’re headed to infinity or some number the AEMO didn’t want to graph.
AEMO, ESOO, 2023,
The solid lines in Figure 43 are the slightly better scenarios that include contributions from CER or “Consumer Energy Resources” (that’s you!). This is what the future looks like with more help from things like solar panels on rooftops, home batteries, and Electric Vehicles. It’s also the best we can do with DSP assistance — which means Demand Side Participation — those people who participate by not demanding electricity. In normal English, we would call them the customers who are paid to stay away or something.
Ten different ways to go without electricity
The AEMO doesn’t use the word blackout, but it has a dozen flavours of blackouts-by-another-name, many of them voluntary or subsidized and somewhat prearranged. It looks so much better on paper to say “DSP” but it means someone, somewhere, going without electricity when they would otherwise have used it. DSP gets 146 mentions in the AEMO report, giving us some idea of how mini-blackouts are now an essential part of managing a very sick grid.
At a minimum DSP may just be an inconvenience — people have to program their washing machine and pool filter to run at lunchtime, which sounds fine until you have only one sunny day that week and you have six loads of washing. In a rich world without “reliability gaps,” you would just run it, conveniently from 5 to 10 p.m. the night before.
DSP is code for people willing (or dragged), in some sense, to have a voluntary mini-blackout — and the report notes the major factor driving an increase in DSP uptake is because electricity is now more expensive (what a great thing?). The AEMO notes: “These higher prices have led to more benefits to customers participating in DSP schemes or responding directly to market signals”. Table 5 lists the Negawatts of voluntary outages when prices rise to $1,000, $5,000, and $7,500 per megawatt hour…
Now that Alice lives in Down Underland — more expensive electricity means customers get more “benefits” when they don’t use it. See how this works? Only the wealthy will have the convenience of electricity whenever they want it. The underclass will be cooking on barbeques, and getting up earlier each day to program the washing machine and set up the timers for the scooters.
Ominously, the AEMO projects a lot more voluntary blackouts:
AEMO, ESOO, 2023
Drowning in complexity
The message in 42 tables and 100 figures is unspoken but obvious — the Australian grid is drowning in complexity; there are so many moving, unpredictable parts. The report models the various possibilities of low rain, low wind, low stocks of fossil fuels, droughts, heat waves, and unexpected outages. They try to model some combinations and permutations of multiple troubles occurring simultaneously. Whether we get and can afford electricity now depends on ocean currents in the Pacific that no one can predict. We live in the land of drought and flooding rains, and we’re hoping the weather will be nice.
The AEMO brightly says that it can be managed, see Figure 2, if we build 10,000 kilometers of high transmission lines through farmland and forests, and then finish all the wind farms and solar magic panels, along with lots more voluntary blackouts, “consumer investments” (home batteries) and dispatchable capacity (whatever could that be?)
The last thought is the predictions for South Australia:
There is an 84% chance under a “neutral/unknown climate outlook” that South Australia will have no blackouts this summer. But there is a 16% chance that some will occur, and these are most likely to be 1-3 hours long, affecting 5 to 30% of the region (which means “of the state”, presumably). But there is a tiny chance they might lose half the state for as much as 16 hours (spread over four different nights, say). I bet they are praying they don’t get a hot, windless week.
But even if they don’t have one blackout, more of people’s lives will be wasted paying electricity bills and reading articles on how to save electricity, how to reprogram the pool filter, how to charge the kid’s scooter, how to put out fires started by the scooter…
If that’s a neutral/unknown outlook, what does it look like for a long, hot summer? For the data nerds: The text that officially goes with the graph above:
Figure 22 shows a bubble plot of the distribution of USE outcomes that are forecast in South Australia for the 2023-24 summer, under a neutral/unknown climate outlook. It includes the total outage duration and average depth in each simulation
The remainder of simulations, which are collectively 16% probable, are represented by the other bubbles on the chart. Should USE occur, it is most likely to occur for between one hour and three hours and be of an average USE magnitude equivalent to between 5% and 30% of average regional demand. Within each event, larger magnitudes of USE than the average may occur during the duration of the event.
There is a very low probability for USE as deep as 55% of average regional demand, or as long as 16 total hours, which may occur over multiple individual USE events, for example, four different evenings. These outcomes each represent the result of a single annual simulation, with an estimated probability of approximately 1 in 4,000.
A prize-winning science graduate in molecular biology.
She has given keynotes about the medical revolution, gene technology and aging at conferences.
She hosted a children’s TV series on Channel Nine, and has done over 200 radio interviews, many on the Australian ABC.
She was formerly an associate lecturer in Science Communication at the ANU. She’s author of The Skeptics Handbook which has been translated into 15 languages.
In a recent and rather dramatic turn of events, the Rhode Island Fisherman’s Advisory Board (FAB) has made a bold statement by collectively resigning from the Rhode Island Ocean SAMP process. Their letter, addressed to Jeff Willis, the Executive Director of the Rhode Island Coastal Resources Management Council (CRMC), pulls no punches in its critique of the Council’s approach to offshore wind development.
In a recent and rather dramatic turn of events, the Rhode Island Fisherman’s Advisory Board (FAB) has made a bold statement by collectively resigning from the Rhode Island Ocean SAMP process. Their letter, addressed to Jeff Willis, the Executive Director of the Rhode Island Coastal Resources Management Council (CRMC), pulls no punches in its critique of the Council’s approach to offshore wind development.
“We, the undersigned members of the Rhode Island Fisherman’s Advisory Board (FAS), hereby resign and refuse to participate any longer in the Rhode Island Ocean SAMP process. It has become abundantly clear that the Rhode Island CRMC has made deference to offshore wind developers its top priority regardless of the requirements of the Ocean SAMP, the cost to the environment, or the impacts to Rhode Island’s fishing industry.”
This statement alone speaks volumes about the perceived shift in priorities of the CRMC. The FAB members believed that their role was to ensure that offshore wind projects conformed to the requirements and restrictions of the Ocean SAMP. However, their experience suggests otherwise:
“The Ocean SAMP process has been reduced to mere political theater, to which we refuse to lend any further credence by our presence.”
The FAB’s frustration is palpable. They detail the countless hours they’ve invested, providing the CRMC with expertise, data, science, research, and experience. Yet, they feel their efforts have been in vain:
“Concurrence decisions are made ahead of time regardless of any other considerations, FAB expertise rejected and ridiculed by the Council as ‘anecdotal’ while the developer is free to provide misinformation with impunity…”
The letter paints a picture of a process that has lost its way, with the FAB feeling sidelined and their expertise undervalued. They highlight the stark contrast between the strict regulations they face in the fishing industry and the leniency shown to offshore wind developers:
“It is apparent that the Council does not take its regulatory role seriously. As the seventh-most regulated industry in the nation, we in the fishing industry know what it is like to be held to strict regulatory standards, including environmental standards.”
The FAB’s concerns extend beyond mere procedural issues. They point to tangible environmental impacts, such as the “decimation of cod spawning grounds” and “significant long-term impacts on Rhode Island’s fishing industry.”
In a poignant conclusion, the FAB members express their unwillingness to be associated with what they view as the Council’s misguided decisions:
“We will not allow our names to be connected in any way to Council approvals now amounting to wholesale ocean destruction. Rhode Island is supposed to be the Ocean State, not the Windmill State.”
The preliminary German DWD national weather service results of the data for Germany this summer (June, July, August) are in. As expected, the summer was warmer than normal, but nothing really unusual.
The preliminary German DWD national weather service results of the data for Germany this summer (June, July, August) are in. As expected, the summer was warmer than normal, but nothing really unusual.
Fudging the anomalies
The DWD reports, however, the temperature of the 2023 summer in Germany “was significantly above the multi-year average, every summer over the past 27 years.” To reach this conclusion, the DWD uses the 1961-1990 temperature reference period – a period we know was the among the very coolest over the 20th century.
“Once again, we can experience climate change live,” comments Uwe Kirsche, press spokesman for the German Weather Service (DWD).
The mean temperature for Germany in the summer of 2023 was 18.6 degrees Celsius (°C), meaning it was an unspectacular 1.0 degree over the mean of the 1991-2020 reference period. The temperature extremes ranged from a summer low of -0.7 °C recorded in Sohland an der Spree on June 3, to a high of 38.8 °C in Möhrendorf-Kleinseebach (Bavaria) recorded on July 15.
Summer weather was too lousy for the swimming pool
Millions of Germans, however were not convinced by the media reports of summer heat and many thought the summer on the whole was not even that warm.
For example, Hamburg’s online “Hamburger Abendblatt” here reports that the public swimming pool season this past summer was “a flop”, calling the summer, apart from June, “quite sad in terms of weather” and “that’s why there were so few visitors to the outdoor pools in the second half of the summer.”
The heat was mostly spread across southern Germany, while northern Germany saw near normal temperatures and above normal precipitation.
Wetter and sunnier than normal
In terms of precipitation, Germany’s 2023 summer saw 270 liters per square meter (l/m²) of precipitation a good 10 percent more than the average for the period 1991 to 2020 (241 l/m²).
With 720 hours of sunshine, Germany’s 2023 summer was sunnier than normal. Compared to 1991 to 2020 reference period (654 hours) it was about 10% sunnier than normal.
It appears that the Editor of the Telegraph has told Jeremy Warner and Ben Marlow to wake their ideas up.
For years they have been blindly churning out renewable energy propaganda. All of a sudden, they have both seen the light!
It appears that the Editor of the Telegraph has told Jeremy Warner and Ben Marlow to wake their ideas up.
For years they have been blindly churning out renewable energy propaganda. All of a sudden, they have both seen the light!
Someone get a grip. UK energy policy is once again coming apart at the seams, with growing doubts over whether net zero or even energy security goals can be met.
Only now are the true economic costs and practical difficulties of going carbon-free becoming fully evident, and it’s not a pretty sight. Yet still policymakers don’t seem to get it; either that or they are being deliberately misleading on the ease with which it can be delivered.
All pretence at “leading the world” in the application of renewables is meanwhile going up in smoke, as one-time champions pare back their ambitions for the UK market in the face of rising costs, oppressive planning laws, and better opportunities elsewhere. Rival jurisdictions, particularly the US and EU, are beginning to offer far superior incentives.
If you cannot beat them, do the opposite. Slowly, but surely, the Government is watering down its environmental agenda, which sadly but inevitably frequently clashes with the parallel goal of enhanced economic growth – the latest example being so-called “nutrient neutrality” water pollution rules which act as a barrier to more housebuilding.
Yet on paper at least, and indeed legally, the overarching environmental goal of net zero by 2050 – together with the staged targets set for getting there – remains sacrosanct, even though most practically minded people have long thought there is not a snowball’s chance in Hades of actually meeting it. A giant leap of faith in the transforming powers of technology is demanded to think it can be.
As if to confirm the gaping chasm between ambition and reality, the latest round of auctions for UK renewable energy licences, the outcome of which is due to be announced late next week, has plainly hit the rocks.
Similarly with the UK energy group SSE, which has said it will not be entering its Seagreen offshore development into the auction, citing a low, officially set, strike price, and dramatically rising costs.
Under pressure from the renewables industry, the Government has announced a slight increase in the promised subsidy below strike prices, but it’s unlikely to make a difference.
Presumably there are at least some bidders still in the running; even so, officials will struggle to get the capacity hoped for, putting in jeopardy the target of 50GW of offshore wind by 2030. Current capacity stands at just 14GW, so there is a way to go.
This in turn raises doubts about the Government’s separate target of complete decarbonisation of the electricity network by 2035. This, too, looks unrealistic. British energy policy is once more in a chaotic mess. It was ever thus.
As it is, policymakers have set strike prices so low that investors are struggling to see how they might make a return. No surprise that prices should be forced down like this, for the green energy transition is not just about saving the planet. It is also meant to deliver much lower energy costs.
This, too, is turning out to be a pretence. It’s true that in the past seven or eight years, the notional cost of renewable energy has plummeted. The price of offshore wind output has, for instance, fallen by around two thirds, from £100 per megawatt hour to less than £40. There you go, say ministers in response to net zero sceptics; it’s cheaper than coal.
Would that it was, but the claim is in fact a statistical illusion. The manufacturing, installation and maintenance costs alone have been surging since the war in Ukraine. To these we must also add the costs of upgrading the National Grid to bring the new sources of electricity from where they are generated to where they are used.
But to gain a proper understanding of the real costs of wind, and to a lesser extent, solar, we need to factor in another of their characteristics – that they are intermittent.
In order to function effectively, the grid needs a constant balance between supply and demand; if the wind isn’t blowing, or even if it is blowing too strongly, thereby overloading the grid, there is a problem.
Lots of conventional backup capacity is required to deal with the shortfalls that result from intermittency – capacity that can be brought online quickly at the flick of a switch when needs arise.
The upshot is likely to be a high degree of duplication in generating capacity. This will obviously very considerably add to the costs of the renewable element. It’s disingenuous to say wind is cheaper than fossil fuels.
Potentially, storage could provide a solution to the intermittency problem, yet for the moment it doesn’t exist at the scale needed to do the trick. If Britain cannot guarantee to keep the lights on, nobody is going to want to set up shop here.
What about batteries? This may seem unduly pessimistic, but it stretches credulity to believe that they can ever really be the solution. Is there even enough lithium in the world to provide the level of battery power needed to supply the National Grid when the wind stops blowing?
There are alternatives, nuclear being the most obvious, but many environmentalists are as opposed to it as they are to coal, gas and oil, and here in the UK, policy on new nuclear capacity, as on much else, falls woefully short.
It is as much as we can do even to get the money-eating leviathan of Hinkley Point C up and running. Next comes Sizewell C, which scarcely promises to be much better. As Britain’s ageing fleet of existing nuclear power stations reaches the end of its life, merely replacing what’s closing down seems to be beyond us.
And to phase out the 80pc of UK energy demand currently satisfied by fossil fuels, we would need far, far more. Yet the Government continues to procrastinate. Shamefully, it is still faffing around with an international competition to decide who gets to build Small Modular Reactors, never mind how to finance them.
The last two auction rounds lulled the Government into a false sense of security on the economics of renewables. Both were hugely successful in attracting bidders at apparently highly competitive prices.
But things have changed. Having been ahead, Britain is slipping behind. Next week’s announcement on the outcome of the fifth round auction threatens to be a rude awakening.
London Mayor Sadiq Khan’s Ulez punch-down on cars and vans owned by the less affluent is just one example of the attacks planned against town dwellers living in modern industrial societies. Khan is the current chairman of C40, a global network of city mayors backed by numerous hard-Left billionaire foundations.
London Mayor Sadiq Khan’s Ulez punch-down on cars and vans owned by the less affluent is just one example of the attacks planned against town dwellers living in modern industrial societies. Khan is the current chairman of C40, a global network of city mayors backed by numerous hard-Left billionaire foundations. Removing cars from cities is just one of its aims. In a Headline Reportpublished by the group in 2019 and re-emphasised earlier this year, a “progressive” target for 2030 was set of a daily per person allowance of 44g of meat (enough for two small meatballs), a daily limit of 2,500 calories, (less than the ration in the Second World War), one short haul flight every three years, eight new clothing items a year and private cars available for only one in five people. This “pioneering piece of thought leadership” was said to seek a “radical, and rapid, shift in consumption patterns”.
When the report about future urban consumption was first published in 2019, it received little publicity in the media. Some of its proposals looked a bit cranky even for mainstream publications. For instance, under an “ambitious” 2030 target, the mayors looked to ban meat and private vehicles altogether. But groundwork was clearly being laid. Mark Watts, executive director of C40, observed that average consumption-based emissions in the wealthier C40 cities must fall by “two thirds or more” by 2030. It was said that reducing vehicle ownership would lead to significant reclamation of roads and 25,000 kms of cycle lanes. This plan is now well advance since the Covid lockdowns provided cover for mass street closures. Recent years have also seen large increases in cycle lanes, and of course the Ulez war on those driving older vehicles, not necessarily by choice.
Signatory cities are committed to “high impact accelerators”, which include creating low or zero emissions zones along with “implanting vehicle restrictions or financial incentives/disincentives such as road use or parking charges”. An early sighting here, perhaps of Khan’s suspected wish to implement road pricing after his Ulez infrastructure is in place.
There is also an early sighting of unsourced statistics with a claim that eating less meat and more vegetables and fruit could prevent 160,000 annual deaths associated with diseases such as heart attacks, diabetes and strokes in C40 cities. It is not immediately clear if these deaths actually occur in such precise numbers, or whether they are a Ulez-style ‘statistical construct‘.
Over 100 cities around the world are part of the C40 network and they are required to sign up to “performance-based requirements” based on a number of leadership standards. One of these standards specifies that they must innovate and start taking inclusive and resilient action, “to address emissions beyond the direct control of city government, such as associated with goods and services consumed in their city”. The largely unpublicised C40 operation is backed by finance and support from many well-known green foundations including Climate Works, Hewlett, IKEA, Oak, FR and Clinton. Three “strategic funders” are identified including Christopher Hohn’s Children’s Investment Fund Foundation, a major financial contributor to Extinction Rebellion. Another strategic funder is Bloomberg Philanthropies, whose controller Michael Bloomberg, the former mayor of New York, is president of the C40 board.
Of course interest is now growing in what all these people have been smoking over the last few years, as the Con/Lab green blob (different countries, different mainstream political combinations) organise to de-industrialise and cut human progress in the name of tackling a supposed ‘climate crisis’. The C40 Headline Report gives clear guidance of the scale of economic and societal change required under a collectivist Net Zero agenda. U.K. Fires is an academic project funded by the British Government, and it also gives a brutal assessment of life under what it terms absolute net zero carbon dioxide emissions. Again it is not discussed much in the public prints, but the Daily Sceptic has reported on its findings. These include no flying and shipping by 2050, drastic cuts in home heating, bans on beef and lamb consumption and a ruthless purge of traditional building materials such as bricks, glass, steel and cement. Such is the admirable honesty on display in their reports that they note these building materials can be replaced with “rammed earth” – mud huts for the lower classes in other words.
Sadiq Khan has been badly shaken by a popular uprising against his hated Ulez scheme. Backing in his own Labour party is wearing thin, not because most senior members are particularly anti-Ulez, but because after the Uxbridge by-election they can see a little more clearly that attacking the cars of the poor is a slam-dunk vote loser. For his part, Khan seems to have become more hysterical attacking those who oppose Ulez as conspiracy theorists. Earlier this year, reports the Daily Mail, Khan said that some of those who opposed the scheme’s growth across all London boroughs were “anti-vaxxers, Covid deniers, conspiracy theorists and Nazis”.
The evidence provide by Khan’s own C40 Headline Report, along with the work of U.K. Fires, shows clearly the actual agenda that is now being ruthlessly deployed. The only conspiracy rabbithole in sight would appear to be that occupied by a freaked Mayor Sadiq Khan.
Chris Morrison isthe Daily Sceptic’sEnvironment Editor.
Well, I decided to take a shot at publishing my views on the cloud feedback response to increases in surface warming. I wrote it up and sent it for peer review to the Journal of Climate.
Well, I decided to take a shot at publishing my views on the cloud feedback response to increases in surface warming. I wrote it up and sent it for peer review to the Journal of Climate.
The reviewers said that it seemed like I was looking at changes in location, not changes over time. So I re-wrote it and sent it back in.
They wrote back and said ok, changes helped, and oh, by the way …
… it’ll cost you $1,546 to get it published.
I can assure you that I harnessed the awesome power that comes from splitting the infinitive. In a far-too-loud voice, I uttered various speculations regarding the ancestry, sexual habits, and personal hygiene of the Owners, Editors, and Reviewers. I fear I went so far as to encourage them to engage in auto-fornication … for all of which I’m truly sorry. It’s just what goes on in 2023, and I’m still not used to it.
So instead, I figured I’d start by publishing it here, and invite people to suggest changes, to point out inconsistencies, and to generally be some combination of Editors and Reviewers of the paper. Please be kind in your comments, I’m just a fool whose intentions are good.
With that as a prologue, here’s the current state of the paper.
Independent Climate Researcher, Occidental, California
Corresponding author: Willis Eschenbach
ABSTRACT
Cloud radiative response to a change in surface temperatures is a key component in accurately estimating future temperature changes. Changes in surface temperature lead to different cloud responses in different parts of the planet. However, the overall effect of these changes has been very poorly constrained. (Boucher 2013) Using data from satellite observations, I develop two independent methods to estimate how the clouds in different areas respond to a surface temperature increase. Both methods show a global net surface cloud radiative cooling effect. The size of the cooling obtained in this manner is a minimum value of total cloud cooling, because more cloud-related cooling occurs as a result of a temperature-related increase in thermally-driven tropical and extra-tropical thunderstorms which cool the surface in a variety of non-radiative ways. In addition, using theoretical arguments, I show that it is unlikely that the cloud response amplifies global warming.
1. Introduction
Clouds have a central role in modulating the global energy balance. They have long been recognized as being the major source of uncertainty in climate projections. Although a variety of evidence has been presented, a narrow constraint on how clouds respond to projected warming has remained elusive. Indeed, there is still no widespread agreement even on the sign of the cloud response to warming. Part of the challenge is that net cloud radiative effect involves cloud effects on both solar (shortwave [SW]) and terrestrial (longwave [LW]) radiative fluxes. (Ceppi et al. 2017, Gettleman and Sherwood 2016)
A most unusual yet generally unremarked feature of the climate system is its thermal stability. Here is the trough-to-peak temperature range over a 22-year period for each 1° latitude by 1° longitude gridcell.
Fig. 1. Maximum variations in monthly average temperature (trough to peak) during the period Mar 2000 – Feb 2022.
Here, we see temperature swings of over 30°C in the poles, 29°C over the land, 9°C over the oceans, and 14.8 °C for the globe as a whole. But despite those large intra-annual swings, after 12 months the temperature always returns to nearly the same value. Over the same Mar 2000 – Feb 2022 period, the CERES data reveals annual average global surface temperature changes of only about 0.5°C, which is only three percent of the intra-annual variation.
And as another example, over the entire 20th Century the temperature only increased by 0.8°C, which is a 0.3% temperature rise in 100 years.
Figure 2. Annual temperature ranges for the globe (red line) and monthly temperature ranges for parts of the globe. Red line shows range of 20th Century global average annual temperatures, around 0.3%.
As Figure 2 above shows, this surprising longer-term stability cannot be from thermal inertia, given the far larger monthly intra-annual swings. This overall steady-state condition argues strongly for the existence of natural thermoregulatory phenomena opposing any change in the overall steady-state temperature.
This is supported by Le Chatelier’s Principle. Le Chatelier enunciated a simple principle that governs systems that are in a steady-state condition. Le Chatelier’s principle asserts that a disturbance applied to a system at a steady state may drive the system away from its equilibrium state, but will invoke a countervailing influence that will counteract the effect of the disturbance. (Gorshkov et al. 1990) This principle strongly suggests that if the global average temperature changes, the clouds and other phenomena will act to counteract the temperature change, not to reinforce it.
The net cloud radiative effect (CRE) at the surface is composed of the clouds’ effect on two different types of radiation. The first is solar (shortwave) radiation, which is both reflected and absorbed by clouds. The second is thermal (longwave) radiation, which is both radiated and absorbed by clouds. The net surface CRE, which I’ll call “CRE” for simplicity, is the total of the two effects at the surface where we live. In other words, the CRE is the difference between downwelling radiation in clear-sky and cloudy-sky conditions. If the CRE is negative, it means clouds are cooling the surface.
In general, clouds cool the surface. Figure 3 shows the global variations in the CRE. In Fig. 3 we see that the clouds warm the poles and the deserts, and cool everywhere else.
Fig. 3. Surface cloud radiative effect, on a 1° latitude x 1° longitude basis.
The short-term change in surface CRE with temperature is easily calculated using the CERES data. Figure 4 shows that result.
Figure 4. Short-term trends in surface cloud radiative effect as a function of temperature. Trends are ordinary least squares linear regression slopes.
However, that doesn’t tell us what we need to know, which is how the clouds respond to a long-term change in surface temperature. Despite that, there are two ways that we can use observational data to measure that response.
Both of them depend on a simple idea—as a long-term average for each gridcell, over thousands of years, the temperature and the corresponding cloud radiative effect have reached a steady state condition. All of the various phenomena affecting the CRE, such as relative humidity, boundary-layer inversion strength, CAPE (Convective Available Potential Energy), oceanic subsidence and upwelling, and other factors now oscillate around long-term average values for each given gridcell. Thus, the average relationship between temperature and CRE for each gridcell represents the long-term steady-state relationship.
The first way to see what will happen if the surface temperature warms is a gridcell-based scatterplot of CRE and temperature.
Fig. 5. Scatterplot, 22-year averages of CRE versus surface temperature. Each dot is a 1° latitude by 1° longitude gridcell.
Despite this scatterplot including both land and ocean and covering from the tropics to both poles, there is a clear pattern. Looking from the left to the right in the scatterplot, the slope of the black/white line shows the direction and amount of change in the CRE as the temperature increases. There are four different zones.
The coldest zone encompasses the Antarctic and Greenland ice caps. Where the average monthly gridcell temperature is below -20°C, you are in one of those two locations. There, increasing temperatures lead to increasing cloud warming. This represents less than 4% of the planetary surface.
The next zone is from -20°C to 10-15°C. In this zone, increasing warming results in increasing cloud cooling. The third zone is from 10-15°C to about 25°C. In this zone, increasing temperature leads to increasing cloud warming.
Finally, in the warmest parts, increased surface warming leads to greatly increased cloud cooling. At its greatest, an increase of 1°C leads to up to 40 W/m2 of increased cloud cooling (reduction in downwelling surface radiation).
Now, this shows us the overall pattern of the relationship between temperature and CRE. It is extremely non-linear. But it is a general indication, with lots of scatter around the trend line. It also shows areas from all around the world combined.
What this method doesn’t show is either the detailed spatial pattern or the area-weighted global average response of the CRE to increasing temperature. For this I use a second method.
The second method looks only at the average values of the gridcells in the area immediately around each gridcell. Consider a gridcell in the ocean as an example. Nearby gridcells to the north, south, east, and west of that chosen gridcell will have different long-time average values for temperature and CRE. So we can determine the long-term effect by looking at the local relationship between average temperature and average CRE. For each gridcell, I have used a box that is 9° latitude by 9° longitude, centered on the chosen gridcell. This gives me 81 temperature values and a corresponding 81 CRE values. I do a linear regression of the 81 CRE values as a function of the 81 temperature values. The resulting slope shows the change in CRE corresponding to a 1° change in temperature. I’ve analyzed the land and the ocean separately, to avoid mixing different regimes. However, this seems to make little difference. The result is shown in the following Pacific- and Atlantic-centered graphics.
Fig. 6. Changes in surface cloud radiative effect per 1°C change in surface warming. The lower panel is the same as the upper but with an Atlantic-centered view. All values used in the calculation are the average of the full 22 years of the CERES record.
This shows two views, one Pacific and one Atlantic centered, of the detailed location and size of changes in CRE from 1°C surface warming. Globally, there is an area-averaged net cooling of -1.7 W/m2. The main cooling occurs over the ocean, with an area-averaged cooling of -2.4 W/m2. The land is the only area which is even slightly positive, with an area-averaged warming of +0.3 W/m2
These results are in good agreement with those of Ramanathan and Collins (Ramanathan, V., & Collins, W. (1991)), although the proposed mechanisms are different, and these results are for the planet while Ramanathan and Collins only looked at the Pacific Warm Pool.
3. Stability And Uncertainty
If this metric is indeed a measure of the long-term change in CRE with warming, it should change very little from year to year. The boxplot below shows 22 CRE feedback values for each geographical area listed in Figure 6, one for each year of the CERES record.
Figure 7. Boxplot, change in CRE from 1°C surface warming. Data for each of the 22 years in the CERES record.
As expected, there is very little variation in the results despite the shortness (one year) of each dataset. This indicates that even a 22-year average will give accurate values for the change in surface CRE per 1°C warming. As in Figure 6, the only large area that shows positive feedback is the land, and the feedback is quite small.
4. Data Details
I used monthly gridded Clouds and the Earth’s Radiant Energy System (CERES) Energy Balanced and Filled Edition 4.1 data (Loeb et al. 2018). The CERES record is quite stable (Loeb et al. 2016), which makes it an excellent record for this type of analysis. All of the CERES data used covers the 22-year period from March 2000 to February 2022.
For surface temperature, I have used the CERES surface upwelling longwave dataset, converted to temperature using the Stefan-Boltzmann equation. For verification of the calculated CERES surface temperature data, I have compared it with the results using the Berkeley Earth gridded land/ocean data record (Rohde and Hausfather 2020). The area-weighted average difference between the two is only 0.43°C. This difference is not surprising because the Berkeley Earth dataset is a combination of air temperature over land and sea surface temperature. On the other hand, the CERES data is surface temperature everywhere. Below is the same calculation shown in Figure 5 but using the Mar 2000 – Feb 2022 Berkeley Earth Data in place of CERES data for that same period. Note that there is very little difference between this and Figure 5 above which uses CERES data.
Figure 8. As in Figure 5, but using Berkeley Earth surface temperature data in place of CERES data.
5. Final Thoughts
As mentioned above, the cloud radiative effect is only one of the ways that the clouds affect the surface temperature. In addition, thunderstorms cool the surface by means of:
• Increased surface albedo over the ocean due to the white surface foam, spume (foam driven aloft by the wind), and spray. Increased cloud albedo due to the vertical extent of thunderstorm towers.
• A thunderstorm operates on the same refrigeration cycle as a household refrigerator or air conditioner. It evaporates a working fluid (in this case water) in the area to be cooled. It moves the resulting vapor to a separate physical location (the thunderstorm cloud base) where the working fluid is condensed and then returned to the area to be cooled, in the form of cold rain. This natural refrigeration-cycle heat engine greatly cools the surface quite independently of any radiation considerations.
• There is increased evaporative cooling due to the thunderstorm-generated winds at the base, as well as from the provision of dry air to the surface.
• A large thunderstorm typically generates on the order of 20,000 tonnes of rainfall over its existence. This means it is moving on the order of 40 terajoules of energy from the surface to high up in the troposphere. There, because it is above most greenhouse gases, it is much freer to radiate to space.
• Increased evaporation from the increase in surface area due to the creation of millions of spray droplets.
• Increased radiation to space due to the lack of water vapor in the dry descending air between the thunderstorms.
Tropical thermally driven thunderstorms increase with increasing temperatures. As a result, the cloud radiative cooling (CRE) is enhanced by increased thunderstorm production, and the CRE cooling estimates represent a minimum value.
Acknowledgments.
All of this work is my own. However, I owe immense thanks to all of the outstanding scientists who have preceded me. I have no conflicts of interest.
Boucher, O. et al., 2013: Clouds and aerosols, Climate Change 2013: The Physical Science Basis. Contribution of Working Group I to the Fifth Assessment Report of the Intergovernmental Panel on Climate Change (Cambridge University Press, Cambridge, UK, 2013), pp. 571–657.
Ceppi, P, F. Brient, M. D. Zelinka, D. L. Hartmann, 2017: Cloud feedback mechanisms and their representation in global climate models. Wiley Interdisc. Rev. : Clim. Change8, e465.
Gorshkov, V.G., Sherman, S.G. & Kondratyev, K.Y., 1990: The global carbon cycle change: Le Chatelier principle in the response of biota to changing CO2 concentration in the atmosphere. Il Nuovo Cimento C13, 801–816 https://doi.org/10.1007/BF02511997
Loeb, N. G. et al., 2018: Clouds and the Earth’s Radiant Energy System (CERES) Energy Balanced and Filled (EBAF) Top-of-Atmosphere (TOA) Edition-4.0 data product. J. Clim.31, 895–918.
Loeb, N., N. Manalo-Smith, W. Su, M. Shankar, S. Thomas, 2016: CERES top-of-atmosphere Earth radiation budget climate data record: Accounting for in-orbit changes in instrument calibration. Rem. Sens.8, 182.
Ramanathan, V., & Collins, W. (1991). Thermodynamic regulation of ocean warming by cirrus clouds deduced from observations of the 1987 El Niño. Nature, 351(6321), 27–32. doi:10.1038/351027a0 https://sci-hub.se/10.1038/351027a0
Rohde, R. A. and Hausfather, Z., 2020: The Berkeley Earth Land/Ocean Temperature Record, Earth Syst. Sci. Data, 12, 3469–3479, https://doi.org/10.5194/essd-12-3469-2020.
So, there it is. All comments, criticisms, and improvements gladly considered. This site provides one of the best peer-review processes on the planet.
Please remember that when you comment, you need to quote the exact words you are discussing. That way, we can all be clear about your subject.
Finally, a couple of requests.
First, I’d still like to get this sucker published. Does anyone know of a reasonably high-impact-factor journal that does NOT charge $1,546 to publish a paper?
And second, does anyone want to take this paper over and shepherd it through the review process? This method worked out very well for Craig Loehle and me. With some assistance from me, he rewrote parts of my post on extinctions entitled Where are the Corpses?, he arm-wrestled the journals, and we got it published as Historical bird and terrestrial mammal extinction rates and causes, with him as the Lead Author. So far, about 150 citations, with more each month.
Anyone interested? Any “publish or perish” folks out there not interested in perishing? Because I truly hate dealing with the journals …
My very best wishes to all, enjoy this marvelous world where we are given so little time.
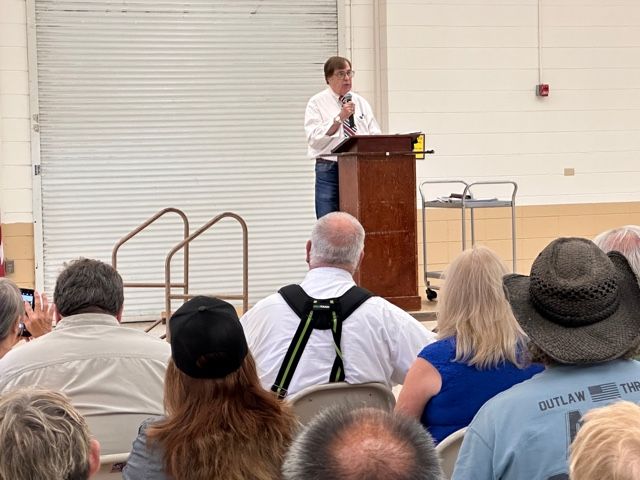
On Saturday, August 26th, as the air filled with smoke from local wildfires, CFACT’s National Grassroots Coordinator, Tom DeWeese, traveled to the rural community of Grants Pass, Oregon. He was invited there because citizens of the community found themselves caught on the frontlines of several battles over intrusive environmental policies that are smothering their local economy.
On Saturday, August 26th, as the air filled with smoke from local wildfires, CFACT’s National Grassroots Coordinator, Tom DeWeese, traveled to the rural community of Grants Pass, Oregon. He was invited there because citizens of the community found themselves caught on the frontlines of several battles over intrusive environmental policies that are smothering their local economy.
DeWeese addressed an event sponsored by several local groups, including the county Republican Women’s Club and the Farm Bureau, and attended by almost 500 people. DeWeese explained in detail precisely what they are facing: namely, a determined, well-funded, and politically-powerful cadre of Green ideologues dedicated to enforcing a radical environmental agenda. “Individual efforts by a few in opposition to this agenda simply will not stop it,” DeWeese explained.
Grants Pass faces the federal Forest Service and the Bureau of Land Management’s (BLM) ongoing effort to destroy the local timber industry. The county once had thirty lumber sawmills. Today, it has none. As a result of the closures, the community lost revenue and struggles to fund local services. Meanwhile, the wildfires burn almost unabated.
In addition, the Oregon State Legislature has mandated severe environmental policies that foster “sustainable development” must be included in every local comprehensive development plan. This has led to the inability of local communities to autonomously choose how best to meet the needs of their residents — as elected city councils and county commissions simply, without question, follow the state dictates.
As DeWeese spoke to the gathering of determined, but frustrated activists, he explained the origins of the policies and the powers behind them. In addition, he revealed how Green nongovernmental organizations (NGOs) virtually surround state and local representatives to pressure them to pursue far-reaching eco-policies. Said DeWeese, “They have a radical agenda, and they fully intend to see it enforced.”
DeWeese then presented a dramatic depiction, using over 35 members of the audience, to showcase how NGOs surround and pressure local government officials. The audience ate it up! “But,” said DeWeese, “you aren’t there, and our side has no clear agenda of our own to present for policy ideas. We must get off of the defense and take the offence to change the debate.”
To counteract the influence of Green NGOs, DeWeese put forth a plan to create a permanent infrastructure of citizen activists in the community to “keep up our own pressure” on local officials. He called it “building a Freedom Pod,” … focused on protecting local property rights, small businesses, and individual liberties.
DeWeese finished by telling the gathering they must stand up and be heard. To dramatize the point, he called on all of them to stand up and say NO! As all 500 shouted: “NO” and the room shook, DeWeese concluded, “That’s what your local and state representatives must hear from you!”



You must be logged in to post a comment.