Global warming, climate change, all these things are just a dream come true for politicians. I deal with evidence and not with frightening computer models because the seeker after truth does not put his faith in any consensus. The road to the truth is long and hard, but this is the road we must follow. People who describe the unprecedented comfort and ease of modern life as a climate disaster, in my opinion have no idea what a real problem is.
A recent post at far-left news outlet Mother Jones, “There’s a Powerful, Hidden Force Behind Migration: Climate Change,” claims that climate change is a powerful driver of mass migration from the third world. This is false. The migrants themselves who were interviewed only bring up weather at all when pressed to do so, economic factors are the usually cited reasons for both illegal and legal attempts at migration to western countries. Extreme weather is not at all new to the regions discussed.
A recent post at far-left news outlet Mother Jones, “There’s a Powerful, Hidden Force Behind Migration: Climate Change,” claims that climate change is a powerful driver of mass migration from the third world. This is false. The migrants themselves who were interviewed only bring up weather at all when pressed to do so, economic factors are the usually cited reasons for both illegal and legal attempts at migration to western countries. Extreme weather is not at all new to the regions discussed.
The author claims that recent mass migration to Spain and other countries from places like Morocco is secretly being spurred on by climate change, and suggests that media does not often discuss that factor. This is immediately absurd, of course, because the mainstream media often cites climate change as a driver of both legal and illegal immigration. Climate Realism has recently debunked such claims regarding migrants from Somalia, here, for instance.
Undermining the initial claim of the headline and introduction, the author admits “[t]hat is not to say that the effects of climate change caused tens of thousands of people to risk their lives by attempting to swim to Ceuta. Economic forces were much more urgent motivators for Mohamed to leave his home.”
The migrant interviewed by Mother Jones says that the reason he is trying to leave Morocco is because of limited job opportunities. He does not mention climate change at all. But the author goes on to insist “after another summer of extreme temperatures and wildfires in the northern and southeastern provinces in Morocco, severe flash flooding and landslides in rural communities throughout the High Atlas Mountains, and the culmination of a seven-year drought after a winter of heavy rainfall across the country, climate change also may be an underlying factor in creating the economic crisis forcing so many to leave their homes.”
This is completely backwards. The reason these severe weather events have such a large impact on Morocco and other poorer countries is because they are weak economically in the first place, making it difficult or impossible for communities to invest in weather hardened infrastructure. The cited extreme weather events are not new to the region, and happen all around the world regardless of climate change.
Flash flooding is a feature of desert environments, once dry seasons are over. Likewise, drought for that matter is an obvious feature of the desert, especially lengthy droughts, which the author admits recently came to an end. Alternating periods of extended drought and deluge are the norm for Morocco in particular. The southeastern Morocco desert has recently seen dry lakebeds refill with water, when they have been mostly empty for a long time due to the recent drought period. Those lakebeds would not be there in the first place if they did not sometimes fill. Trying to claim that these natural patterns are evidence of climate change is nonsense.
As for the wildfires, again wildfire is not new to the region, and data from the joint NASA and European Space Agency joint project Copernicus show that there is no trend towards worsening wildfires in Morocco, neither in area burned nor number of fires. (See figure below)
Despite 2022 seeing a record bad fire year, 2024 was a record low for wildfires in Morocco since records begin in 2002 according to Copernicus data. Mother Jones is not interested in that, only the high years. Good scientists would not claim that 2024 represented a trend towards the elimination of wildfire, and likewise 2022 is not indicative of a trend towards climate catastrophe.
The Mother Jones post goes on to make the dubious claim that “North Africa and the Middle East are warming faster than the rest of the world, and Morocco’s agricultural sector—the cornerstone of the country’s economy—is particularly vulnerable to climate impacts like soil degradation and depleted groundwater.”
Soil degradation and depleted groundwater are resource management impacts, not climate impacts. For example, the same claim was made about depleted water resources in Nigeria, but population growth stressing the water supply around Lake Chad and other countries upriver building dams were the real cause. Natural drought under those conditions is bound to make things worse.
The most notable part of this article is the straightforward dismissal of the actual complaints of the migrants themselves, in order to push the climate claim. The so-called experts that the author interviews insist basically that the migrants don’t know what they are talking about, that climate change is the real background issue, instead of things like political corruption and violence making economies unstable in the region and hindering development.
The data do not show anything unprecedented happening with the weather, but it is clear that Mother Jones is not interested in facts.
Researchers at the Swedish University of Agricultural Sciences (SLU) developed a method using “bomb carbon” (elevated radiocarbon- 14 from 1960s atmospheric nuclear tests, preserved in tree rings) in wood shavings to track how stable biochar is when added to soil.
AI generated by Grok
Researchers at the Swedish University of Agricultural Sciences (SLU) developed a method using “bomb carbon” (elevated radiocarbon- 14 from 1960s atmospheric nuclear tests, preserved in tree rings) in wood shavings to track how stable biochar is when added to soil.
Biochar is a charcoal- like material produced by heating biomass (here, wood) in low- oxygen conditions (pyrolysis). It is of interest for improving soil properties and as a potential long-t erm carbon sink to help mitigate climate change, with global estimates suggesting it could sequester carbon equivalent to roughly 6- 16% of annual anthropogenic CO₂ emissions. A key uncertainty has been how quickly biochar mineralizes (breaks down into CO₂) in soil versus remaining stable for decades or centuries, and how to distinguish its contribution from native soil organic matter.
The method
Atmospheric nuclear testing in the 1950s- 1960s roughly doubled atmospheric ¹⁴C levels, peaking around the mid-1960s. Tree rings from 1964-1967 therefore contain elevated “bomb” ¹⁴C. SLU researchers selected mature Norway spruce and Scots pine trunks from a Swedish clear- cut, identified the relevant rings, and used a professional woodturner to carefully remove outer wood and collect the thin, high-¹⁴C layers as shavings. These were pyrolyzed into biochar (tested at highest treatment temperatures of ~400°C and 650°C).
The resulting biochar had enough ¹⁴C enrichment (on average ~61.7 percent modern carbon higher than bulk soil organic matter in one report) to serve as a natural tracer. In a one-year laboratory incubation, they mixed it into soil (at 2% by dry mass), trapped emitted CO₂, and measured its ¹⁴C signature via accelerator mass spectrometry. This allowed them to quantify the share of CO₂ coming from the biochar versus the soil.
Key findings
CO₂ from biochar- amended soil showed up to about 10% higher ¹⁴C than controls, confirming a small but measurable contribution from the biochar.
Roughly 0.35% of the added biochar carbon converted to CO₂ over one year.
This implies high stability: at least half of the buried biochar is projected to remain in the soil after ~200 years (under the study conditions).
The method works with mature wood feedstock that resembles commercial biochars, offers higher precision than some natural- abundance ¹³C approaches, and avoids the need for expensive artificial isotopic labeling.
The work was published in Radiocarbon (Li et al., 2026: “Bomb ¹⁴C for tracing biochar mineralization in soil”). It was funded in part by Sweden’s Bio+ program (Swedish Energy Agency). Follow- up research is planned to examine biochar stability under climate- change scenarios in collaboration with researchers in Germany.
This approach provides a practical way to study biochar persistence, its interactions with soil organic matter, and its viability for carbon sequestration without relying solely on short- term incubations or complex lab labeling.
To obtain wood formed during the years 1964–1967, the researchers engaged professional woodturner and wood artist Åke Landström from Glanshammar. Credit: Harald Cederlund
Bomb 14C for tracing biochar mineralization in soil
This is the open- access research article “Bomb ¹⁴C for tracing biochar mineralization in soil” by Haichao Li, Harald Cederlund, Elias S. Azzi, Cecilia Sundberg, and Erik Karltun (Swedish University of Agricultural Sciences), published online 23 September 2026 in Radiocarbon (Volume 68, Issue 5, pp. 1146- 1154).
It is freely available under a Creative Commons Attribution (CC- BY) licence.
Core contribution
The authors introduce and validate a practical isotopic- tracing method that uses naturally elevated “bomb” radiocarbon (¹⁴C) preserved in tree rings formed during the atmospheric nuclear- test peak (1964- 1967). Biochar made from this wood carries a clear ¹⁴C signature that can be distinguished from soil organic matter (SOM), allowing precise quantification of how much of the CO₂ released from soil comes from the biochar itself.
Methods (summary)
Mature Norway spruce and Scots pine trunks (≥70 years old) were collected from a clear- cut near Uppsala, Sweden.
Annual rings from 1964- 1967 were identified by counting and carefully isolated by professional woodturning (producing shavings).
Biochar was produced by pyrolysis under N₂ at highest treatment temperatures of 400 °C (BC400) and 650 °C (BC650). The feedstock with the highest ¹⁴C enrichment (~172.9 pMC) was selected.
Biochars were acid- washed to remove carbonates, ground (<2 mm), and mixed into a loamy- sand agricultural soil (Cambisol, 1.4 % SOC) at a 2 % (w/w) application rate.
Soils were incubated for 365 days at ~20.7 °C and 60 % water- holding capacity. Emitted CO₂ was trapped in NaOH and analysed for total C and ¹⁴C (AMS) at multiple time points.
An isotope-mixing model calculated the biochar- derived fraction of respired CO₂. Priming effects on native SOC were also quantified.
Key results
Biochar was on average 61.7 pMC higher in ¹⁴C than bulk soil organic matter, providing a clear tracer signal.
¹⁴CO₂ from biochar- amended soils was consistently and significantly higher than from controls (p < 0.0001).
Early in the incubation (first 2 weeks) 8.3- 11.4 % of mineralized CO₂- C came from biochar; later this fell to 2.3- 7.5 %.
After one year, only 0.32 ± 0.02 % (BC400) and 0.35 ± 0.01 % (BC650) of the added biochar carbon had been mineralized. The two pyrolysis temperatures did not differ significantly.
BC650 produced a measurable negative priming effect on native soil organic carbon (–129 ± 20 mg CO₂-C kg⁻¹, or ~14.8 % relative to the control); BC400 showed essentially none.
Advantages claimed over other isotopic approaches
Higher precision than the natural- abundance ¹³C (C₃/C₄) method for detecting small biochar contributions.
Works with mature wood feedstock that closely resembles commercial biochars (unlike many laboratory pulse- labelled materials derived from young seedlings).
Relatively low cost and does not require specialised isotope-labelling facilities.
Uniform ¹⁴C enrichment because the trees grew continuously under elevated atmospheric ¹⁴C.
Conclusions
The bomb-¹⁴C method is shown to be effective for quantifying biochar mineralisation and its interactions with soil organic matter. It opens practical possibilities for longer- term studies of biochar persistence and carbon-sequestration potential under realistic conditions.
The paper includes supplementary material with additional figures on priming and sensitivity analyses. Funding came in part from the Swedish Energy Agency’s Bio+ programme.
Log with younger wood turned away. The wood with the highest content of ‘bomb carbon’ is found in the growth rings between the red circles. Credit: Harald Cederlund
Journal:Radiocarbon (Volume 68, Issue 5, pp. 1146–1154)
Improving our understanding of biochar carbon (C) stability in soil is crucial given its potential for soil C sequestration. However, challenges with isotopic labeling of biochar restrict our ability to determine its fate in soil. Atmospheric nuclear bomb tests in the 1960s resulted in a 14C spike in tree rings, providing an opportunity to address this challenge. Here, we present a method that utilizes the elevated levels of 14C in wood from tree rings formed between 1964 and 1967 as a tracer to determine the proportion of biochar C in mineralized soil. Biochar was produced using wood from the 14C enriched tree rings as feedstock and thereafter used in a mineralization experiment capturing the emitted CO2. We demonstrate that the bomb 14C-enrichment in the biochar is high enough to differentiate between CO2 originating from either biochar or soil organic matter mineralization. The method can be used to address questions on biochar persistence, its interactions with soil organic matter and research that is needed to explore the potential to use biochar for C sequestration in soils.
It’s a response to the Telegraph headline Wednesday: ‘Next financial crisis “to be triggered by uninsurable homes”‘ , warning that climate change is making British homes uninsurable, mortgages unobtainable, and properties unsellable, in a repeat of 2008.
Homes are covered by Flood Re. Businesses are not. And Tenbury’s problem is old: the Audit Commission flagged lack of flood defences in 2009, and the Environment Agency has now put the full scheme on hold.
Many scary numbers rely on RCP8.5, the implausible high-emissions pathway. Scientists behind the next IPCC scenarios have now dropped RCP8.5, SSP5-8.5 and SSP3-7.0 as “implausible”.
‘If it bleeds, it leads’ is the oldest rule in the newsroom. Its climate-era corollary is that if it floods, burns or sinks, it sells. Wednesday’s Telegraph ran the headline ‘Next financial crisis “to be triggered by uninsurable homes”‘, warning that climate change is making British homes harder or even impossible to insure, that mortgages will become unobtainable and that properties will become unsellable. Readers are reminded that the undermining of the mortgage market drove the 2008 crash, and informed that a wave of uninsured, high-risk homes could do the same.
There is no surer way to unsettle a reader than to tell him that his home, almost always a family’s largest asset, is about to become worthless. That is precisely the point. For 15 years the climate story has been sold as “the science” that threatens the reader’s own front door: your house will burn (‘global warming’), your street will flood (‘rising sea levels’), your foundations will crack with land subsidence. In May 2013 Barack Obama’s Twitter account told its 31 million followers that 97% of scientists agreed climate change was “real, man-made and dangerous”. The study behind the tweet said nothing about danger; that word was added by Obama’s team. “Real, man-made and dangerous” has nonetheless been the house style of the legacy media ever since, and the uninsurable home is simply its latest product line.
Whistleblowers, or a campaign?
The Telegraph describes its sources as senior City figures represented by “a whistleblowing organisation called Inside Track”, which has written to Ministers, the Financial Conduct Authority and the Bank of England claiming that insurers are under-pricing climate risk. The paper adds, almost in passing, that the group is backed by climate charities including the Esmée Fairbairn Foundation, one of Britain’s largest grant-makers, whose 2020 strategy explicitly targets “the causes and impacts of climate change”.
Inside Track Campaigns Ltd was incorporated in March 2025 as a company limited by guarantee whose registered business is public relations and communications. Its first accounts are not due until December, so the public cannot yet see who pays for it; its own FAQ says only that it has been funded by trusts and foundations. Nor does it deal in leaked documents, the stock-in-trade of genuine whistleblowers. Its website says plainly that it is not looking for confidential documents. It recruits anonymous senior professionals, collects their views on common industry practice, and then advises on which stakeholders should hear the message and how best to deliver it. That is a description of an advocacy campaign, as my colleague Paul Homewood describes. The template has been used before: an Inside Track group of food-industry executives issued a similar memo warning of climate risk to Britain’s food supply.
The anonymous insiders’ own words undercut the alarm. One former reinsurance executive complains that the industry does not care about climate risk more than a year ahead because it can “keep repricing cover”. That is not a scandal; it is how property insurance works. As Warren Buffett told Berkshire Hathaway shareholders in his 2015 letter, policies are written for a year and repriced annually, so a rising possibility of loss shows up promptly in premiums rather than in insolvency. An insurer that reprices every year is not quietly accumulating a 2008-style time bomb on its balance sheet.
The 2008 analogy fares no better. Stanford economist John Cochrane put it plainly in his testimony to the US Senate Banking Committee in March 2021: “Climate change poses no measurable risk to the financial system.” As he explained, “‘Risk’ means unforeseen events. We know exactly where the climate is going over the horizon that financial regulation can contemplate.” The financial crisis was a sudden, unforeseen collapse in the value of leveraged mortgage securities; a slow, observable drift in weather statistics, repriced every year, is its opposite. Cochrane also warned that climate goals were being pursued through financial regulators “by regulatory subterfuge rather than aboveboard legislation or transparent agency rulemaking”. A memo campaign aimed at the Bank of England and the FCA, rather than at voters, fits that description well. I made the same arguments last month about Brussels’s plans for an EU-backed “climate insurance” pool – a climate protection racket as it were – the very model the Telegraph now commends to Britain.
The “uninsurable town” that isn’t about homes
The article’s lead photograph shows flood water in Tenbury Wells, Worcestershire, “dubbed Britain’s first ‘uninsurable town’”. But the Tenbury story is not about homes, and it is not new. What lost cover there were the town council’s civic buildings and local businesses: Zurich withdrew flood cover from the Pump Rooms and the Regal Cinema in October 2025. Homes are a different matter. As the local MP Dame Harriett Baldwin pointed out to the Treasury Committee, the Flood Re scheme exists to help homeowners in flood-prone areas get insurance; what it does not cover is businesses.
Nor is the cause a sudden shift in the climate. As long ago as 2009 the Audit Commission flagged the lack of progress on Tenbury’s flood defences as one of only two red flags for Worcestershire, noting that some businesses already could not get insurance and that the national funding formula ranked the scheme low. Seventeen years later the Environment Agency has put the full scheme on hold. Tenbury is a monument to unbuilt flood defences, not to a broken climate. Even the Telegraph concedes that “scrapped flood defence investment” played its part.
Flood Re itself shows how the system is meant to work. Homes built after January 1st 2009 are excluded from the scheme, a cut-off designed to discourage developers from building on flood-prone land; owners of such homes buy cover at whatever price the risk commands. That is the price signal doing its job. Even the Association of British Insurers, quoted by the Telegraph, asks only for the obvious: more investment in flood defences, an end to building on flood plains and better building standards. None of that requires a climate emergency. It requires engineers, planners and premiums that are allowed to tell the truth.
Fifteen years of RCP8.5
Behind many of the headlines lies a single scenario. The high-emissions pathway known as RCP8.5 with projected catastrophic outcomes, and for over a decade journalists and regulators treated it as ‘business as usual’. As early as 2020, Zeke Hausfather and Glen Peters warned in Nature that this framing was misleading. In April this year the scientists who design the scenarios feeding the IPCC’s next assessment went further, declaring the old high-end emission levels “implausible” and dropping RCP8.5, SSP5-8.5 and SSP3-7.0 from the new framework. Even the European Commission’s climate website now concedes that RCP8.5 is no longer considered plausible.
Yet the numbers built on these scenarios live on in the property pages. The Telegraph tells readers that one in 10 homes could be affected by subsidence by 2070. That figure matches the British Geological Survey’s projection under RCP8.5: 11%, or 4.2 million properties. Under RCP4.5, the pathway the BGS itself says current emissions are closest to, the share is around 5%; under the Paris-aligned scenario, about 500,000 properties. The BGS’s earlier, widely cited subsidence maps used RCP8.5 alone. The scariest number, as ever, is the one that reaches the reader.
The Telegraph’s August data feature on climate threats to homes, which the paper recommends at the foot of this week’s article, follows the same formula. Its interactive map finds that fewer than one in 20 British properties is spared high exposure to at least one of five threats: drought, heat, wildfires, flooding and coastal erosion. A measure that captures 95% of the country tells you about the threshold, not the risk. Read further and the threats shrink. Some 10,000 properties are at risk from coastal erosion over the next 80 years, out of a national stock of tens of millions. Wildfires, the article concedes, are mostly started by human hands, from barbecues and campfires to discarded cigarettes – a point I made about Britain’s wildfires this summer.
What the loss data actually show
The insurance figures are presented in the same way. The Telegraph’s chart shows domestic claims for subsidence and weather damage rising from about £437 million in 2021 to just over £1 billion in 2025. That is five years of raw totals in nominal pounds, with no adjustment for inflation in repair and rebuilding costs or for the growing number and value of insured homes. A short window of unadjusted claims is not a climate signal.
The longer, global record tells a different story. Roger Pielke Jr’s analysis of Munich Re data shows that total economic losses from weather and climate disasters have fallen as a share of world GDP, from about 0.25% in 1990 to under 0.2%. Insured losses do grow, by 5-7% a year in real terms according to Swiss Re, but the reinsurer names the main driver as rising exposure: economic and population growth, building in hazard-prone areas and construction-cost inflation. Nor is the market buckling. Swiss Re’s sigma report says reinsurers can absorb even a one-in-10 peak year of $300 billion or more in insured losses.
Swiss Re’s own press release makes the point with Hurricane Katrina. A repeat today would still be very costly because of higher housing and construction costs, but improved flood defences and a 20% fall in the local population along the storm’s path have significantly reduced exposure. Adaptation works. That is the lesson of Tenbury too.
Swiss Re’s Chief Executive Andreas Berger tells a different story when he goes on television. In a CNN interview last summer, against footage of European wildfires, he declared that the frequency and severity of natural catastrophes are increasing, that conventional measures are no longer sufficient, and that governments, the public and industry must “come together” in a tripartite arrangement. His host opened with the firm’s claim that around 480,000 people a year die from extreme heat. Those are modelled mortality estimates, not insured losses, and say nothing about whether a home in Kent can be insured. A reinsurer whose business grows with perceived risk has every reason to talk the risk up on CNN while its research department attributes the rising bill to exposure. Readers may weigh the two accordingly. Of course, it does not occur to Berger to mention cheap air-conditioners as an appropriate mitigation option for households in summer heat.
Who benefits from fear?
If the facts are this thin, why the drumbeat? Partly because fear is the product. A postcode map of personal peril, published in the money pages, travels further than a chart of losses relative to GDP. As we found during Covid, fear has avid customers. Every ‘protection gap’ story strengthens the case for a public-private scheme in which taxpayers backstop risks that premiums ought to price: a bigger and longer-lived Flood Re, the EU’s new “climate insurance alliance” that the Telegraph holds up as a model, or the EU-backed catastrophe protection racket I criticised last month. It strengthens the hand of central bankers who have doubled down on climate regulation even as green finance collapses. And it sustains a foundation-funded campaign ecosystem that turns anonymous testimony into memos to ministers and government regulatory authorities such as the FCA.
There is a final irony. The industry’s real failing, according to Inside Track’s insiders, is that it has gone quiet: fewer people, one complains, are now prepared to stand up and say they are scared by what they are seeing. In the climate debate, fear is no longer a by-product of the evidence; it has become the evidence. As I argued in a recent piece on the so-called Planetary Health Check, doom never goes out of fashion.
The homeowner in Worcestershire or Kent deserves better than a map telling him that his house sits beneath five climate threats at once. He deserves flood defences that are actually built, planning rules that stop new estates going up on flood plains, and insurance priced honestly, year by year, as it always has been. The Telegraph’s readers were offered a financial crisis in their homeownership instead. Fear sells, but the scenario on which 15 years of it were built has now been retired. As with Covid, so with climate: sooner or later, truth will out. Franklin Delano Roosevelt’s first inaugural speech, delivered in March 1933 on the East Portico of the US Capitol at Washington DC, was called “The Only Thing We Have to Fear is Fear Itself”. Truer words have seldom been spoken.
Dr Tilak K. Doshi is the Daily Sceptic’s Energy Editor. He is an economist, a member of the CO2 Coalition and a former (cancelled) contributor to Forbes. Follow him onSubstackandX.
New research suggests that climate- driven changes are amplifying seasonal CO₂ exchange patterns in parts of the Indian Ocean, which could influence its role as a climate buffer, though this does not automatically mean greater overall carbon absorption.
The Indian Ocean plays a significant but regionally complex role in the global carbon cycle.
It acts as a modest net sink for atmospheric CO₂ overall, absorbing a portion of human- caused emissions and helping buffer climate change, though its behavior differs sharply between northern and southern regions and is strongly modulated by the monsoon system, ocean circulation, temperature, biology, and climate variability.
AI generated by Grok
New research suggests that climate- driven changes are amplifying seasonal CO₂ exchange patterns in parts of the Indian Ocean, which could influence its role as a climate buffer, though this does not automatically mean greater overall carbon absorption.
Published on Phys.org on October 18, 2026, and written by Hannah Bird, the article covers a study in Geophysical Research Letters (Joshi et al., 2026; DOI: 10.1029/2026GL123472) led by Dr. Apurva Padamanbh Joshi of the Indian National Center for Ocean Information Services. It analyzes data from 1980- 2019 on how seasonal air- sea CO₂ exchange has evolved across Indian Ocean regions.
Key findings
Seasonal variation in CO₂ exchange increased by 48% in the equatorial Indian Ocean and 23% in the southern Indian Ocean (greater contrast between seasonal highs and lows).
It decreased by 14% in the Arabian Sea and rose modestly (~7%) in the Bay of Bengal.
Average CO₂ release to the atmosphere decreased in the Arabian Sea, Bay of Bengal, and equatorial Indian Ocean, while absorption increased in the southern Indian Ocean. Larger seasonal swings do not necessarily equal higher net carbon uptake.
Drivers
In the equatorial and southern Indian Ocean, changes in the CO₂ partial- pressure difference between surface water and the atmosphere were key.
In the Arabian Sea and Bay of Bengal, shifts in wind speed (which affect gas transfer across the air-sea interface) played a larger role.
Similar seasonal amplification has been noted in parts of the Pacific and Atlantic, indicating broader ocean responses.
Context and implications
Oceans absorbed roughly 26% of human- caused CO₂ emissions from 2014- 2023 (per the Global Carbon Budget 2024), but capacity growth has slowed since around 2016 amid rising climate variability.
Temperature, winds, circulation, and existing dissolved CO₂ levels all influence the exchange: cooler water tends to absorb more, while warming can favor release, modulated by currents and other factors.
The study focuses on historical changes rather than future projections. It highlights that seasonal processes are being reshaped regionally, which matters for accurate carbon- budget estimates (annual averages can miss timing shifts) and for marine ecosystems.
Greater CO₂ absorption increases ocean acidification, reducing carbonate ions needed by corals and shell-forming organisms; repeated seasonal extremes could stress recovery and affect biodiversity and productivity.
Overall, the findings provide a finer picture of the Indian Ocean’s evolving contribution to the global carbon cycle and its buffering of atmospheric CO₂. Further work is needed to determine long- term effects on storage capacity as warming continues.
Diagrammatic representation of the global carbon cycle. Credit: Wikimedia Commons/ PD-USGov-NASA.
The Indian Ocean plays a significant but regionally complex role in the global carbon cycle.
It acts as a modest net sink for atmospheric CO₂ overall, absorbing a portion of human- caused emissions and helping buffer climate change, though its behavior differs sharply between northern and southern regions and is strongly modulated by the monsoon system, ocean circulation, temperature, biology, and climate variability.
Overview of the Ocean Carbon Cycle (Relevant to the Indian Ocean)
Oceans exchange CO₂ continuously with the atmosphere. When the partial pressure of CO₂ in surface seawater (pCO₂) is lower than in the air, the ocean absorbs CO₂ (a sink); when higher, it releases CO₂ (a source).
Key controls include:
Solubility pump: Cooler water holds more CO₂. Warming reduces solubility and can promote outgassing.
Biological pump: Phytoplankton take up CO₂ via photosynthesis; some organic carbon sinks to deeper waters, sequestering it.
Physical factors: Winds enhance gas transfer across the air-sea interface; upwelling brings CO₂-rich deep water to the surface; currents and stratification redistribute carbon; freshwater inputs (e.g., rivers) affect alkalinity and pCO₂.
Anthropogenic influence: Rising atmospheric CO₂ drives net ocean uptake, but also causes ocean acidification (lower pH) as CO₂ forms carbonic acid.
Globally, oceans absorb roughly 25- 28% of anthropogenic CO₂ emissions. The Indian Ocean contributes a share of this, estimated at a net uptake of about −0.07 to −0.19 PgC/yr (petagrams of carbon per year; negative = sink) north of ~37.5°S for recent decades.
Regional Patterns in the Indian Ocean
The basin is not uniform:
Northern Indian Ocean (north of ~15–18°S): Generally a net source of CO₂ to the atmosphere.
Arabian Sea (northwestern): Strong perennial source, especially due to intense upwelling during the Southwest Monsoon that brings carbon-rich deep waters to the surface.
Bay of Bengal (northeastern): Often a moderate net sink, influenced by large freshwater inputs from rivers that lower salinity and can suppress pCO₂.
Southern Indian Ocean (south of ~15- 18°S, especially 15- 50°S): A significant sink. Cooler temperatures, subduction of surface waters, and biological activity favor CO₂ absorption. This region helps make the overall Indian Ocean a weak net sink.
The equatorial Indian Ocean is closer to neutral (neither strong source nor sink) due to relatively deep thermocline and weaker upwelling compared to the equatorial Pacific.
Seasonal and Interannual Variability
The Indian Ocean’s carbon cycle is strongly seasonal because of the reversing monsoon winds and currents:
Large seasonal swings in pCO₂ and air- sea CO₂ flux are linked to monsoon- driven changes in temperature, winds, upwelling, and biological production.
Recent research (1980- 2019 data) shows these seasonal variations have amplified: +48% in the equatorial Indian Ocean and +23% in the southern Indian Ocean, with a decrease (−14%) in the Arabian Sea and a modest increase (~7%) in the Bay of Bengal. Drivers include changes in the air-sea pCO₂ difference (especially equatorial and southern regions) and wind speeds (Arabian Sea and Bay of Bengal). Average outgassing has decreased in northern and equatorial areas while southern uptake has increased.
Interannual variability is strongly influenced by the Indian Ocean Dipole (IOD) and its interactions with El Niño- Southern Oscillation (ENSO). Positive IOD events can enhance outgassing in parts of the southeastern tropical Indian Ocean via upwelling and changes in dissolved inorganic carbon (DIC) and alkalinity. Circulation changes (e.g., Indonesian Throughflow, Southern Ocean inflows) can also cause large interior carbon accumulation anomalies.
Biological and Other Processes
Primary production (photosynthesis) is substantial, with satellite- based estimates around 8 Gt C/yr for the basin.
Respiration in deeper (aphotic) layers recycles carbon, influencing DIC distributions.
Dust and iron deposition from the atmosphere can stimulate biological uptake in some areas, though effects vary north- south.
The Indian Ocean is relatively undersampled compared to other basins, leading to greater uncertainty in flux estimates
Climate Change Impacts and Buffering Role
Warming, changing monsoons, and rising atmospheric CO₂ are altering the cycle. Amplifying seasonal CO₂ exchange does not automatically increase the net annual sink, but it reshapes when and how strongly exchange occurs.
This matters for accurate carbon budgets (annual averages can miss timing shifts) and for marine ecosystems: greater CO₂ uptake increases acidification, which reduces carbonate availability for corals, shellfish, and other calcifiers. Extreme seasonal conditions may hinder ecosystem recovery.
Overall, the Indian Ocean continues to act as a climate buffer by taking up anthropogenic CO₂, with evidence of a strengthening sink in some analyses (~0.02 PgC/yr per decade in certain periods).
However, its capacity and reliability depend on ongoing physical and biological changes. Continued observations and modeling are essential, especially given data sparsity in parts of the basin.
The Indian Ocean and Atlantic Ocean both act as net sinks for atmospheric CO₂ and contribute meaningfully to the global ocean carbon sink, but they differ substantially in magnitude, regional patterns, drivers, seasonal behavior, and efficiency of carbon storage.
Net CO₂ Flux (Air-Sea Exchange)
Indian Ocean: A relatively modest net sink, typically estimated at about −0.07 to −0.19 PgC/yr (north of ~37.5°S) for recent multi- decadal periods (e.g., 1985- 2018). Northern areas (especially the Arabian Sea) are sources, while the southern subtropical region is a stronger sink. One reconstruction puts the full Indian Ocean sink near −0.30 PgC/yr.
Atlantic Ocean: A stronger net sink overall, with basin- wide estimates around −0.36 to −0.47 PgC/yr (1985- 2018, including the Mediterranean in some assessments). The North Atlantic (particularly subpolar regions) is an intense sink; the tropical Atlantic is a moderate source due to upwelling. The North Atlantic alone (a small fraction of global ocean area) can account for a disproportionately large share of global uptake.
In relative terms, the Atlantic often contributes a larger share of the global ocean sink relative to its size than the Indian Ocean. Both basins show evidence of a strengthening sink over recent decades in response to rising atmospheric CO₂, though interannual variability (e.g., linked to ENSO and IOD in the Indian Ocean or AMOC changes in the Atlantic) can modulate this.
Regional Contrasts
Indian Ocean: Strong north- south contrast driven by the monsoon. The northwestern Arabian Sea is a perennial source (strong summer upwelling brings CO₂- rich deep water to the surface). The Bay of Bengal is closer to neutral or a mild sink (influenced by large river freshwater inputs that lower salinity and pCO₂). The equatorial region is near neutral. The southern Indian Ocean (south of ~15- 18°S) is the main sink region.
Atlantic Ocean: Stronger high- latitude sink in the North Atlantic due to cooling of poleward- flowing waters (increasing solubility) and biological drawdown, combined with deep convection and the Atlantic Meridional Overturning Circulation (AMOC). The tropical Atlantic is a source (upwelling), while the South Atlantic is a sink. Coastal and open-ocean differences exist, but the North Atlantic’s efficiency is notable.
Unlike the equatorial Pacific (a major source) or equatorial Atlantic (a source), the equatorial Indian Ocean is closer to neutral because of its unique wind patterns and deeper thermocline.
Drivers and Physical Processes
Indian Ocean: Dominated by seasonal monsoon wind reversal, upwelling (especially Arabian Sea), riverine freshwater inputs (Bay of Bengal), and connections via the Indonesian Throughflow and Southern Ocean inflows. Both solubility and biological pumps matter, with solubility more influential in the north and both important in the south. Climate modes like the Indian Ocean Dipole strongly affect interannual flux variability.
Atlantic Ocean: Strongly influenced by the AMOC, which ventilates deep waters and efficiently transfers anthropogenic carbon (Cₐₙₜ) into the interior. The North Atlantic is a key entry point for Cₐₙₜ into the deep ocean. Heat loss, biological export, and western boundary currents (e.g., Gulf Stream cooling) enhance uptake. A significant fraction of Atlantic Cₐₙₜ accumulation comes from lateral transport from the Southern Ocean.
The Atlantic stores a large share of global oceanic anthropogenic carbon relative to its area (historically ~23% despite covering ~15% of the ocean), thanks to deep ventilation. The Indian Ocean stores less efficiently in its northern (landlocked) portion but receives carbon via throughflow and Southern Ocean connections.
Seasonal Variability
Both oceans show pronounced seasonal cycles in CO₂ exchange, with cooler seasons favoring stronger sinks.
In the Indian Ocean, monsoon-driven changes produce large seasonal swings in pCO₂ and flux; recent studies show these seasonal amplitudes have increased substantially in equatorial and southern regions (e.g., +48% equatorial, +23% southern from 1980- 2019).
In the Atlantic, seasonal amplitude is also significant (especially subtropics and high latitudes), with winter cooling and biological activity enhancing uptake. Amplification of seasonal pCO₂ cycles due to anthropogenic carbon accumulation is a broader ocean phenomenon observed in both basins.
Climate Change and Buffering Role
Both basins help buffer atmospheric CO₂ rise and are experiencing acidification.
The Atlantic’s deep ventilation makes it particularly important for long- term sequestration of anthropogenic carbon.
The Indian Ocean’s role is more surface- and intermediate- depth oriented in many areas, with greater sensitivity to monsoon and IOD changes.
Warming reduces solubility in both, but circulation changes (e.g., potential AMOC weakening vs. monsoon shifts) will affect future uptake differently. The Indian Ocean remains more undersampled than the Atlantic in many datasets (e.g., SOCAT), adding uncertainty to its estimates.
In summary:The Atlantic is generally a more efficient and stronger net CO₂ sink per unit area (especially in the North Atlantic), with superior deep- ocean carbon storage via overturning circulation.
The Indian Ocean is a weaker overall sink with sharper regional contrasts (northern sources vs. southern sink) tightly coupled to monsoon dynamics.
Both are critical components of the global ocean carbon cycle, and ongoing changes in their seasonal and interannual behavior will influence how reliably they continue to act as climate buffers.
The Pacific Ocean is the largest ocean basin and plays a dual role in the global carbon cycle: it is the world’s biggest oceanic source of CO₂ in its equatorial region, yet overall, it functions as a net sink of comparable magnitude to the Atlantic (and larger than the Indian Ocean in absolute terms), thanks to strong uptake in its subtropical and higher- latitude zones.
Net CO₂ Flux (Air- Sea Exchange)
Pacific: Basin- wide net uptake is typically estimated at roughly −0.4 to −0.5 PgC/yr (e.g., −0.41 ± 0.12 PgC/yr from observation- based pCO₂ products and −0.51 ± 0.16 PgC/yr from models for (−0.7 PgC/yr), offsetting substantial natural outgassing. The net sink has been strengthening at rates around −0.08 to −0.09 PgC/yr per decade.
Comparison: This places the Pacific’s net sink in a similar range to the Atlantic (−0.36 to −0.47 PgC/yr) and larger in absolute terms than the Indian Ocean (−0.07 to −0.30 PgC/yr depending on the exact domain). Despite covering nearly half the global ocean area, the Pacific’s net contribution is moderated by its powerful equatorial source. In some climatologies, the three basins contribute roughly similarly to global open- ocean uptake when coastal zones are included (Pacific and Atlantic each ~25%, Indian ~20%).
Regional Patterns
Equatorial Pacific: The dominant global oceanic CO₂ source. Strong upwelling of carbon-rich deep water (especially in the eastern “cold tongue”) releases ~0.4- 0.7 PgC/yr or more on average, often accounting for a large fraction of total oceanic outgassing. This far exceeds the tropical Atlantic source and the more localized northern Indian Ocean sources (e.g., Arabian Sea). The western equatorial Pacific is closer to neutral or occasionally a weak sink.
Subtropical Pacific: Strong sinks, particularly in the North Pacific subtropical gyre, driven by cooling of waters and biological activity. These help offset equatorial outgassing.
Higher latitudes: Uptake occurs in subpolar regions, though less intense per unit area than the North Atlantic’s deep-convection zones. The North Pacific lacks the Atlantic’s vigorous deep-water formation, so anthropogenic carbon (Cₐₙₜ) penetration is shallower (mainly intermediate depths).
In contrast:
The Atlantic has intense high- latitude (especially North Atlantic) sinks and efficient deep ventilation via the AMOC.
The Indian Ocean shows a clear north– south divide (northern sources vs. southern sink) tightly tied to the monsoon, without a single dominant equatorial source like the Pacific’s.
Drivers and Variability
Pacific: Dominated by the El Niño- Southern Oscillation (ENSO). During El Niño, equatorial upwelling weakens and outgassing decreases sharply (sometimes nearly shutting off the source); during La Niña, outgassing intensifies. This makes the tropical Pacific the largest contributor to interannual variability in the global ocean carbon sink. Subtropical and higher -latitude uptake is influenced by gyre circulation, seasonal temperature changes, and biology.
Seasonal cycles: Present but often secondary to interannual ENSO- driven swings in the tropics. Seasonal amplification of pCO₂ cycles (linked to anthropogenic carbon accumulation) occurs, similar to other basins.
Comparison: The Indian Ocean’s variability is more monsoon- and IOD- driven with strong seasonal signals that have recently amplified. The Atlantic has notable seasonal cycles (especially high latitudes) and is influenced by AMOC strength and North Atlantic Oscillation variability but lacks the Pacific’s extreme interannual equatorial swings.
Anthropogenic Carbon Storage and Efficiency
The Pacific stores a large absolute amount of Cₐₙₜ due to its size, but less efficiently per unit area than the Atlantic. The North Atlantic’s deep convection allows deeper and more rapid sequestration. Pacific Cₐₙₜ is mostly confined to intermediate depths via mode and intermediate water subduction. The Southern Ocean (shared influence) is a major entry point for all basins, with subsequent redistribution.
Climate Change Context
All three basins are experiencing rising uptake of anthropogenic CO₂, ocean acidification, and changes in seasonal and interannual patterns. The Pacific’s equatorial source region is particularly sensitive to ENSO changes and warming (which can affect upwelling and solubility). Its large area means even modest per-area changes have global impact. Data coverage in the Pacific is generally better than in the Indian Ocean but still sparse in some southern regions.
Summary comparison:
Pacific: Largest source region (equatorial) and large subtropical sinks → moderate- to- strong net sink; high interannual variability (ENSO).
Atlantic: Strongest high latitude sinks and efficient deep storage (AMOC) → strong net sink relative to size.
Indian: Modest net sink with sharp monsoon- driven north– south contrast and growing seasonal amplitude.
Together, the three major ocean basins (plus the Southern Ocean) form the backbone of the oceanic carbon sink that absorbs roughly a quarter of human CO₂ emissions each year.
The Pacific’s unique combination of a massive natural source and extensive sink regions makes its behavior especially important for understanding global carbon- cycle variability.
Changes in surface CO₂ levels and the factors driving them across four Indian Ocean regions—the Arabian Sea (AS), Bay of Bengal (BoB), Equatorial Indian Ocean (EIO) and Southern Indian Ocean (SIO)—during the 1980s and 2010s. Black lines show CO₂ changes, while red and blue lines represent the effects of temperature and non-temperature related factors, respectively. Dashed lines represent the 1980s and solid lines the 2010s. Credit: Joshi et al, 2026.
Climate Change Induced Seasonal Amplification of the Indian Ocean CO2 Sink
Key findings from the paper (based on available summaries)
The study analyzed air- sea CO₂ exchange across the Indian Ocean from 1980 to 2019, focusing on changes in seasonal variability:
Seasonal amplitude increased by:
48% in the equatorial Indian Ocean
23% in the southern Indian Ocean
~7% in the Bay of Bengal
It decreased by 14% in the Arabian Sea
Mean CO₂ release to the atmosphere decreased in the Arabian Sea, Bay of Bengal, and equatorial Indian Ocean.
CO₂ absorption increased in the southern Indian Ocean.
Drivers differed by region:
Equatorial and southern Indian Ocean → mainly changes in the air-sea difference in CO₂ partial pressure (ΔpCO₂).
Arabian Sea and Bay of Bengal → primarily changes in wind speed (affecting gas-transfer velocity).
Important caveat emphasized in the work: Larger seasonal swings do not automatically mean a stronger net annual carbon sink. The amplification reshapes the timing and intensity of exchange within the year rather than necessarily increasing total uptake.
The paper frames these changes as a response to climate change (warming, altered circulation and monsoon patterns, and rising atmospheric CO₂) and notes implications for marine ecosystems (via acidification) and for carbon- budget estimates that rely only on annual averages.
Context
This is one of the more detailed observational analyses of seasonal CO₂ flux changes specifically in the Indian Ocean. It complements broader findings that seasonal pCO₂ amplitudes are increasing across much of the global ocean due to anthropogenic carbon accumulation (which reduces the ocean’s buffer capacity and makes pCO₂ more sensitive to temperature and biology).
This study investigates changes in the mean and seasonal states of oceanic carbon uptake across the Indian Ocean (IO) using an improved, high-resolution, observationally constrained long-term (1980–2019) surface ocean pCO2 data product. The Arabian Sea shows a ∼14% decline in CO2 flux amplitude along with reduced mean source strength. In contrast, the Equatorial IO exhibits the largest increase in seasonal amplitude (∼48%), followed by the Southern IO (∼23%), while the Bay of Bengal shows only a modest change (∼7%). Despite these differences, mean source strength decreases in both the Bay of Bengal and Equatorial IO, whereas the Southern IO shows an enhanced carbon sink. Amplitude changes in the Arabian Sea and Bay of Bengal are driven by shifts in flux sensitivity to wind speed and evolving seasonality of the ocean-atmosphere pCO2 gradient, whereas in the Equatorial and Southern regions, they are primarily controlled by the evolving pCO2 gradient alone.
TIME Magazine reporter Simmone Shah claims in “Climate Change Is Accelerating Faster Than We Can Respond, Scientists Warn” that Earth is undergoing a rapidly accelerating climate destabilization that humanity is increasingly unable to handle. This is false and grossly misleading. The observational record shows a modest long-term warming trend amid substantial short-term variability, while human longevity, food production, resilience to weather disasters, and global vegetation have improved dramatically during the same period.
TIME Magazine reporter Simmone Shah claims in “Climate Change Is Accelerating Faster Than We Can Respond, Scientists Warn” that Earth is undergoing a rapidly accelerating climate destabilization that humanity is increasingly unable to handle. This is false and grossly misleading. The observational record shows a modest long-term warming trend amid substantial short-term variability, while human longevity, food production, resilience to weather disasters, and global vegetation have improved dramatically during the same period.
TIME opens with the ominous declaration that “the climate is warming up faster than we can respond,” based on a new BioScience paper titled “The 2026 state of the climate report: challenges and opportunities.” The article then barrels through warming, sea level, wildfires, heat deaths, greenhouse gases, coral reefs, tipping points, fossil fuels, and planetary “life-support systems,” giving readers the impression that civilization is watching the planetary engine check lights turn red one after another.
There is remarkably little effort to ask the most obvious question: If climate change is outrunning humanity’s ability to respond, where is the evidence that humanity is losing?
Let’s start with TIME’s central claim. Shah writes that warming accelerated from approximately 0.05°C per decade between 1880 and 1970 to 0.36°C per decade from 2010 through 2024.
That sounds terrifying until you translate it into ordinary numbers.
A trend of 0.36°C per decade is 0.036°C per year. That is about six-hundredths of a degree Fahrenheit per year. No human being can perceive such a change from one year to the next, much less experience it as some runaway climatic upheaval.
More importantly, TIME compares a 90-year trend with a recent 14-year trend ending immediately after the extraordinary 2023-2024 temperature spike. That is a marvelous way to manufacture a frightening comparison, but a poor way to explain climate.
Climate Realism addressed almost exactly this claim in March in “No, TIME, the Planet Isn’t ‘Heating Faster Than Ever.’” The University of Alabama in Huntsville (UAH) satellite record showed a long-term lower-tropospheric trend of about 0.16°C per decade since 1979, with large short-term excursions associated with El Niño and other natural influences.
NASA Science itself has described the 2023-2024 warmth as “exceptional” and investigated multiple contributors, including El Niño, aerosol changes, cloud cover, solar activity, and the enormous injection of stratospheric water vapor from the 2022 Hunga Tonga-Hunga Ha’apai eruption.
But here is the most embarrassing omission in TIME’s story: the BioScience paper itself is more cautious than TIME.
The researchers say warming “appears” to have accelerated. They then explicitly acknowledge that other analyses find the recent warming, including the 2023-2024 spike, consistent with climate-model simulations rather than evidence of a newly accelerated trajectory.
TIME doesn’t bother telling readers that.
Instead, Shah jumps immediately from the short-term warming calculation to tipping points, irreversible changes, and the possibility of reaching 2°C before 2050. That’s not explaining uncertainty. That’s stripping the uncertainty out and keeping the scary part.
Then TIME turns to extreme weather. Shah points to 2026 heat waves and wildfires and declares that the effects of an “acceleratingly warming planet” have become “impossible to ignore.” Yet in the very same paragraph she admits, “we don’t yet know enough to link these individual weather events to climate change.”
Read that again.
TIME uses individual weather events as evidence of accelerating climate catastrophe and then acknowledges that those individual events cannot presently be linked to climate change. That is not climate analysis. That’s narrative first, evidence later doomsday claim.
That nuance is nowhere to be found in TIME’s parade of disasters.
Then there is mortality. TIME cites a preliminary estimate of 35,000 excess deaths during European heat waves. Heat kills people, and sensible adaptation to extreme heat is important. But presenting one summer’s estimate without the broader mortality record is spectacularly misleading.
Climate at a Glance documents that deaths from weather-related disasters have fallen by more than 99 percent during the past century. Average annual deaths fell from approximately 485,000 in the 1920s to fewer than 8,000 around 2020.
That is what successful adaptation looks like.
Temperature mortality provides another inconvenient fact. A large 2021 study in The Lancet Planetary Health estimated that 8.52 percent of deaths were associated with cold temperatures compared with 0.91 percent associated with heat. From 2000-2003 to 2016-2019, declining cold mortality outweighed increasing heat mortality, producing a net reduction in temperature-related mortality.
TIME somehow manages to write an article about climate changing “faster than we can respond” without mentioning one of the clearest measurements of our response: people have become vastly less likely to die from weather.
Food tells the same story.
The United Nations Food and Agriculture Organization reports that global cereal production increased 27 percent from 2010 to 2024, reaching 3.1 billion tonnes, primarily because of improving yields. Oil-crop production increased 50 percent. Climate at a Glance similarly documents record-setting global crop production and yields during the period of modern warming.
Apparently Earth’s “life-support systems” forgot to notify agriculture. Plants didn’t get TIME’s doom memo either.
NASA satellite observations found that between one-quarter and one-half of Earth’s vegetated land significantly greened over 35 years, with researchers estimating that carbon dioxide fertilization accounted for approximately 70 percent of the observed greening. NASA
Human beings have been equally uncooperative with the apocalypse narrative. The United Nations reports that global life expectancy reached 73.3 years in 2024, up 8.4 years since 1995.
Think about the absurdity of TIME’s framing.
During the period in which humanity was supposedly losing its race against climate change, weather-related mortality collapsed, crop production soared, vegetation increased, billions more people were fed, and global life expectancy rose.
That doesn’t mean climate change has no effects. It means TIME’s claim that climate is changing “faster than we can respond” is contradicted by some of the most important measurements of human welfare and resilience.
Even the underlying BioScience paper recognizes something TIME’s catastrophe narrative obscures. It states that extreme-weather disasters result from interactions between climatic hazards and human social systems, and it lists adaptation measures including cooling centers, flood protection, prescribed burns, irrigation, resilient crops, early-warning systems, coastal protection, and stronger infrastructure.
In other words, we are responding. And we have been responding extraordinarily well.
TIME finishes with the report’s theatrical declaration that we are witnessing the “rapid destabilization of the Earth’s climate system” and that this is “a diagnosis of the present.”
Fine. Then diagnose the patient using all the vital signs.
Don’t show readers carbon dioxide while hiding crop production. Don’t show a European heat wave while ignoring the century-long collapse in weather mortality. Don’t show selected wildfire seasons while ignoring declining global burned area. Don’t discuss planetary “life-support systems” while neglecting global greening. Don’t claim humanity cannot keep up while life expectancy is rising and human vulnerability to natural disasters has plummeted.
Most of all, don’t take a 14-year temperature trend ending in an exceptional temperature spike, compare it with a 90-year historical trend, omit the underlying paper’s own caution about that acceleration, and then tell millions of TIME readers that Earth is careening toward irreversible catastrophe.
That’s not reporting climate science responsibly. It’s incompetent and irresponsible climate doom journalism written by a reporter who’s obviously incapable of factual research. TIME’s reporter had an opportunity to interrogate an alarming scientific paper, examine its assumptions, compare its claims against observational records, and ask whether the real-world trajectory of human welfare supports the headline. Instead, she simply amplified the alarm. I’d call it press release regurgitation.
The climate is changing slowly. Humanity is adapting rapidly. The world is not coming to an end. The only thing accelerating uncontrollably in TIME’s article is the rhetoric.
The biggest near-term price driver is fuel and inflation, not sea surface temperature. Marine diesel is over $7/gal now vs ∼$6.50 last year, and large fishing boats use hundreds to tens of thousands of gallons per trip. For Seattle, which the NYT focuses on, the influx of high-earning tech workers since the 2010s has made everything more expensive, including restaurants.
A recent article in TheNew York Times (NYT), “How Climate Change is Causing ‘the Gentrification of Seafood’,” blames primarily climate change for how expensive seafood has become in recent decades. This is misleading. Later in the article, the author admits that seafood prices have always fluctuated, and economics and overfishing can also impact the cost and availability of fish and shellfish. This is a much better explanation for seafood prices than blaming the weather, sea surface temperatures, and fossil fuel use.
The NYT claims that climate change is increasing ocean temperatures and reducing the supply of fish, forcing prices upwards, but also quite early in the post admits that “more people” are also going after those supposedly “fewer fish and shellfish.”
With that admission, the NYT complicates their own narrative. Human populations are growing, and the popularity of seafood has been increasing as diet trends promote eating fish and shellfish as easy ways to get lean protein. Trends on social media like TikTok made eating canned fish like sardines look epicurean and health conscious to younger consumers who otherwise would probably turn their noses up at it. Seafood consumption has been rising; in 2024, sales reports showed that four-year sales growth in both frozen and fresh fish increased 31%, and shellfish experienced a 23% growth in sales.
Lest we forget, after Biden banned Russian seafood imports, demand on US-caught fish expanded, and prices increased.
Economic pressures are much larger influences on especially local seafood costs. In 2024, seafood prices had actually been trending downwards in the United States, despite inflation, but pressures change quickly. The spike in fuel costs is likely a large part of why seafood is so comparatively expensive right now. Marine diesel is over $7 per gallon right now, while last year it was closer to $6.50. That might not sound like a huge change, but large fishing boats that do multi-day excursions might have tanks that hold over 250 gallons, and commercial crabbing boats have fuel requirements of 48,000 gallons or more.
Another factor that this article, which focuses largely on the Pacific Northwest, mentions only very briefly, is that local cost inflation due to how trendy the area is will also impact food prices in general, including eating out at seafood restaurants. NYT even admits that “[m]any aspects of Seattle life have become more expensive with the influx of high-earning tech workers who have relocated there for companies like Amazon, beginning in the 2010s.”
That is obviously not because of climate change.
Increasing pressure on fish stocks in general is a known issue, however that hasn’t stopped record fish catches from happening in recent years. As described by Climate Realism before when refuting similar claims coming from media, the most recent all-time record was set in 2020, and some groups studying fisheries estimate that production is expected to continue growing into the 2030s.
Warmer waters may push cooler water species away from where they once lived, this is true, but it is not a catastrophe and is not evidence that climate change is decimating fish stocks. The NYT claims that, while admitting seafood prices have never been stable, “over the last 20 years, climate change-related phenomena have added steady pulses of volatility,” listing “droughts, heat domes, marine heat waves, sea ice anomalies, ocean acidification, atmospheric rivers and toxic algae blooms” as climate-driven issues that have supposedly “upended” Pacific Northwest fisheries. They say this as if all these issues were not present in previous decades, which is blatantly false.
Marine heatwaves have always happened. One of the most prominent marine heatwave conditions that regularly occur in the Pacific, and which is ongoing right now, is the El Niño–Southern Oscillation. It is natural, and has always occurred. Even this year’s very strong El Niño is hardly unprecedented and not unique to the last two decades. Previous years with similarly strong ENSO in the satellite era alone occurred in 1982-83 and 1997-98.
Likewise atmospheric rivers are a common feature of the Pacific Northwest’s climate. Meteorologist Anthony Watts explains in “Wrong, Washington Post – History and Data Contradict Claims of Worsening ‘Atmospheric Rivers’,” that studies using satellite as well as sounding data looking at the regions the West Cost atmospheric rivers originate found that there is no trend towards intensifying or declining events.
It is true that bacterial and algae blooms can make shellfish toxic, and they are more common in warmer water conditions, which is why the oyster harvest seasons usually do not go into summer months in the Southeastern United States. If the window has shifted, harvest times can also shift. Still, the NYT implies that paralytic shellfish poisoning, for example, is a recently emerging phenomenon, when records going back as early as the 1700s and into the 1920s show that these events poisoned and killed people enjoying seafood on the West Coast. But again, there are plenty of places with warmer waters than the Pacific Northwest that also have thriving shellfish harvesting communities, like Louisiana.
Climate change is, ironically, a red herring in this story.
The most frustrating thing about articles like this, is the mixing of truth with exaggeration, where the New York Times and other outlets like it will choose to amplify the role of warming while downplaying factors that are much more immediate and powerful. What is implied by this framing, is that YOUR use of fossil fuels and their byproducts is making it so that it is harder for people to afford their favorite foods. Because YOU won’t give up your car or eating red meat, a poor family in Connecticut or Oregon can no longer afford cod. It is nonsense and certainly not part of “all the news that’s fit to print.“
Future Arctic winter sea ice is projected to shrink by roughly 1 million km² more than earlier estimates suggested. This comes from a recent study (reported in Nature Geoscience) that used mid- Holocene paleoclimate data (~6,000 years ago) to better constrain and weight climate models.
Greater winter ice loss could amplify mid- latitude impacts already linked to reduced winter SIE, including colder and wetter winters in parts of Eurasia and North America, altered storm tracks, and extreme precipitation.
AI generated by Grok
Future Arctic winter sea ice is projected to shrink by roughly 1 million km² more than earlier estimates suggested. This comes from a recent study (reported in Nature Geoscience) that used mid- Holocene paleoclimate data (~6,000 years ago) to better constrain and weight climate models.
Researchers from the University of Cambridge and Mexico’s Centro de Investigación en Matemáticas compiled the largest database yet of a key biomarker produced by sea- ice algae, extracted from ocean sediment cores.
During the mid- Holocene, orbital changes caused warmer Arctic conditions and reduced sea ice, providing an independent “out- of- sample” test of how models handle warmer climates comparable to projected future greenhouse- gas forcing.
Models generally over- predicted the amount of winter sea ice that should have existed under those past conditions. By weighting the models according to how well they matched the paleodata (and historical observations), the positive bias was largely eliminated. This also narrowed projection uncertainty by as much as 85%.
When the same weights were applied to future scenarios (SSP1/SSP2/SSP5), the multi- model mean winter sea- ice extent for 2090- 2099 came out consistently lower, by about 4- 6%, than the unweighted average. The extra loss is concentrated in regions such as the Barents, Greenland, and Labrador Seas, with possible ice- edge shifts of several degrees of latitude.
Why it matters
Winter ice sets the stage for the rest of the seasonal cycle; underestimating its retreat also understates effects on ocean circulation, regional weather, and the timing of summer melt.
The revised projections hint at larger knock- on impacts, including potentially more snowfall over southeast Greenland and more rainfall in the Mediterranean, with implications for ice- sheet stability and flood risk in southern Europe.
Winter conditions in the UK and across Europe could therefore be affected more than previously expected.
In short, paleoclimate evidence from a naturally warmer Arctic indicates that standard climate models have been too conservative about future winter sea- ice loss. The study emphasizes that past warm periods can provide stronger constraints on model reliability than the relatively short instrumental record alone.
This is the peer- reviewed scientific paper underlying the recent news reports about greater- than- expected future Arctic winter sea- ice loss.
Key findings
Climate models show their largest biases and uncertainties for Arctic sea ice in winter (especially March), when ice cover strongly influences air- sea heat exchange, ocean mixing, and atmospheric circulation.
The authors address this by compiling the largest Arctic-wide database of mid- Holocene (MH; 5- 7 thousand years ago) sea- ice biomarkers (46 ln(PIP₂₅) observations based on the IP₂₅ biomarker and associated phytoplankton sterols from sediment cores spanning ~54- 83° N).
They use a Bayesian proxy system model (BaySIC) to translate model- simulated sea- ice concentrations into the same proxy units, accounting for non- stationary proxy seasonality (tied to local ice-breakup timing rather than fixed calendar months). A Bayesian weighting scheme then adjusts the contribution of each of 27 PMIP3/PMIP4 and CMIP models based on how well they match the MH proxies (and, in a joint analysis, historical observations). The scheme also accounts for model interdependence.
The weighted multi- model mean (WMMM) eliminates the positive winter sea- ice extent (SIE) bias and reduces uncertainty by ~85% (≈6.3 million km²), bringing it down to the level of interannual variability.
Applying the same weights to future projections (SSP1/SSP2/SSP5, corresponding to RCP2.6/4.5/8.5) yields winter SIE that is consistently ~4- 6% lower than the unweighted multi- model mean for 2090- 2099, nearly 1 million km² lower across scenarios.
Spatially, the weighted projections show higher probabilities of ice loss (and northward ice- edge shifts of up to 5.5° latitude) in the Barents, Greenland, and Labrador Seas.
Implications
Greater winter ice loss could amplify mid- latitude impacts already linked to reduced winter SIE, including colder and wetter winters in parts of Eurasia and North America, altered storm tracks, and extreme precipitation.
The revised projections suggest late- winter and early- spring snowfall over southeastern Greenland may be underestimated by >30%, and Mediterranean winter, spring precipitation could be roughly twice as high as previously projected under high- emissions scenarios, with consequences for Greenland Ice Sheet mass balance and flood risk.
The mid- Holocene provides a particularly useful out- of- sample test because orbital changes produced Arctic radiative forcing comparable in magnitude (though different in seasonality and mechanism) to anticipated future greenhouse -gas forcing. Models that perform well under those past warm conditions are expected to be more reliable for future projections.
In short, quantitative palaeoclimate constraints from a warmer Arctic indicate that standard multi- model estimates have been too conservative about the magnitude of future winter sea-ice retreat and its cascading effects.
Arctic sea ice decline has been observed across all seasons and is projected to continue in the future. Relative to historical observations, climate models show their largest biases and uncertainties during winter, when ice cover strongly regulates air–sea heat exchange, ocean mixing and atmospheric circulation. Palaeoclimate records offer opportunities to evaluate model performance beyond the historical period, but applications have remained largely qualitative. Here we compile an Arctic-wide database of mid-Holocene (5–7 thousand years ago) biomarkers to assess sea ice simulations of this past warm period. Using a recently developed proxy system model, we present a Bayesian palaeoclimate model weighting scheme that refines the multi-model mean winter sea ice extent through fully quantitative proxy-model comparisons, accounting for model interdependence and non-stationary proxy seasonality. We demonstrate that, by adjusting the contribution of each model to the ensemble mean based on proxy evidence, model weights can eliminate biases and reduce uncertainties by 85%, to the level of interannual variability. Weighted projections using the same climate models indicate that future winter sea ice extent may be nearly 1 million km2 lower than prior estimates across forthcoming decades and possible emissions scenarios, with broad implications for Arctic ecosystems, mid-latitude weather, and cryosphere stability.
A recent article in The Conversation, “Colonisation, not climate change, first primed these forests to burn,” claims that changing forest management practices, or lack thereof, are primarily responsible for Australian wildfires getting out of control, and climate change is only part of the equation. This is true, at least in some respects. Low-intensity controlled burns and timber harvesting can prevent more intense fires from being able to get started, and many indigenous people frequently burned landscapes to improve hunting grounds.
A recent article in The Conversation, “Colonisation, not climate change, first primed these forests to burn,” claims that changing forest management practices, or lack thereof, are primarily responsible for Australian wildfires getting out of control, and climate change is only part of the equation. This is true, at least in some respects. Low-intensity controlled burns and timber harvesting can prevent more intense fires from being able to get started, and many indigenous people frequently burned landscapes to improve hunting grounds. This is true of European cultures as well, however, and the framing of this article makes the mistake of forwarding well-meaning but still racist “noble savage” tropes.
The post authors, researchers from the University of Melbourne along with an Aboriginal “Traditional Custodian,” correctly state that “weather is only part of a catastrophic fire.”
They emphasize fuel load as a major component that contributes to out of control, devastating wildfires. Their research focused on the evidence of more frequent, low-intensity fires occurring in the ancient past of Australia, which suddenly stop after British colonization of the continent. They assert that “current fuel load” in Australian forests is due to human intervention, in this case because controlled burning was discontinued after the Aboriginal people were displaced.
The authors “found that for more than 800 years, frequent, low-temperature cultural burning under GunaiKurnai care held this land as stable, open woodland,” and after colonization, “[h]ot fire becomes dominant, shrubs thicken, eucalypt cover surges to nearly four times pre-colonial levels, and open woodland becomes today’s flammable forest.”
They still make nods towards what they call “human-driven climate change,” but acknowledge that it “did not start this vulnerability – it amplifies one that colonisation began.”
There are a few angles at work here, but first I will note that they are correct that controlled burning reduces fuel load and thus makes it harder for very hot fires to get started.
A major mistake of environmentalists of the past several decades was to stop timber harvesting and deadfall clearing, and limit even low intensity natural burns. Climate Realism explains how in posts about California, Texas, and Canada, among others. Environmental goals, like saving the Spotted Owl for instance, seen in Figure 1 below, led to the building up of burnable fuel that can explode into intense wildfires when an arsonist or lightning strikes.
Figure 1. Graph combining data for Federal lands showing acres harvested vs. acres burned, in millions of acres. Data from U.S. Forest Service and the National Interagency Fire Center. Graph by Anthony Watts.
Incorrect in the Conversation piece, however, is the assertion that climate change is making wildfires worse at all. The data simply do not show it, satellite data show that global wildfire occurrence has been on a downward trend for decades. (See Figure 2 below)
Figure 2: Total acreage burned by fires each year between 2003 and 2015. Trend line in red indicates a steady decline. Source: “NASA detects drop in global fires,” NASA website, June 29, 2017.
Similarly, data show that Australian wildfires are also becoming smaller since peaking in the 1970s, there is no trend towards more or worse drought. If anything, as pointed out in “Climate Blame for Australian Wildfires Ages Poorly, as Rainfall Remains Abundant,” precipitation seems to be improving for the continent since the droughts of the mid-twentieth century.
The authors are probably right that when the previous owners of the land, Aborigines, were pushed out, the land management practices changed. It’s not clear from the article whether the researchers determined with certainty that the frequent low-intensity fires were directed by Aborigines, or just at times allowed to burn when they started naturally.
Their solution is that “Traditional Owners” – that is to say, Aborigines—must be “resourced” so they can restore “healthy Country and cultural burning.”
They do not explain how Aboriginal “cultural burning” is better than normal controlled burning that is done in other parts of the world, one suspects that it is not very different.
Ancient Europeans practiced forest and moorland management as well, thinning forests via logging and controlled burns on the moors were practiced by the British. It is nonsense to imply that white settlers were unaware that these methods helped to maintain healthy woodlands. It is a sort of “noble savage” fallacy being pushed here, that native people were living in harmony with nature, and not constantly battling it, compared to the foolish nature-hating Europeans. Controlled or cultural burning is not, definitionally, living in harmony with nature. It is aggressive management and shaping the land to your own wants and needs, and the Aborigines themselves know this, as they say in the article, “wild Country is sick Country.”
Today, you can’t blame wildfires in Australia on British colonists; a better argument can be made that progressive environmentalists are the ones currently responsible.
It is good that The Conversation allowed any article that explains something as straightforward as the fact that fuel load is more to blame for severe fires than climate change, but it is shameful that it appears the only way this can get published is by making the lede about scolding the British.
Kim Rogalin posted about the controversy over the (now removed) 4th edition of the Federal Judicial Center’s Reference Manual on Scientific Evidence from the National Academy of Sciences.
Bradley says his points about RCP 8.5 were never directly answered, and that Climategate should not be forgotten, quoting Andrew Dessler from 2009 calling the emails “embarrassing and a public-relations disaster for science.”
The problem with that chapter centered on the fact it was not neutral or unbiased, as the science manual is supposed to be, but was written by activist lawyers and academics actively involved in climate lawsuits filed across the nation, plus plaintiffs, advisors, and climate experts participating in those trials. Being written by public advocates of climate lawsuits, while citing materials and using whole sections written by attorneys and academics testifying for the plaintiffs in those lawsuits, doesn’t just tiptoe along the line of the appearance of impropriety. It is flat-out improper and should have been sufficient by itself to disqualify the climate science document from inclusion in the FJC science manual….
The Academy did the right thing by removing the climate chapter from its website and formally investigating.
Jim Cooper Exchange
Enter Jim Cooper, Professor Emeritus at the University of Minnesota, who commented.
What BS. Members of National Academy of Sciences are elected based of quality of their scientific research not their political positions. Members are elected … in recognition of their distinguished and continuing achievements in original research. Membership is a widely accepted mark of excellence in science and is considered one of the highest honors that a scientist can receive. Current NAS membership totals approximately 2,700 members and 500 international members, of which approximately 200 have received Nobel prizes.” [NAS here]
I then engaged him as follows:
Bradley: Shame that climate science ruined the reputation of science in general. From Climategate to RCP 8.5.
Jim Cooper: No the shame is folks unwillingness to read the scientific literature . As retired scientist and Scientific Journal Editor, I know that the scientific evidence for Climate Change is robust and the quality of the research on par with other scientific fields. The exchange of personal opinions in a few emails did not affect the quality of the published research. I challenge you to prove otherwise using links to credible documentation.
Bradley: Are/were you part of the problem? Climategate was about real-time cheating for ‘the cause’ (and getting called out for it) and an admitted promise to attempt to skew peer review. Read the quotations! Secondly, what about all the journal articles based on RCP 8.5. Retraction? Climate models are not science….
Bradley: What about the busted paradigm of RCP 8.5-based peer-reviewed articles? Why did the profession turn the speculative (and now rejected) model scenario into a base case? Politicization or mass intellectual error?
Cooper: Again and again I will remind you and others that posts without links to credible domination for claims are noise. Links please, otherwise I will not respond.
Bradley: It is international news in the climate community that RCP 8.5 was formally rejected after a decade of primary use. It was the basis for literally thousands of published climate articles. Roger Pielke Jr. has covered this in detail. Are you following the debate? So again my question: “What about the busted paradigm of RCP 8.5-based peer-reviewed articles?” rogerpielkejr.substack.com/p/rcp85-is-officially-dead
Conclusion
My points were never directly answered by the self-anointed authority. If I had made the same case in a journal article, providing a link, what would Cooper have said? My guess is that he would state that it was not a quality journal. Such is the narrative that the experts do not want to disturb.
Climategate lives–and should never be forgotten. As a leading climate alarmist-qua-scientist, Andrew Dessler, stated back in 2009: “There is no doubt that these emails are embarrassing and a public-relations disaster for science.”
Jim Cooper Background
In a previous Facebook post concerning the Climate Change Reality Forum, Cooper wrote:
The goal of this site is: “The Climate change reality forum is an open Facebook group established to reach people with information that differs from the IPCC’s official position on this subject.” IPCC presents scientific research findings and the only valid debate must be with scientific research findings accompanied by full citation of sources not opinions. But I find that the latter predominant thus are not honest discussions of reality.
This led to more than one hundred comments, with Cooper responding to criticism by stating:
It’s your responsibility to prove your claims using data and/or previous published research findings. That’s part of critical thinking, and I repeat in science all statements and/or claims must be backed by citation of credible documentation. Please provide a link to paper where the figure appears….
How true–except when it comes to climate science and other politicized areas of scientific research.
The BBC reports that Antarctica’s gentoo penguins are “flourishing with climate change,” while CBS News reports that an iconic chinstrap penguin colony has suffered a “population collapse” driven by climate change. This bipolar framing is highly misleading.
The BBC reports that Antarctica’s gentoo penguins are “flourishing with climate change,” while CBS News reports that an iconic chinstrap penguin colony has suffered a “population collapse” driven by climate change. This bipolar framing is highly misleading. The observations show different penguin species responding differently to local environmental conditions, food availability, habitat, competition, and their own biological adaptability, while the evidence for attributing individual population changes specifically to human-caused climate change is considerably less certain than the headlines suggest.
Then, on October 7, CBS News published an AFP report titled “Iconic penguin colony sees ‘population collapse’ driven by climate change, study finds.” That article reports that the chinstrap penguin population on Zavodovski Island in the South Sandwich Islands declined from approximately 1.09 million breeding individuals in 2011 to 402,000 in 2025, a decline of about 63 percent.
So, there you have it. Penguins are flourishing because of climate change, and penguins are collapsing because of climate change. Apparently, whatever happens to a penguin, climate change gets the diagnosis.
The BBC describes gentoo penguins as successful “climate-change winners,” citing their ability to tolerate warmer and wetter conditions, change prey, replace lost egg clutches, and adjust breeding schedules.
CBS presents a much darker picture. British Antarctic Survey researcher Norman Ratcliffe told AFP concerning the chinstrap decline:
“We think that climate change operating through food webs is probably the main driver.”
The key word is “probably.”
That is an appropriate scientific qualification. CBS’s headline, however, transforms “probably” into a population collapse “driven by climate change.” The difference matters because observing a decline is not the same scientific task as determining its cause.
The proposed mechanism involves ocean conditions affecting krill availability, which then affects penguin feeding, breeding, survival, and ultimately population size. That is plausible, but it is a chain of ecological relationships, not a thermometer directly killing penguins.
And then there are the penguins that apparently didn’t read the climate script.
On the very same Zavodovski Island where chinstrap penguins declined 63 percent, CBS reports that macaroni penguins increased from approximately 338,000 in 2011 to 433,000 in 2025, an increase of about 28 percent.
The chinstraps and macaronis inhabit the same island. They are surrounded by the same ocean and exposed to the same broad climatic conditions. Yet one population declined dramatically while the other increased substantially.
Researchers offer a perfectly reasonable biological explanation. Macaroni penguins have a broader diet than chinstraps and therefore can exploit alternative food sources when conditions change.
Exactly.
That demonstrates why simplistic climate attribution is so unrealistic. Species-specific diet, competition, prey abundance, breeding behavior, habitat, predation, migration, volcanic activity, and adaptability all influence wildlife populations. Climate may influence some of those factors, but simply observing a population change does not establish climate change as its dominant cause.
The BBC’s gentoo story reinforces that point. Gentoos are highly adaptable. They eat a variety of prey, alter breeding behavior, and tolerate a broader range of environmental conditions than some other Antarctic penguins. Their success is a reminder that living organisms are not passive objects waiting helplessly for environmental conditions to change.
Adaptation is one of the most fundamental features of biology.
There is also an important historical warning against treating every disappearing penguin colony as evidence of catastrophe. In 2016, alarming headlines claimed that roughly 150,000 Adélie penguins at Cape Denison might have died after the giant B09B iceberg grounded nearby and greatly increased the distance birds had to travel to open water. Subsequent reporting raised an obvious alternative: many of the missing penguins may simply have relocated.
A reduction in penguins counted at one breeding colony is not necessarily equivalent to that number of dead penguins. Birds can skip breeding, disperse, or establish themselves elsewhere.
Then came an extraordinary discovery. In 2018, researchers reported a previously unknown “supercolony” of more than 1.5 million Adélie penguins in Antarctica’s Danger Islands. Satellite imagery showing extensive guano stains led researchers to the remote colonies, which had escaped scientific surveys for years.
Those birds were not proven to be the missing Cape Denison penguins, an important distinction. But the episode demonstrated something equally important: scientists cannot confidently describe continent-wide population changes if substantial populations remain undiscovered.
Penguin movement has also been directly documented elsewhere. The British Antarctic Survey reported in 2019 that the Halley Bay emperor penguin colony experienced catastrophic breeding failures when unstable sea ice broke apart before chicks were ready to survive in the ocean. Yet researchers simultaneously observed a large increase at the nearby Dawson-Lambton colony, indicating that adult birds had moved to another breeding site.
That does not erase the genuine chick mortality at Halley Bay, but it demonstrates that penguin populations are dynamic and that colony counts can reflect movement as well as mortality.
Scientists themselves have learned from this. A 2017 Woods Hole Oceanographic Institution study acknowledged that earlier emperor penguin models had inadequately represented movement among colonies and incorporated dispersal into later modeling.
The BBC’s story provides another reminder of how complicated Antarctic ecology actually is. Its headline suggests gentoo penguins are “flourishing” inside an active Antarctic volcano on Deception Island. Yet the article acknowledges that penguins do not presently breed inside the caldera. The photographed birds are visiting the area while molting, taking advantage of its warmth and shelter.
Even more interestingly, the British Antarctic Survey reported in 2017 that eruptions near Deception Island repeatedly devastated local gentoo populations during the past 7,000 years.
Apparently volcanoes can be good for penguins when they’re providing geothermal heating and bad for penguins when they’re erupting.
Different biological responses to environmental change are entirely possible, of course. But if every possible population outcome can be presented as confirmation of the same hypothesis, journalists should be especially careful about distinguishing observations from attribution.
“Collapse” describes what happened to the number of chinstraps counted on Zavodovski Island. “Flourishing” describes the increasing gentoo population reported by the BBC. Neither word establishes why those changes occurred.
Antarctica is enormous. The Antarctic Peninsula, South Sandwich Islands, East Antarctica, Ross Sea, and other regions have substantially different ecological conditions. Gentoo, chinstrap, macaroni, Adélie, and emperor penguins have different diets, breeding strategies, relationships with sea ice, habitats, and abilities to adapt.
It would be remarkable if all of them responded identically to environmental change.
Indeed, the observations being reported by the BBC and CBS paint a much more interesting picture than either headline suggests. Some penguin populations are declining. Others are increasing. Some move. Some exploit different food sources. Some tolerate changing conditions better than others. Volcanoes, sea ice, prey availability, breeding habitat, predation, competition, and weather all matter.
Climate change may be one factor influencing those systems, but attributing an individual population increase or decrease specifically to anthropogenic warming requires evidence demonstrating the causal chain and weighing competing explanations. The CBS researcher’s careful use of the word “probably” reflects that uncertainty, and then the headline largely eliminates it.
The real lesson from these stories isn’t that penguins are simultaneously being saved and destroyed by climate change. It is that Antarctic ecosystems are complicated, penguins are adaptable, population monitoring remains imperfect, and wildlife populations have never been static.
The media should report that complexity instead of forcing every population change into the same climate narrative. Otherwise, the formula becomes absurdly predictable: Penguins thriving? Climate change. Penguins declining? Climate change. Penguins missing? Climate change. Penguins discovered somewhere else?
Who knows? It seems the media makes it up as they go along.


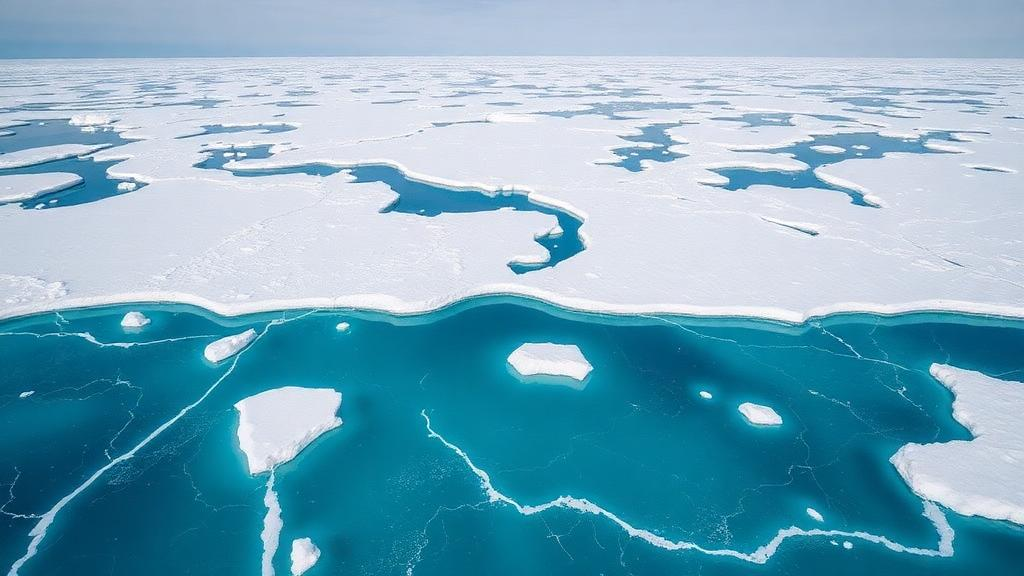
You must be logged in to post a comment.