Global warming, climate change, all these things are just a dream come true for politicians. I deal with evidence and not with frightening computer models because the seeker after truth does not put his faith in any consensus. The road to the truth is long and hard, but this is the road we must follow. People who describe the unprecedented comfort and ease of modern life as a climate disaster, in my opinion have no idea what a real problem is.
Author and Teacher Oliver Gough is a PhD candidate and playwright researching climate change theatre at the University of Queensland, where he also teaches.
The only way out is through: Embracing the existential weirdness of the era of climate change
Oliver Gough
…
Learning to die?
Roy Scranton is another writer who advocates for a deep and scary thought experiment to move past terminal inaction and sluggishness on climate change. He boldly suggests: “If we want to learn to live in the Anthropocene, we must first learn how to die.” The practice of coming to terms with an extinction of human beings and the existence of a planet without us can lead to a humbling, realistic and truly ecological way of thinking.
This extension of Morton’s “dark ecology” further does away with assumptions of human triumph over the elements, and accepts that: “Carbon-fuelled capitalism and its techno-utopian ideologues have promised infinite growth and infinite innovation, yet they have proven incapable of saving us from the disaster they have made.”
The answer? Imagining and learning the practice of death, preparing for it as you would a terminal diagnosis. This isn’t to lay down and welcome it, but to gain perspective and expand the range of responses. Economics and mathematics can’t quite imagine or express this experiment. Something like climate change, or the death of a species, is felt on levels beyond that realm.
…
Admittedly, ocean acidification, social upheaval, and species extinction are problems that humanities scholars, with their taste for fine-grained philological analysis, esoteric debates, and archival marginalia, might seem remarkably ill-suited to address … But the conceptual and existential problems that the Anthropocene poses are precisely those that have always been at the heart of humanistic inquiry: What does it mean to be human? What does it mean to live? What is truth? What is good? In the world of the Anthropocene, the question of individual mortality — What does my life mean in the face of death? — is universalized and framed in scales that boggle the imagination.
Will students be cheered and encouraged if they decide to die early to avoid the rush?
I guess the takeaway is, if you want your kids to learn theatre and performance arts without also learning we all need to prepare for imminent death, probably best to choose somewhere other than the University of Queensland.
There is zero chance anthropogenic climate change in the foreseeable future will make the world uninhabitable for humans.
If a bunch of monkeys with brains the size of matchboxes could figure out how to survive in a much warmer world, I’m certain we could figure it out.
Oliver Gough is not alone in believing the world is about to end. A disturbing percentage of Aussie school kids believe they won’t survive to adulthood, because of climate change.
Oliver is free to embrace his whacky beliefs, but I am profoundly disturbed someone who holds such extreme views is a teacher at a major university. I am also concerned that my tax dollars are helping to give this guy a platform to express those extreme views to a larger audience, via a government funded news outlet.
Perhaps administrators or parents should take a closer look at exactly what children entrusted to the care of University of Queensland are being taught.
The Supreme Court recently heard a major case, Seven County Infrastructure Coalition v. Eagle County, Colorado, that will affect the scope of the National Environmental Policy Act (NEPA). The case concerns the permitting of a proposed Utah railway that would ship oil from the Uinta Basin, potentially quadrupling its oil production. The 88-mile Uinta Basin Railway would connect the oil fields of northeastern Utah to the national rail network running alongside 100 or so miles of the Colorado River to reach oil refineries on the Gulf Coast.
1 The Supreme Court has heard a major NEPA case that could affect investment in energy and other infrastructure projects in America.
2 Seven County Infrastructure Coalition v. Eagle County, Colorado will decide whether permit applicants must anticipate far-flung speculative impacts over which federal agencies have no control.
3 The case involves an 88-mile railway accessing oil production in the Uinta Basin in Utah, allowing expansion of domestic oil production as well as access to essential minerals in the region.
4 Green advocates sued the Surface Transportation Board because it approved without considering alleged but inestimable impacts far from the project.
5 Lower courts have sided with the Greens, who oppose mineral and energy development.
6 SCOTUS is expected to clarify the burdens projects must face to comply with NEPA, which has become a tool of delay and denial by those opposing projects of all kinds in the United States.
7 Congress is also looking at NEPA streamlining as the act has become an impediment to rational development in the United States.
The Supreme Court recently heard a major case, Seven County Infrastructure Coalition v. Eagle County, Colorado, that will affect the scope of the National Environmental Policy Act (NEPA). The case concerns the permitting of a proposed Utah railway that would ship oil from the Uinta Basin, potentially quadrupling its oil production. The 88-mile Uinta Basin Railway would connect the oil fields of northeastern Utah to the national rail network running alongside 100 or so miles of the Colorado River to reach oil refineries on the Gulf Coast. According to The Hill, at issue is whether and when upstream and downstream environmental impacts should be considered as part of federal environmental reviews. The company behind the railway and a group of Utah counties appealed a lower court decision to the Supreme Court, arguing that those indirect impacts are beyond the scope of the federal reviews.
Background
The case concerns a rail line to support oil development and mineral mining. In 2021, the federal Surface Transportation Board (STB) issued a 3,600-page environmental impact statement to comply with NEPA and approved the rail line. The NEPA mandates that federal agencies assess the environmental effects of projects within their authority. Any major initiative that is managed, regulated, or authorized by the federal government must undergo a NEPA evaluation, a process that can span years and frequently exposes projects to legal challenges.
The STB analyzed the railway’s potential effectson local water resources, air quality, protected species, recreation, local economies, the Ute Indian tribe, and other factors. Environmental groups, however, sued the agency, saying that it failed to examine sufficiently how the railway might affect the risk of accidents on connecting lines hundreds of miles away and to assess emissions in “environmental justice communities” on the Gulf Coast from increased oil shipments, among other supposed shortcomings.
According to the Wall Street Journal editorial board, “a D.C. Circuit Court of Appeals panel sided with the plaintiffs and told the STB it must consider the line’s upstream and downstream effects even if they were hard to predict and beyond the control of the agency and developers. This includes the effects of oil shipments on Gulf Coast refiners and their contributions to climate change.” The appeals court ruling found that the federal STB violated the Endangered Species Act and the Interstate Commerce Commission Termination Act when it permitted the project.
Furthermore, the editorial board also explained that lower court judges—those on the D.C. and Ninth Circuits—ignored the Supreme Court’s past rulings and imposed arbitrary permitting requirements with no limiting principle. The STB lacks authority over Gulf Coast refiners and cannot prevent climate change.
Court Rulings Regarding NEPA
The Supreme Court has heard other related cases and held that agencies need not consider indirect and unpredictable impact, most recently in a 2004 case, Department of Transportation v. Public Citizen. In that case, theSupreme Court held that agencies need only analyze environmental impact with “a reasonably close causal relationship” over which they have “statutory authority” and which they can prevent.
In 2020, the Supreme Court green-lit approval for permits for the Atlantic Coast Pipeline after nearly seven years of litigation, but the pipeline was scrapped due to legal delays that raised project costs significantly. It takes an average of 4.2 years to litigate a NEPA challenge, which adds to the four or more years to obtain a federal permit. These delays are what frustrate investment in new projects, slowing job creation and economic expansion in the United States.
The Supreme Court is tackling a case involving the scope of a federal environmental law, NEPA, that involves a rail line to move oil. In this case, lower courts agreed with environmental groups, who are challenging the government’s permit approval of the rail line. The case is instrumental to the issue of what should be considered when determining potential environmental damages. Congress recognizes that NEPA needs reform as delays over lawsuits have killed projects and dramatically increased their costs and it continues to debate ways to make federal permitting easier and quicker. Until that reform happens, however, Supreme Court Justices need to reign in the environmental limits of NEPA so that needed projects can progress in America.
Last month a small but powerful cyclone named Chido made landfall in Mayotte before sweeping into Mozambique, causing considerable damage and leading to the loss of around 100 lives. Days after the tragedy, the Green Blob-funded Carbon Brief noted that scientists have “long suggested” that climate change is making cyclones worse in the region, while Blob-funded World Weather Attribution (WWA) at Imperial College London made a near-instant and curiously precise estimate that a Chido-like cyclone was about 40% more likely to happen in 2024 than during the pre-industrial age.
Last month a small but powerful cyclone named Chido made landfall in Mayotte before sweeping into Mozambique, causing considerable damage and leading to the loss of around 100 lives. Days after the tragedy, the Green Blob-funded Carbon Brief noted that scientists have “long suggested” that climate change is making cyclones worse in the region, while Blob-funded World Weather Attribution (WWA) at Imperial College London made a near-instant and curiously precise estimate that a Chido-like cyclone was about 40% more likely to happen in 2024 than during the pre-industrial age. Not to be outdone, Green Blob-funded cheerleader the Guardian chipped in with the obligatory “cyclones are getting worse because of the climate emergency”. Almost unnoticed, it seems, among all the Net Zero dooming and grooming was a science paper published during December by Nature that found no increase in the destructive power of cyclones – the generic term for typhoons and hurricanes – in any ocean basin over the last 30 years. In the South Indian basin, the location of cyclone Chido, there was a dramatic decrease in both frequency and duration in recent times.
Reality rarely gets much of a look-in these days when fanatical Net Zero activism is afoot, but the paper, written by a group of Chinese meteorologists, makes its case by considering the facts and the data. The scientists apply a “power dissipation index” (PDI) which they consider superior to single measure indicators since it combines storm intensity, duration and frequency. The graphs below show the cumulative index for tropical cyclones across all ocean basins along with a global indication.
Downward trends in the cumulative PDI can be seen in a number of Pacific regions, while the trend holds steady in the North Atlantic. The southern Indian ocean downward trend is particularly pronounced while the overall global line is also heading in a similar direction.
So why does all this scientific twaddle get written by the green activists in mainstream media? Much of it arises from the new pseudoscience that claims it can tie individual weather events to human-caused climate change. Press releases peddling climate Armageddon are issued days after a natural disaster and are eagerly reprinted by activist journalists promoting the Net Zero fantasy. The distinguished science writer Roger Pielke Jr. is a fierce critic of this new pseudoscience, which he calls weather attribution alchemy. In a recent Substack post in the aftermath of Chido, he noted that the WWA at Imperial College simply assumes the conclusion that it seeks to prove by accepting that every storm is made stronger because of warmer oceans. Using this explanation, continues Pielke, it is straightforward to conclude that the storm was made more likely due to climate change. Or as Imperial states: “The difference in the storm intensity and likelihood of this storm intensity between the counterfactual climate and today’s climate can be attributed to climate change.”
As the new Chinese paper shows, the matter is not quite so simple. Pielke notes that tropical storms encounter numerous environmental influences such as vertical wind shear and storm-induced ocean surface cooling, even when they remain over warmer waters. “Such complexities mean that simple storyline attribution – warmer oceans predictably mean stronger storms – is inappropriate when used to characterise the behaviour of individual storms,” he argues. Pielke also comes down hard on the statistical evidence backing the WWA claims. Even if storms such as Chido were more likely in the future, it would take a very long time to detect a significant change using the threshold 90% confidence set down by the Intergovernmental Panel on Climate Change (IPCC). And by very long time, he means thousands of years.
“Perhaps that is why assumptions are favoured over evidence,” suggests Pielke.
There were plenty of assumptions on display in a now routine end-of-year weather report from the BBC headed: ‘A year of extreme weather that challenged billions.‘ Written by Esme Stallard, it claims that record-breaking heat brought extreme weather including hurricanes and month-long droughts. Pride of place is given to Dr. Friederike Otto, lead of WWA and Senior Lecturer in Climate Science at Imperial, who claimed: “We are living in a dangerous new era – extreme weather caused unrelenting suffering.” “The impacts of fossil fuel warming has never been clear or more devastating than in 2024,” she added.
The redoubtable Paul Homewood is unimpressed with Stallard’s opening line about increasing extreme weather and has filed a complaint with the BBC. Stallard goes on to list a handful of random events, “but fails to provide any evidence that these are anything other than natural events which happen all the time”, states Homewood. “Nor is any evidence provided that such events have been getting more frequent or extreme over time,” he adds.
The BBC story highlighted typhoons in the Philippines as well as hurricane Beryl and stated that such events may be increasing in intensity due to climate change. Official data do not show any evidence of them becoming more powerful over time, notes Homewood. Much play was made of a recent drought in the Amazon, but Homewood points out that the World Bank Climate Portal reveals that rainfall has increased in the area by 5% over the last 30 years. Throughout the report, observes Homewood, the BBC bases its claims on weather attribution computer models. “However, computer models are not evidence, and can be manipulated to provide whatever results are desired. That is why they are widely derided by the wider scientific community,” he states.
For Roger Pielke, extreme weather attributions are “puzzling”. The most charitable explanation for their proliferation is that there is a demand for them, including from many in the media. The demand will be filled by someone, he concludes. “A less charitable explanation is that there is a systematic effort underway to contest and undermine actual climate science, including the assessments of the IPCC, in order to present a picture of reality that is simply false in support of climate advocacy. We might call that pseudo-scientific gaslighting,” he suggests.
Chris Morrison is the Daily Sceptic’sEnvironment Editor.
As an amateur scientist, I am all in favor of one aspect of the emergence of artificial intelligence (AI). I employ it as the world’s fastest librarian, able to gather and summarize an amazing amount of data in a few moments.
As an amateur scientist, I am all in favor of one aspect of the emergence of artificial intelligence (AI). I employ it as the world’s fastest librarian, able to gather and summarize an amazing amount of data in a few moments.
Recently I thought I might use AI to educate me on the science of autism and vaccines. Note that I came into this question knowing almost nothing about any underlying scientific studies of the possible connection between autism and vaccines, other than numerous passionate claims from both sides of the question on the web.
Here’s how I went about gathering and checking the information. Thanks to a heads-up from Charles the Moderator, I use an AI called perplexity.ai. I’ve stuck with it for a curious reason—perplexity once told me it was reluctant to answer a question I asked about rainfall in a remote part of the Sahara desert because there was so little data available that it might be hallucinating an answer … I took that as a good sign that it recognizes that it has limitations.
Me: List major studies showing that autism either is or is not associated with vaccination.
Note the construction. I’ve found that in doing scientific research it is important to specifically ask for evidence for both sides of the question. You want to avoid general questions like “What is known about autism and vaccines”. With that kind of phrasing, often an AI will not fully explore the question space, leaving out important evidence for one side or the other.
Here’s perplexity’s answer to my question above:
Several major studies have investigated the potential link between vaccines and autism. Here’s a list of key studies showing no association between vaccines and autism:
Taylor et al. (1999):
Examined 498 children with autism in North Thames, England
Found no difference in autism rates between vaccinated and unvaccinated children
No clustering of autism diagnoses after MMR introduction
Madsen et al. (2002):
Studied 537,303 children in Denmark
No increased risk of autism in MMR-vaccinated children
No association between age at vaccination, time since vaccination, or date of vaccination and autism development
Jain et al. (2015):
Evaluated about 100,000 children with older siblings with or without autism
No increased risk of autism spectrum disorder (ASD) associated with MMR vaccination
Danish study (1991-1998):
Included over 500,000 children
No link found between MMR vaccine and autism or autism spectrum disorders
Meta-analysis by Taylor et al. (2014):
Analyzed 10 studies involving over 1.2 million children
Reaffirmed no association between vaccines and autism
Suggested MMR vaccine may actually decrease autism risk
Hmmm, sez I …
Now, as I mentioned above, AIs do hallucinate. So my next directive to perplexity is:
Verify that each of those is a real study, not a hallucination.
I‘ll verify the studies mentioned in the search results:
Brent Taylor et al. (1999): This is a real study examining 498 children with autism in North Thames, England.
Madsen et al. (2002): This is a genuine study published in the New England Journal of Medicine, involving 537,303 children in Denmark.
Taylor et al. (1999) reanalysis: This appears to be a real reanalysis of the original Taylor study, though I don’t have enough information to confirm its exact publication details.
Hviid et al. (2019): This is a real nationwide cohort study in Denmark, published in the Annals of Internal Medicine, involving 657,461 children.
Time-trend analysis using the UK General Practice Research Database: This is a real study, though specific authors aren’t mentioned in the provided information.
Noticing that one study was left out, I asked:
Verify that 3. Jain et al. (2015) is a real study, not a hallucination.
Yes, Jain et al. (2015) is a real study, not a hallucination. This study is mentioned multiple times in the search results:
It’s listed in the Children’s Hospital of Philadelphia vaccine education center information
The full citation is provided: “Jain A, Marshall J, Buikema A, et al. Autism occurrence by MMR vaccine status among US children with older siblings with and without autism. JAMA 2015;313(15):1534-1540.”
The JAMA (Journal of the American Medical Association) article details are given, including the publication date of April 21, 2015
The study’s methodology and findings are summarized, noting it evaluated about 100,000 younger siblings and found no association between MMR vaccination and increased risk of autism spectrum disorder
It’s referenced in a Science Daily article about MMR vaccine and autism
The study is also cited in an Immunize.org document listing evidence that MMR vaccine does not cause autism
These multiple, consistent references across different sources confirm that Jain et al. (2015) is indeed a real study examining the relationship between MMR vaccination and autism risk.
All of these studies appear to be real based on the information provided. However, for some studies, I don’t have enough details to fully verify their publication information or authorship.
Upon request, Perplexity also provided details for all of the other studies it found in its research, viz:
Quebec study of 27,749 children from 55 schools: This is likely a real study, but I don’t have enough information to confirm specific authors or publication details.
Danish national registry study of 537,303 children (1991-1998): This is likely referring to the Madsen et al. (2002) study mentioned earlier.
Atlanta study comparing 624 autistic children with 1824 matched controls: This appears to be a real study, though I don’t have enough information to confirm specific authors or publication details.
English study of 12,810 children born 1991-1992: This is likely a real study, but I don’t have enough information to confirm specific authors or publication details.
UK study of 100,572 children born 1988-1997 using the General Practice Research Database: This appears to be a real study, though I don’t have enough information to confirm specific authors or publication details
I found it fascinating to see its judgment of the validity of the information it is examining.
Moving on, I asked:
Provide a list of key studies claiming some association between vaccines and autism
Based on the search results provided, there are no credible studies claiming an association between vaccines and autism. The search results consistently report that extensive research has found no link between vaccines and autism. However, one flawed study is mentioned that initially sparked the controversy:
Wakefield et al. (1998):
Published in The Lancet (later retracted)
Suggested a potential link between MMR vaccine and autism
The research was later found to be fraudulent
The lead author lost his medical license
The medical journal retracted the paper
It’s important to note that this study has been thoroughly discredited and numerous subsequent studies have found no link between vaccines and autism.
————-
Look, friends, I know that there are real reasons to be cautious about vaccines. These include the steep increase in the number of recommended childhood vaccines as well as the increase in the number of adjuvants, preservatives, and other components in modern vaccines.
However, from this examination of solid scientific evidence about the question, it is clear that autism is not among the reasons to be cautious. Well-designed studies have repeatedly failed to find any link between vaccines and autism, and no studies have demonstrated such a link. Pick another objection, that one’s done and dusted.
Finally, some folks say that vaccinations don’t really protect us against diseases. While this may well be true about the COVID-19 vaccine, here are the observed rates of cases and deaths before and after the introduction of vaccines for a variety of illnesses.
Zooming in close reveals interesting pre- and post-vaccine morbidity and mortality statistics. Cause of the most deaths before vaccines? Whooping cough aka pertussis aka croup, 30 deaths per million. Followed by flu/pneumococcal disease (24/million), polio (22/m), diphtheria (14/m), and tetanus (3/m).
And here is what Jonas Salk did with his polio vaccine.
So that’s the end of the evidence and the beginning of the discussion. First, I know that folks are passionate about this question. So please, don’t shoot the messenger.
What I’ve presented above is how to use perplexity or any AI to unearth scientific evidence about very specific questions of a) autism and vaccines and b) the overall efficiency of each vaccine. I take no further position other than advising caution on everything.
Next, the myriad of questions about vaccines will not be solved on this web page. So let me ask folks to not take sides in the comments. It won’t help. As I said above, other than those two questions of autism and efficiencies, other reasons for caution remain. Exactly what is in each vaccine? What concentration? When, where, and how was it tested?
So in lieu of taking sides, let me invite people instead to use AI to dig out answers to those particular questions that remain in your mind about some particular vaccine, to search for solid scientific evidence, and to set aside the impassioned web-based claims and position-taking in favor of an actual search for current scientific knowledge.
Finally, one thing to emphasize. As the first graphic above shows, there is no one vaccine question just as there is no one vaccine. There’s no overall good/bad, black/white issue.
Instead, every vaccine and every component of every vaccine has its own story, its own effects, and its own unanswered questions. For example, in the US, in what may be an excess of caution, childhood vaccines contain no mercury, while the adult versions of the vaccines contain millionths of a gram. Different issues, different relevant questions. Another example. I lived through the time of polio and Jonas Salk’s miraculous vaccine. And I even worked for several months as the night attendant of an adult polio victim spending the rest of his entire life in an iron lung, paralyzed from the neck down … he was married with one child and had just finished his medical residency when he was struck down. I would read to him, and play chess with him … dear friends, you don’t ever want to see that happen to anyone, much less your child.
The Salk vaccine brought a huge benefit. I can guarantee we don’t want to go back to those days. Different vaccines, different benefits, different questions, different issues, there’s no one overarching “Are vaccines good or bad?” question.
My best regards to each of you, stay well out there in this lovely but deadly world,
w.
PS—I’m still persona non-grata on X, with my account improperly suspended as I explain in my blog post below:
I ask anyone on X to use any leverage you have to get the X censorship gods to unsuspend my account, @WEschenbach. If you could do me the honor of linking to my blog post above, it will allow my voice to be heard.
As Usual: I ask when you comment that you quote the exact words you are discussing, so we can all be clear about your subject.
Welcome to Germany’s green economic miracle. The year is 2025!
Germany’s so-called Energiewende (transition to renewable energies) has had one unmistakable result: Germany now finds itself rapidly nearing the brink of a third world country where the power supply is no longer reliable and brownouts becoming more and more a daily routine.
Welcome to Germany’s green economic miracle. The year is 2025!
Germany’s so-called Energiewende (transition to renewable energies) has had one unmistakable result: Germany now finds itself rapidly nearing the brink of a third world country where the power supply is no longer reliable and brownouts becoming more and more a daily routine.
What’s happening is the opposite of what was once promised by the know-it-all climate wisemen: “Green energies would lead to a clean and prosperous country that would be the envy of the world.
So much for their fantasies.
The reality, as reported yesterday by Germany’s leading daily, Bild here: Germans in south Germany are now being told that their laundry and e-car charging are to be done only at certain times!
According to online Bild yesterday: “People in Baden-Württemberg should use as little electricity as possible on Friday from 8 am to 11 am. The transmission capacities of the power lines from the north of Germany to the southwest were over-utilized,”
Consumers were asked to avoid the use of all energy-intensive appliances.
Grid operator TransnetBW issues energy supply red alert yesterday
Recall that Germany’s green energy masterminds decided that it would be best to decommission the country’s fleet on nuclear power plants, and to produce weather-dependent power with wind farms operating in the north of country, and then supply it to southern Germany via power transmission lines. There’s on problem with the masterplan from the green masterminds: the wind doesn’t blow all the time and so shortages result and rationing becomes necessary!
According to the StromgGedacht from grid operator TransnetBW in Stuttgart, to avoid overloading the grid: “Electric vehicles or batteries (of laptops etc.) should also not be charged from 8 a.m. to 11 a.m. if this can be avoided.”
CfD subsidies hit a record high of £2362 million last year, beating the previous record set in 2020, when market electricity prices were exceptionally low because of lockdowns. The LCCC data runs up to Dec 22nd, so the final figure for 2024 will be slightly higher still.
CfD subsidies hit a record high of £2362 million last year, beating the previous record set in 2020, when market electricity prices were exceptionally low because of lockdowns. The LCCC data runs up to Dec 22nd, so the final figure for 2024 will be slightly higher still.
Subsidies covered 30.2 TWh of generation, at an average of £78/MWh. In other words, renewable schemes covered by CfD were paid about double the market price in overall terms.
Wind power accounted for £1970 million of the overall subsidy, with biomass adding a further £299 million.
Total subsidies for wind power tot up to £9.1 billion since the CfD scheme started in 2016, with biomass costing another £2.5 billion.
Meanwhile subsidies for wind power via the Renewable Obligation Scheme cost a further £4.6 billion in the year ended March 2024.
In short, wind power is now being subsidised to the tune of about £7 billion a year, when constraint payments are included.
When considering factors that spur a state’s economic development and growth, how a state regulates its utilities is too often overlooked. That could not be more important now that the needs of AI and data centers have created the highest power demand in a generation, requiring a buildout of at least $50 billion just for new generation and another $250 billion for data centers.
Fresh peaches growing on branches in garden outdoors, closeup. Space for text
When considering factors that spur a state’s economic development and growth, how a state regulates its utilities is too often overlooked. That could not be more important now that the needs of AI and data centers have created the highest power demand in a generation, requiring a buildout of at least $50 billion just for new generation and another $250 billion for data centers.
The states which can provide stability and predictability to utilities will be the winners in this race. Georgia proves it: Atlanta is already among the top 10 data center markets, and construction grew 76% year-over-year to 1,281 Megawatts in the first half of this year.
A big ingredient in this success is Georgia’s utility regulation structure and the advantages it affords Georgians, especially when compared to deregulated states in the Northeast. The Peach State’s well-regulated energy market not only ensures affordable rates and reliable service, but actively supports economic growth in ways that deregulated states struggle to match.
Georgia’s stability and predictability are a long-term competitive advantage in the eyes of businesses seeking sites for new plants or facilities across the country. In contrast, the deregulated energy markets in states like New York, New Jersey, and Massachusetts usually face higher rates plus price volatility and reliability issues that are a big part of the equation guiding where businesses locate operations—especially large industrial consumers.
The proof is in the pudding. Georgia consistently ranks among the best states for business. Between July 1, 2023, and June 30 of this year, the Georgia Department of Economic Development’s Global Commerce team supported 429 facility expansions and new locations, resulting in more than $20.3 billion in investment and the commitment of 26,900 new, private sector jobs statewide.
Georgia’s Public Service Commission oversees the Peach State’s investor-owned utilities, while the state’s cooperatives and municipal utilities are regulated by their member-elected boards of directors and their citizen-elected city councils, respectively. This structure regulates utility rates and oversees infrastructure investments, ensuring energy prices remain affordable and predictable for families and businesses. This steady foundation allows businesses to forecast energy costs accurately, which makes for better-informed long-term investment decisions.
Data centers are not the only investments that result. Take the case of the Hyundai Motor Group’s recent decision to build a $5.5 billion electric vehicle plant in Bryan County. Highlighting the state’s appeal to major investors, the plant is expected to create 8,000 jobs and stimulate significant economic activity in the region.
Consider the case of Plant Vogtle, a nuclear joint venture among the state’s utilities. Vogtle Units 3 and 4, one of the largest construction projects in the United States, would not have been possible without Georgia’s regulatory framework. Plant Vogtle generated thousands of construction jobs and permanent positions and represents a significant investment in the state’s energy infrastructure, providing reliable, emissions-free electricity. That is an attractive option for employers that prioritize clean energy.
Georgia’s regulatory framework also supports sustainable economic growth by encouraging investments in renewable energy and clean technologies. Georgia ranks among the top seven states for solar capacity as a result of its rapid expansion of solar power.
This focus on sustainability not only addresses environmental concerns but also creates new economic opportunities. The growth of the universal solar industry in Georgia has led to the creation of numerous jobs and has attracted investments from major solar companies. In deregulated states, the fragmented approach to energy regulation can hinder the development of renewable energy projects, limiting both economic and environmental benefits.
As other states, especially those with deregulated energy markets, look to enhance their economic development efforts, Georgia’s approach provides valuable lessons. A focus on stability, infrastructure investment, and support for innovation drives economic growth, jobs and ensures affordable, reliable and ever-cleaner electricity for decades.
Georgia’s families and businesses are the winners, and that is a model to which every state should aspire.
The post below updates the UAH record of air temperatures over land and ocean. Each month and year exposes again the growing disconnect between the real world and the Zero Carbon zealots. It is as though the anti-hydrocarbon band wagon hopes to drown out the data contradicting their justification for the Great Energy Transition. Yes, there was warming from an El Nino buildup coincidental with North Atlantic warming, but no basis to blame it on CO2.
The post below updates the UAH record of air temperatures over land and ocean. Each month and year exposes again the growing disconnect between the real world and the Zero Carbon zealots. It is as though the anti-hydrocarbon band wagon hopes to drown out the data contradicting their justification for the Great Energy Transition. Yes, there was warming from an El Nino buildup coincidental with North Atlantic warming, but no basis to blame it on CO2.
As an overview consider how recent rapid cooling completely overcame the warming from the last 3 El Ninos (1998, 2010 and 2016). The UAH record shows that the effects of the last one were gone as of April 2021, again in November 2021, and in February and June 2022. At year end 2022 and continuing into 2023 global temp anomaly matched or went lower than average since 1995, an ENSO neutral year. (UAH baseline is now 1991-2020). Now we have had an usual El Nino warming spike of uncertain cause, unrelated to steadily rising CO2 and now dropping steadily.
For reference I added an overlay of CO2 annual concentrations as measured at Mauna Loa. While temperatures fluctuated up and down ending flat, CO2 went up steadily by ~60 ppm, a 15% increase.
Furthermore, going back to previous warmings prior to the satellite record shows that the entire rise of 0.8C since 1947 is due to oceanic, not human activity.
The animation is an update of a previous analysis from Dr. Murry Salby. These graphs use Hadcrut4 and include the 2016 El Nino warming event. The exhibit shows since 1947 GMT warmed by 0.8 C, from 13.9 to 14.7, as estimated by Hadcrut4. This resulted from three natural warming events involving ocean cycles. The most recent rise 2013-16 lifted temperatures by 0.2C. Previously the 1997-98 El Nino produced a plateau increase of 0.4C. Before that, a rise from 1977-81 added 0.2C to start the warming since 1947.
Importantly, the theory of human-caused global warming asserts that increasing CO2 in the atmosphere changes the baseline and causes systemic warming in our climate. On the contrary, all of the warming since 1947 was episodic, coming from three brief events associated with oceanic cycles. And now in 2024 we have seen an amazing episode with a temperature spike driven by ocean air warming in all regions, along with rising NH land temperatures, now dropping below its peak.
Chris Schoeneveld has produced a similar graph to the animation above, with a temperature series combining HadCRUT4 and UAH6. H/T WUWT
With apologies to Paul Revere, this post is on the lookout for cooler weather with an eye on both the Land and the Sea. While you heard a lot about 2020-21 temperatures matching 2016 as the highest ever, that spin ignores how fast the cooling set in. The UAH data analyzed below shows that warming from the last El Nino had fully dissipated with chilly temperatures in all regions. After a warming blip in 2022, land and ocean temps dropped again with 2023 starting below the mean since 1995. Spring and Summer 2023 saw a series of warmings, continuing into October, followed by cooling in November and December.
UAH has updated their TLT (temperatures in lower troposphere) dataset for December 2024. Due to one satellite drifting more than can be corrected, the dataset has been recalibrated and retitled as version 6.1 Graphs here contain this updated 6.1 data. Posts on their reading of ocean air temps this month are ahead of the update from HadSST4. I posted recently on SSTs Ocean Remains Cooler November 2024. These posts have a separate graph of land air temps because the comparisons and contrasts are interesting as we contemplate possible cooling in coming months and years.
Sometimes air temps over land diverge from ocean air changes. In July 2024 all oceans were unchanged except for Tropical warming, while all land regions rose slightly. In August we saw a warming leap in SH land, slight Land cooling elsewhere, a dip in Tropical Ocean temp and slightly elsewhere. September showed a dramatic drop in SH land, overcome by a greater NH land increase. In October, ocean and land temps in both NH and Tropics dropped, pulling the global anomaly down. Now in November and December there was cooling everywhere, except only SH and Tropics land temps.
Note: UAH has shifted their baseline from 1981-2010 to 1991-2020 beginning with January 2021. v6.1 data was recalibrated also starting with 2021. In the charts below, the trends and fluctuations remain the same, but the anomaly values changed with the baseline reference shift.
Presently sea surface temperatures (SST) are the best available indicator of heat content gained or lost from earth’s climate system. Enthalpy is the thermodynamic term for total heat content in a system, and humidity differences in air parcels affect enthalpy. Measuring water temperature directly avoids distorted impressions from air measurements. In addition, ocean covers 71% of the planet surface and thus dominates surface temperature estimates. Eventually we will likely have reliable means of recording water temperatures at depth.
Recently, Dr. Ole Humlum reported from his research that air temperatures lag 2-3 months behind changes in SST. Thus cooling oceans portend cooling land air temperatures to follow. He also observed that changes in CO2 atmospheric concentrations lag behind SST by 11-12 months. This latter point is addressed in a previous post Who to Blame for Rising CO2?
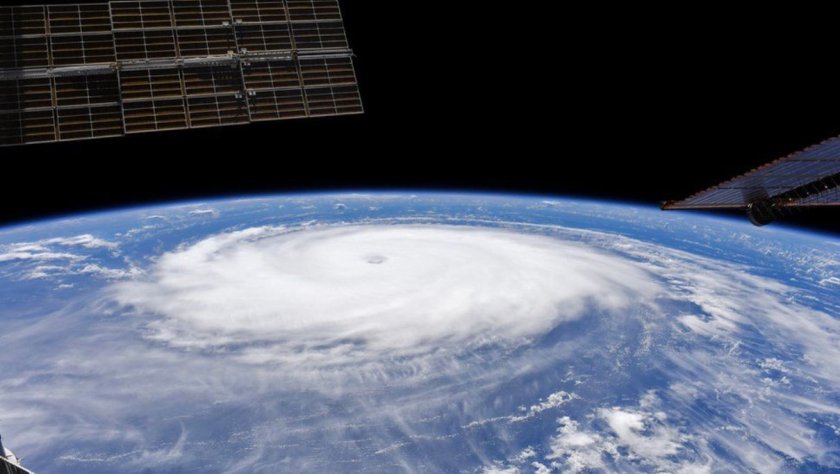
After a change in priorities, updates are now exclusive to HadSST4. For comparison we can also look at lower troposphere temperatures (TLT) from UAHv6.1 which are now posted for December. The temperature record is derived from microwave sounding units (MSU) on board satellites like the one pictured above. Recently there was a change in UAH processing of satellite drift corrections, including dropping one platform which can no longer be corrected. The graphs below are taken from the revised and current dataset.
The UAH dataset includes temperature results for air above the oceans and thus should be most comparable to the SSTs. There is the additional feature that ocean air temps avoid Urban Heat Islands (UHI). The graph below shows monthly anomalies for ocean air temps since January 2015.
In 2021-22, SH and NH showed spikes up and down while the Tropics cooled dramatically, with some ups and downs, but hitting a new low in January 2023. At that point all regions were more or less in negative territory.
After sharp cooling everywhere in January 2023, there was a remarkable spiking of Tropical ocean temps from -0.5C up to + 1.2C in January 2024. The rise was matched by other regions in 2024, such that the Global anomaly peaked at 0.95C in May, Since then the Tropics and the Global anomaly have cooled down to 0.5C, as well as SH dropping down to 0.4C in December.
Land Air Temperatures Tracking in Seesaw Pattern
We sometimes overlook that in climate temperature records, while the oceans are measured directly with SSTs, land temps are measured only indirectly. The land temperature records at surface stations sample air temps at 2 meters above ground. UAH gives tlt anomalies for air over land separately from ocean air temps. The graph updated for December is below.
Here we have fresh evidence of the greater volatility of the Land temperatures, along with extraordinary departures by SH land. The seesaw pattern in Land temps is similar to ocean temps 2021-22, except that SH is the outlier, hitting bottom in January 2023. Then exceptionally SH goes from -0.6C up to 1.4C in September 2023 and 1.8C in August 2024, with a large drop in between. In November, SH and the Tropics pulled the Global Land anomaly further down despite a bump in NH land temps. December showed an upward rebound in SH and Tropics land temps, offset by a NH drop, leaving the Global land anomaly little changed.
The Bigger Picture UAH Global Since 1980
The chart shows monthly Global Land and Ocean anomalies starting 01/1980 to present. The average monthly anomaly is -0.03, for this period of more than four decades. The graph shows the 1998 El Nino after which the mean resumed, and again after the smaller 2010 event. The 2016 El Nino matched 1998 peak and in addition NH after effects lasted longer, followed by the NH warming 2019-20. An upward bump in 2021 was reversed with temps having returned close to the mean as of 2/2022. March and April brought warmer Global temps, later reversed
With the sharp drops in Nov., Dec. and January 2023 temps, there was no increase over 1980. Then in 2023 the buildup to the October/November peak exceeded the sharp April peak of the El Nino 1998 event. It also surpassed the February peak in 2016. In 2024 March and April took the Global anomaly to a new peak of 0.94C. The cool down started with May dropping to 0.9C, and in June a further decline to 0.8C. October went down to 0.7C, November and December dropped to 0.6C.
The graph reminds of another chart showing the abrupt ejection of humid air from Hunga Tonga eruption.
TLTs include mixing above the oceans and probably some influence from nearby more volatile land temps. Clearly NH and Global land temps have been dropping in a seesaw pattern, nearly 1C lower than the 2016 peak. Since the ocean has 1000 times the heat capacity as the atmosphere, that cooling is a significant driving force. TLT measures started the recent cooling later than SSTs from HadSST4, but are now showing the same pattern. Despite the three El Ninos, their warming had not persisted prior to 2023, and without them it would probably have cooled since 1995. Of course, the future has not yet been written.
This is a new entry to a series-of-many which have discussed ongoing scientific controversies, a specific type of which are often referred to in the science press and elsewhere as “Wars” – for instance The Monarch Wars, The Meat Wars, The Obesity Epidemic, The Salt Wars, The War in Sugar and the Great Barrier Reef Wars.
The War on Food could stand as an exemplar for all of the controversies – and, in fact, it over laps with three of the previously covered Wars: The War on Sugar, The Meat War and The Obesity Epidemic.
Note: This piece is just a short introduction into the multi-part series on Ultra-processed Foods, UPFs. There will be several more similarly short essays in this series.
# # # # #
The nutrition and food news today, including radio, TV, blogs, is full of stories decrying the consumption of Ultra-Processed Foods – UPFs. Normally I would give a series of links to the latest headlines, but I doubt anyone could have missed them – they have been ubiquitous. Here is one typical piece, asking the main question: Ultraprocessed Foods: Are They Bad for You?
The YaleMedicine article refers to a number of recent review papers in major journals and uncritically quotes or paraphrases their conclusions in statements such as: “A review, published in the British Medical Journal (BMJ) in 2024, looked at 45 studies involving almost 10 million participants. The review authors suggest that eating more ultraprocessed foods is linked to a higher risk of dying from any cause and has ties to 32 health conditions, including heart disease, mental health disorders, type 2 diabetes, and other problems”.
The “review” mentioned is Lane et al. 2024 [ pdf here ], which comes with a link to the BMJ Editorial “Reasons to avoid ultra-processed foods”. The editorial includes this statement:
“The quality of the evidence was strong for all cause mortality, obesity, and type 2 diabetes (this evidence was rated as of moderate quality using the GRADE system, which initially considers all observational studies as low-quality evidence). Overall, the authors found that diets high in ultra-processed food may be harmful to most—perhaps all—body systems.”
The authors of the study report their findings like this:
As an introduction to this whole topic, let’s just examine the actual evidence found in Lane et al. 2024 and compare it to the characterization from the BMJ and the authors’ conclusion. I supply the figures from the paper, annotated, along with two explanatory graphics on evidence strength.
Let me attempt a more pragmatic, unbiased interpretation of those two tables of findings:
Every item highlighted in Yellow indicates reasons to doubt the validity of the finding, for the following reasons:
1. Odds ratios (ORs) of a magnitude of 1.02 to 1.07 are vanishingly small and are doubtfully of any significant, real world importance – and certainly are not Minimal Clinically Important Differences.
2. In all charts, any highlighted finding with Confidence Interval whiskers that include “1”, there is no significant difference – or, in plain English, “nothing done” and the effect cannot be considered either positive or negative. These individual finding should not be included in any overall result of the study and not combined with other findings for an “overall score”.
3. Studies with a GRADE rating [“a method used to assess the quality of evidence in research studies”] of Low or Very Low do not return “strong evidence”, they produce low or very low quality evidence.
4. Findings of Studies with a Credibility Score of III, IV and V are not actually evidence. They are restatements of summaries [and as we shall see are often inaccurate summaries] about the evidence found in other systematic reviews and are prone to be what John P.A. Ioannidis describes as “simply accurate measures of the prevailing bias.”
5. All-Cause Mortality is neither caused nor prevented exclusively by diet. An Odds Ratio as low as 1.02 (1.01 to 1.03) is not likely to be a significant result considering the multitude of possible confounders.
There is one interesting finding in Lane 2024 that warrants a closer look: the mental health finding. The ORs are high enough to be something but the GRADE rating of the studies used are low. I would want to dig in there and see which way the Arrow of Causation is pointing – do mental/emotional problems cause increased eating of UPFs or does the eating of more UPFs cause the mental/emotional health issues. Observational studies such as these cannot answer that question, they only find an association.
We will see this same pattern repeated through all the major systematic reviews of the UPF issue: Tiny ORs/HRs, ORs/HRs with CIs that include ‘1’, studies included in reviews even though they are of Low and Very Low quality, low Credibility Scores due to type of study, studies that measure a vague, not agreed upon, shifting and ill-defined range of foods – labeled UPFs – and results claimed for a broad heterogeneous range of foods.
The next essay in this series will cover: The Shifting and Indefinite Definition of UPFs.
# # # # #
Author’s Comment:
I am trying a new thing by keeping the essays in this series short enough to be read by the average reader with limited time. The result will be several shorter essays, around 1000 words, with a reading time of 4 or 5 minutes. Let me know in comments (start with “Kip – “) if this is better or not. The upside is that more readers can actually read the entire piece if they are interested. The downside is that the shorter essays will cover a limited part of the whole topic – leaving lots of questions that will have to be (hopefully) answered in subsequent essays.
Lane et al. 2024 does have some findings that may be interesting to researchers. But is uses language in the conclusion referring to “the strongest available evidence” for evidence from studies that are acknowledged to be of Low and Very Low quality. Such evidence is Not Strong (or Strongest) – it may be the “strongest” of a lot of weak evidence, but it should be so stated. Lots of weak evidence just does not add up to strong evidence.
These large observational studies can raise interesting questions but cannot and do not supply any definitive answers.
Next in this series will try to answer the question: What is Ultraprocessed Food, exactly?
In a post a couple of weeks ago on December 21, I observed that the country of Germany appeared to have won the race among all countries and states to be the first to hit the “Green Energy Wall.” Its pursuit of the “renewable” wind and solar electricity fantasy has put it in a spot where regular wind/sun droughts cause huge electricity price spikes, and major industries have become uncompetitive. It has no solution to its dead end and can go no farther.
In a post a couple of weeks ago on December 21, I observed that the country of Germany appeared to have won the race among all countries and states to be the first to hit the “Green Energy Wall.” Its pursuit of the “renewable” wind and solar electricity fantasy has put it in a spot where regular wind/sun droughts cause huge electricity price spikes, and major industries have become uncompetitive. It has no solution to its dead end and can go no farther.
If Germany has “hit the wall,” what is the appropriate analogy for New York? New York passed its Climate Act with great fanfare in 2019. The Act orders that we are to have a “net zero” energy system by 2050, with interim deadlines along the way. The first serious deadline arrives in 2030, where the official mandate is 70% of electricity generation from “renewables” (aka “70 x 30”). That deadline is now just five years away. Within the past year, all the efforts to move toward the 70 x 30 goal are falling apart, as anybody who had given the subject any critical thought knew that they inevitably would. But nobody in authority has yet been willing to acknowledge that this has turned into a farce.
Here’s my analogy: New York is like the cartoon character Wile E. Coyote, who has run off the cliff and is now suspended in mid-air, apparently not knowing what will happen next.
We know what’s next: shortly, he will crash to earth.
Consider a few data points:
Off-shore wind procurement
The Scoping Plan developed under the Climate Act calls for some 9000 MW of offshore wind by 2035. People with elementary-school-level arithmetic skills knew that this amount of intermittent generation would not be nearly enough to replace the amounts of dispatchable generation set to close; but maybe this would at least be a serious start. By early 2023, it was reported that some 4300 MW out of the 9000 MW were in “active development,” with wholesale prices having been agreed to with developers in the range of $100/MWh.
But then reality started to hit. In this post on October 15, 2023, I reported that “essentially all” of the developers of the 4300 MW of offshore wind in “active development” had backed out and demanded price increases in the range of 30 – 50% to proceed. New York rejected that maneuver but ultimately had no option other than to re-bid the contracts and get bids in the range that the developers were demanding.
On February 29, 2024, the State announced that it had accepted re-bids for two of the projects in question, for a total of only about 1700 MW and at a price of over $150 per MWh. (This level of price would require retail electricity prices in the range of at least $0.40 per kWh and would be completely uneconomic if it were to become the norm for New York electricity production.).
Meanwhile, the remainder of the offshore wind procurement appears to be in complete disarray. On April 19, E&E News reported that New York had canceled efforts on three of its big offshore wind development areas, Attentive Energy, Community Offshore Wind, and Excelsior Wind. These three, had they proceeded, would have totaled about 4000 MW out of the 9000 MW 2035 goal. Excerpt:
New York canceled power contracts for three offshore wind projects Friday, citing a turbine maker’s plans to scrap its biggest machines. The news is a heavy blow to the U.S. offshore wind industry and a major setback for the climate ambitions of New York — and President Joe Biden. The three projects would have delivered 4 gigawatts of offshore wind to the state, amounting to almost half of New York’s 2035 goal.
At this point nobody has any idea how to get large amounts of offshore wind developed around New York at a price anybody is willing to pay. And of course, nobody has a solution to the intermittency problem either.
Green hydrogen
The New York regulators have recognized that a de-carbonized and predominantly wind/solar electricity generation system will require something called the “dispatchable emissions-free resource,” or DEFR, to make it work. The best idea that anybody has for the DEFR is so-called “green” hydrogen, that is, hydrogen produced by some non-emitting system, like wind, solar, or hydro.
Currently, only negligible amounts of green hydrogen are produced in the world, and none in New York. But somehow, New York got the idea that it could make this work. Two green hydrogen facilities have been granted state subsidies and are supposedly under way. One is being developed by a company called Plug Power and is at an industrial park called STAMP west of Rochester; and the other is being developed by Air Products at Massena, on the St. Lawrence River. Both of these facitilities are almost comically small relative to the amounts of hydrogen that would be needed to fully back up New York’s electricity generation in a world of mostly wind and solar generation. But at least they would be something.
Chris Suozzi, VP for business and workforce development at the Genesee County Economic Development Center, reportedly told a Washington, D.C.-based commercial real estate firm that Plug Power’s STAMP project is on hold. . .. “They’re not ready to go,” Suozzi reportedly said. “They’re on pause. We don’t know what’s going to happen with them at this point.”
The pausing or cancellation of a green hydrogen project should surprise no one. The past year has seen major cancellations of much larger such projects by big players like Australia’s Fortescue and Origin. The fact is that the cost of producing green hydrogen is a large multiple of the cost of getting natural gas out of the ground for the same energy content, besides which natural gas is a much superior fuel in every way (higher energy density, easier to handle, less corrosive, less subject to leaks, far less dangerous and explosive, etc.). Meanwhile, the developer of the STAMP green hydrogen project, Plug Power, reported as its results for the third quarter of 2024 a loss of $211 million on revenues of $174 million. They are hoping for a loan from the federal Department of Energy to keep themselves going. I wonder what Chris Wright is going to think about that.
The Air Products facility in Massena plans to use hydro power from a dam on the St. Lawrence to produce its hydrogen. Excuse me? The hydro power is already dispatchable. How can it possibly make any sense to use dispatchable electricity to produce hydrogen whose purpose is to make dispatchable electricity? At least about 40% of the energy is going to get lost on the round trip from electricity to hydrogen and back to electricity. It simply has to be that there is a better use for the St. Lawrence River hydro power than turning it into hydrogen and then using the hydrogen. But nothing here makes any sense.
Clean Path Transmission Line
Another key facility to make renewable energy work for New York was supposed to be the Clean Path transmission line. This is a proposed 175-mile high-capacity (4 GW) transmission line to bring to New York City and the downstate region power generated at various new “renewable” (wind and solar) facilities being developed in the northern and western parts of the state. The stated cost of this major project was to be $11 billion.
I don’t find any discussion about the reasons for the cancellation, but it has to be that the developers figured out the the economics did not work. Here’s the problem: because wind and solar generators only work about 20-40% of the time, this enormously expensive transmission line would not be operated at anywhere near its capacity. Likely, it would only average about one-third of capacity. That means, compared to a line that operates at or near 100% of capacity, its charges for transmission would be about triple.
The cancellation of this line has only occurred within the past month, and I haven’t seen anything about plans for a re-bid or an alternative strategy. So far, nobody is saying “this can’t possibly work.” But no matter how you approach the problem, the cost of transmitting intermittent wind and solar power from far upstate to New York City is going to be around triple the cost of transmitting power from a natural gas plant that runs nearly all the time.
So here we are, suspended up in the air, and nobody seems to realize that we will shortly crash to earth. Everybody involved is trying to milk the last dollars out of the taxpayers before the crash hits.







You must be logged in to post a comment.