Global warming, climate change, all these things are just a dream come true for politicians. I deal with evidence and not with frightening computer models because the seeker after truth does not put his faith in any consensus. The road to the truth is long and hard, but this is the road we must follow. People who describe the unprecedented comfort and ease of modern life as a climate disaster, in my opinion have no idea what a real problem is.
Global Northern Hemisphere data from Colorado State University for the year 2024 hurricane season shows that the Accumulated Cyclone Energy (ACE) for this latest season of 455.1 is only 78.6% of “normal” (lower than the 30-year 1991-2020 Climatology hurricane storm season average of 579.2 as presented in the graph below with data through December 31, 2024) and less than the year 2023 value of 636.6
Global Northern Hemisphere data from Colorado State University for the year 2024 hurricane season shows that the Accumulated Cyclone Energy (ACE) for this latest season of 455.1 is only 78.6% of “normal” (lower than the 30-year 1991-2020 Climatology hurricane storm season average of 579.2 as presented in the graph below with data through December 31, 2024) and less than the year 2023 value of 636.6 (as presented in the table below).
The highest ACE value measured for the Northern Hemisphere oceans over the 1991 to 2020 Climatology period was 880.3 in 1992 (as presented in the table below) nearly double the 2024 ACE measured outcome.
These outcomes clearly dispute and invalidate decades long flawed and contrived climate alarmists claims that these global storms are growing stronger and more intense because of man-made climate change.
Additionally, this latest year end data (presented below) shows that measured ACE values as well as data for numbers of both Major Hurricane and Hurricane outcomes (as presented in the table and 3 graphs below with these graphs displaying the period 1991 through 2023) have no consistently rising trends over the 30-year climatology period between 1990 to 2020.
Furthermore, the table shows year 2024 values for these measures are significantly lower than prior highest year measurements occurring (455.1 ACE in 2024 versus 880.3 in 1992, 17 in 2024 versus 31 in 2015 for number of major hurricanes and 32 in 2024 versus 44 in 1992 for number of hurricanes) during this climatology period. Also, the 17 major hurricane occurrences in 2024 were exceeded in 18 other years during the Climatology periodand the 32 hurricanes occurrences in 2024 were exceeded in 19 other years during this 1990 to 2020 period as well.
The perspectives noted above regarding the Global Northern Hemisphere Climatology outcomes for ACE, Major Hurricanes and Hurricanes are also reflected in the climatological data for the Northeast Pacific Ocean Region, Northwest Pacific Ocean Region and North Indian Ocean Region.
The two North Pacific Ocean regions have nearly twice the ocean surface area (31.9 million square miles) compared to the North Atlantic Ocean (16 million square miles). Including the North Indian Ocean Region with the two Pacific Regions results in an ocean area accounting for about 70% of the Global Northern Hemisphere hurricane ocean surface area represented in the Colorado State University Northern Hemisphere Tropical Cyclone statistical data analysis.
Provided below are the Climatology data for each of these three regions (Pacific Northeast Ocean, Pacific Northwest Ocean and North Indian Ocean) with the year 2024 ACE outcomes shown to be far below the “normal” value at only 61.8%, 68.1% and 30.9% respectively of the 1991 to 2020 Climatology average values.
These results make a complete mockery of the climate alarmist purely politically contrived claims that man-made climate change is driving increasing hurricane strength and intensity around the world.
Provided below are Colorado State University Tables for the Pacific Northeast Region, Pacific Northwest Region and North Indian Region (respectively) for the 1991 to 2020 Climatology period that include data on ACE, Major Hurricane and Hurricane yearly outcomes during this period for each region.
The data for the Pacific Northeast Region show that the year 2024 values for ACE, Major Hurricanes and Hurricanes are significantly lower than prior highest year measurements occurring (82 ACE in 2024 vs 294.3 in 1992, 3 in 2024 vs 11 in 2015 for major hurricanes and 5 in 2024 vs 16 in 2015, 2014 and 1992 for hurricanes) during this climatology period.
The data for the Pacific Northwest Region show that the year 2024 values for ACE, Major Hurricanes and Hurricanes are significantly lower than prior highest year measurements occurring (204 ACE in 2024 vs 570.4 in 1997, 9 in 2024 vs 16 in 2015 for major hurricanes and 15 in 2024 vs 23 in 1997 for hurricanes) during this climatology period.
The data for the North Indian Ocean Region show that the year 2024 values for ACE, Major Hurricanes and Hurricanes are significantly lower than prior highest year measurements occurring (7.5 ACE in 2024 vs 93 in 2019, 0 in 2024 vs 5 in 2019 for major hurricanes and 1 in 2024 vs 6 in 2019 for hurricanes) during this climatology period.
Without further belaboring the point, the values of ACE, major hurricanes and hurricanes occurring in each of these 3 global regions in 2024 is exceeded numerous additional times during the chronological period as was addressed in the data presented above for the entire Northern Hemisphere Region.
The data for the year 2024 North Atlantic region ACE is provided below showing that this year’s value of 161.6 exceeded the 1991 to 2020 Climatology value average of 122.5 which is 31.8% above “normal”.
The highest ACE values during the Climatology period for the North Atlantic Region (presented in the data table below) are 227.1, 226.9, 245.3 and 224.9 occurring in years 1995, 2004, 2005 and 2007 respectively.
The 2024 ACE value is exceeded by 10 other years during the Climatology period.
The 5 major hurricanes occurring in 2024 are matched or exceeded by 10 other years with the maximum being 7 major hurricanes in 2005 during the Climatology period. The 11 hurricanes occurring in 2024 are matched or exceeded by 4 other years during the Climatology period with highest value being 15 in 2005.
The year 2024 Climatology data compiled by Colorado State University for the North Atlantic Region, as shown above, establishes that there were no record high measured outcomes for ACE, Major Hurricanes, Major Hurricane Days, Hurricanes, Hurricane Days, Named Storms or Named Storms Days in that year.
This outcome occurred despite the record high hurricane hype provided by the clueless and incompetent climate alarmist election year Democrat politicians and media.
We are all aware of the continuing increase in China’s emissions of carbon dioxide, which are now 22% higher than in 2016.
Thick clouds emanate from a coal-burning power plant in Baishan, in the Jilin province of China. In an effort to boost its economy, China has recently started greenlighting coal projects that had been on hold.
There is no theoretical basis for the Net Zero policy based on the man-made climate change narrative of the IPCC. It comes from the lack in knowledge of the atmospheric window of the energy budget of the earth by modelers.
Fig.1 below is an energy budget of the earth having an atmospheric window.
In this case, OLR (Outgoing Longwave Radiation) is expressed as follows.:OLR= Fw (function of Ts, 17%) + Fu (function of Tu, 83%)
Ts – surface temperature,
Tu – upper troposphere temperature
Therefore, Tu increases as much as ~1C to restore the decreased OLR as much as 4(W/m2) at the tropopause with a CO2 doubling.
Fig.1. Energy budget of the earth (adapted from Fig.4.1 in Dorland, R.V., de Jager, dr. C., Versteegh, G.J.M., 2006. KNMI Report 50010200, 99-101)
In contrast, climate models were developed by Manabe, Hansen, Cess and Schlesinger using the energy budget of the earth by Fig. 2 having no atmospheric window.
Fig.2. Energy budget of the Earth by Ramanathan (1987)
Therefore 40 climate models participated in CMIP6 have no atmospheric window as shown by Fig. 3. In this case, surface temperature Ts increases as much as ~1C to restore the decreased OLR as much as 4(W/m2) at the tropopause with CO2 doubling.
Fig. 3 All sky was adapted in the following reference: Martin Wild, Climate Dynamics (2020) 55:553-577.
Conclusion
There is no theoretical basis for the Net Zero policy based on the man-made climate change narrative of the IPCC. It comes from the lack in knowledge of the atmospheric window of the energy budget of the earth by modelers.
Theoretically speaking, OLR is treated as one variable function as OLR= function (Ts) in climate models while in reality it is two variable function as OLR= function (Ts, Tu).
It does not need me to tell you that it was quite wet last year. It was in fact ninth wettest in England & Wales since 1766, though nowhere near the two wettest years in 1872 and 1768.
It does not need me to tell you that it was quite wet last year. It was in fact ninth wettest in England & Wales since 1766, though nowhere near the two wettest years in 1872 and 1768.
For the last decade or so, we have been going through the same sort of weather as in the 1870s and 80s, as well as the 1920s.
But averages and trends are not particularly meaningful – nature does not do averages and straight lines! You could have ten years all with the same rainfall, or you could have five years with high rainfall and five years of drought, and you could get the same average.
If you just look at the distribution of wet years, there is no obvious pattern:
But the chart of driest years strongly suggests that these are both much less frequent and severe now. The most recent inclusion in the list is 2011:
It would be accurate to say that England & Wales are not getting wetter, but are not as dry as they often used to be.
Despite the year as a whole being wetter than average, no month was particularly so, with none appearing in the list of >170mm:
The wettest day was Feb 8th, with 21.89mm. Most years see this sort of level or more.
The data shows that rainfall is not getting more extreme in England & Wales.
“The solar excess contributes to electricity rates in California that are the highest in the continental United States. Only Hawaii has higher electricity rates, a function of its isolation and need to import fuels for power generation.”
“The solar excess contributes to electricity rates in California that are the highest in the continental United States. Only Hawaii has higher electricity rates, a function of its isolation and need to import fuels for power generation.”
Has California’s enthusiasm for solar power gone too far? That question is being asked as the state is curtailing large amounts of solar generation and paying other states to take the Golden State’s solar excess.
The Los Angeles Times (November 24, 2024) reported:
In the last 12 months, California’s solar farms have curtailed production of more than 3 million megawatt hours of solar energy, either on the orders of the state’s grid operator or because prices had plummeted because of the glut, according to an analysis of data by The Times.
Data from the state’s grid operator, the California Independent System Operator (CAISO), shows that curtailments of solar generation, because the conventional market for power in the state was less than was being generated and electric storage capacity was full, have doubled compared to 2021.
In addition, the newspaper reported, electric supply is so much greater than demand in some periods that power prices have gone negative. Gary Ackerman, the former executive director of the Western Power Trading Forum, said solar generators are paying brokers to take the power. The brokers, in turn, are selling it out of state, and reaping a substantial profit. “This is all being underwritten by California ratepayers,” Ackerman said.
The CAISO warned of the issue of solar curtailments in 2017, writing, “As more renewables come onto the system, oversupply during the middle of the day, when the sun is brightest, is happening more frequently, and curtailing of solar resources is becoming a common practice.”
The system operator noted, “Curtailments can occur in three ways: economic curtailment, when the market finds a home for low-priced or negative-priced energy; self-scheduled cuts, which reduce generation from self-scheduled bids; and exceptional dispatch, when the ISO orders generators to turn down output.”
In 2017, New York Times Los Angeles correspondent Ivan Penn reported in the LA Times, “On 14 days during March, Arizona utilities got a gift from California: free solar power.
Well, actually better than free. California produced so much solar power on those days that it paid Arizona to take excess electricity its residents weren’t using to avoid overloading its own power lines. It happened on eight days in January and nine in February as well. All told, those transactions helped save Arizona electricity customers millions of dollars this year, though grid operators declined to say exactly how much. And California also has paid other states to take power.
The problem has grown substantially since 2017. Last month’s LA Times article reported, “Arizona’s largest public utility reaped $69 million in savings last year by buying from the market California created to get rid of its excess solar power. The utility returned that money to its customers as a credit on their bills.”
Analysis a year ago by the University of California, Berkeley’s Ecoblock program concluded:
From 2017 to 2022, we have seen a 546% increase in solar and wind curtailment with only a 41% increase in wholesale solar and wind energy generation. This is an alarming growth rate. If we only supply one-third of our energy needs with renewable energy, how much curtailment will we see as we get closer to 100% renewable energy? Can we even get to 100% renewable energy with this growth rate of curtailment?
The graphic illustration of California’s solar problem is seen in the famous “duck curve” that first appeared in 2013 and has grown over the years.
Source: EIA
The Rate Problem
The solar excess contributes to electricity rates in California that are the highest in the continental United States. Only Hawaii has higher electricity rates, a function of its isolation and need to import fuels for power generation. California electricity rates are about double the national average.
According to Public Advocates Office at the California Public Utilities Commission, the average electric rate ($/kWh) at the state’s two largest investor-owned electric companies, Pacific Gas & Electric and Southern California Edison, have increased 51% in the last three years. Smaller San Diego Gas and Electric, has seen a 20% rate increase (but are the highest, at $0.383, versus $0.367 for PG&E, and $0.332 for Edison).
Nevertheless, California solar generation continues to expand. Dimension Energy, a California-based independent community solar energy developer, recently completed construction of a 44-MW solar project in Southern California Edison’s service territory, Inyokern in Kern County. According to POWER magazine, it is the “largest third-party-owned community solar project in the U.S.”
——–
A key to dealing with the temporal vagaries of renewable energy is electricity storage. California utilities have invested heavily in battery electric storage systems, primarily the same lithium-ion technology used in electric vehicles.
Li-ion technology has its own share of limitations. The batteries are expensive, scalability is tricky, and there are safety issues, demonstrated by Li-ion battery fires such as the June conflagration in San Diego. There are promising thermal storage technologies but they have yet to gain much traction.
It’s “green” business-as-usual in California. But it is sustainable?
According to UN Special Rapporteur on climate change Elisa Morgera, “Some states are not acting in good faith” on climate change.
World’s climate fight needs fundamental reform, UN expert says: ‘Some states are not acting in good faith’
Special rapporteur Elisa Morgera criticizes ‘ineffective’ status quo and says focus must be on ‘deep, systemic inequalities’
Nina Lakhani, climate justice reporterTue 7 Jan 2025 22.00 AEDT
Special rapporteur Elisa Morgera criticizes ‘ineffective’ status quo and says focus must be on ‘deep, systemic inequalities’
The international effort to avert climate catastrophe has become mired by misinformation and bad faith actors, and must be fundamentally reformed, according to a leading UN climate expert.
…
“The current climate regime was built in a way, maybe unconsciously, that locked in an ineffective approach that is blind to the disproportionate harms of climate change – and increasingly climate solutions – and the disproportionate benefits that the current situation is accruing to very few states and very few individuals,” said Morgera, in an exclusive interview with the Guardian.
“We can observe that some states are not acting in good faith in very clear ways, which is the basis of any international regime. There is widespread disregard for the rule of international law, and also a very clear pushback on the science, and shrinking of civil spaces at all levels. Basically, the truth is out of the conversation. That is the problem – there is no space at Cop for the truth,” said Morgera.
“Fundamental reform is possible, if there is a willingness by the states and the secretariat, but it’s hard to see that at the moment.”
…
She said: “The dominating assumption in the current process assumes that mass behavioral change is the solution, that this is as much a consumer issue as a production issue – which is a misrepresentation of the causes and the solutions. We’re still not looking at deep, systemic inequalities as the root causes, while also entrenching inequities and worsening negative human rights impacts of climate change – and climate solutions.”
I think Elisa probably wants to help, but she’s going to have to practice her communication skills to get any traction.
When I first tried to read this article last night, very little of what Elisa said made sense. So I decided to try to clarify that last paragraph “The dominating assumption…” by translating it into Welsh :-
Mae’r dybiaeth amlycaf yn y broses bresennol yn rhagdybio mai newid ymddygiad torfol yw’r ateb, bod hwn yn gymaint o broblem defnyddwyr â mater cynhyrchu – sef camliwio’r achosion a’r atebion. Nid ydym yn dal i edrych ar anghydraddoldebau systemig dwfn fel yr achosion sylfaenol, tra hefyd yn ymwreiddio anghydraddoldebau ac yn gwaethygu effeithiau negyddol newid hinsawdd ar hawliau dynol – ac atebion hinsawdd.
Then I translated it back to English :-
The most obvious assumption in the current process assumes that mass behavior change is the answer, that this is as much a consumer problem as a production issue – which is to misrepresent the causes and the solutions. We are still not looking at deep systemic inequalities as the root causes, while also entrenching inequalities and exacerbating the negative impacts of climate change on human rights – and climate solutions.
The double translated paragraph is definitely more readable – now we know the correct translation for the UN Gobbledegook word “dominating” is “most obvious”.
If you are wondering why I tried Welsh, I’m not picking on the Welsh. I lived in Wales once, fond memories – people were kind to the Aussie. I tried a few other languages but Welsh worked the best. Welsh is clearly a language which goes straight to the heart of the matter being discussed.
The whole article is worth a read, a bit like doing a cryptic crossword puzzle – though I recommend tackling it after a good sleep and a strong coffee. Remember, if any of the academic UN word salad gets too challenging, you can always try translating it into Welsh.
The idea of corporate social responsibility is not new. For years, there has been a push for companies to act in a more socially responsible manner, specifically as it relates to environmental stewardship. While environmental stewardship is important, concerns about sustainability must be balanced carefully with consumer interests. The nation’s most populous state increasingly appears to have forgotten this important fact.
The idea of corporate social responsibility is not new. For years, there has been a push for companies to act in a more socially responsible manner, specifically as it relates to environmental stewardship. While environmental stewardship is important, concerns about sustainability must be balanced carefully with consumer interests. The nation’s most populous state increasingly appears to have forgotten this important fact.
California is suing oil and gas giant ExxonMobil for alleged “deceptive public messaging surrounding plastics recycling” and its culpability in “the plastic waste and pollution crisis.” Unfortunately, the lawsuit is extremely misguided and ignores the complicated role plastics continue to play in society. It seeks to pin blame on a single company for a global problem while absolving itself from any responsibility.
While many states have instituted laws requiring manufacturers to recycle, or otherwise safely dispose of waste products, California’s lawsuit goes a step further. It seeks to hold a company liable for something that, as a large oil and gas producer, it is only indirectly responsible for. That makes it uniquely dangerous and potentially damaging to consumer interests since plastics have diverse applications and continue to be widely used.
It goes without saying that plastic waste is a serious problem that, in many ways, embodies the economic concept known as the tragedy of the commons where individual actions can collectively lead to negative consequences. Every year, the U.S. produces millions of tons of plastic, much of which ultimately ends up in landfills, or in the worst cases, is discarded into the environment. California notes that only a small percentage of this plastic is recycled, with the Environmental Protection Agency putting the number at about 9%.
However, California has chosen to ding Exxon for promoting advanced recycling technology and endorsing the widely recognized recycling symbol on its products. The state argues these actions have misled consumers into believing that if they properly dispose of products, they will be recycled, even though most current research suggests this is not the case. But touting technological advances in recycling—even when modest—and encouraging people to recycle are good things, not bad.
The federal government has encouraged recycling for decades and spends millions annually on education campaigns such as “America Recycles Day.” For its part, California also continues to promote recycling and regularly passes new rules and regulations to make the process easier for consumers. Whether these efforts are effective is a separate question, but Exxon is far from alone in embracing recycling as a solution to plastic waste.
That makes California’s lawsuit against Exxon disingenuous. The state seems far more interested in going after the company simply because it is the world’s largest “refiner and marketer” of petrochemical products than it is concerned about solving the world’s plastic pollution problem. Perhaps that’s why the Golden State is seeking “multiple billions of dollars” in civil penalties.
The lawsuit also seems to neglect the enormous benefits that plastics have brought to ordinary people, including Californians. Despite ongoing challenges with recycling, plastics are attractive because they are extremely versatile, cheap to manufacture, and possess many unique properties that make them preferable to alternative materials that are not always as practical to use or even better for the environment.
Indeed, there is a reason that plastics are known as the “material with 1,000 uses.” Today, over 6,000 consumer products rely on petrochemicals as a primary compound. They are found in items as mundane as milk cartons and shampoo bottles to lifesaving medical devices and automobile seatbelts. One would think that a state that claims to be concerned that “plastics are everywhere” would at least attempt to understand why that is the case, and what makes the material so popular.
Unfortunately, that would require California to carefully weigh the pros and cons of plastics, something it has shown no interest in doing as it attempts to wean off oil and gas. California would do well to remember that solving global problems like plastic waste will require global efforts, efforts that are undermined each time it chooses to single out a company already committed to playing its part.
Nate Scherer is a policy analyst with the American Consumer Institute, a nonprofit education and research organization. For more information about the Institute, visit us at www.TheAmericanConsumer.Org or follow us on X @ConsumerPal
This article was originally published by RealClearEnergy and made available via RealClearWire.
The climatists have seized on this unusual warming as proof their Zero Carbon agenda is needed, without addressing how impossible it would be for CO2 warming the air to raise ocean temperatures. It is the ocean that warms the air, not the other way around.
Rough seas prevented the ship come conducting operations.
The best context for understanding decadal temperature changes comes from the world’s sea surface temperatures (SST), for several reasons:
The ocean covers 71% of the globe and drives average temperatures;
SSTs have a constant water content, (unlike air temperatures), so give a better reading of heat content variations;
Major El Ninos have been the dominant climate feature in recent years.
HadSST is generally regarded as the best of the global SST data sets, and so the temperature story here comes from that source. Previously I used HadSST3 for these reports, but Hadley Centre has made HadSST4 the priority, and v.3 will no longer be updated. HadSST4 is the same as v.3, except that the older data from ship water intake was re-estimated to be generally lower temperatures than shown in v.3. The effect is that v.4 has lower average anomalies for the baseline period 1961-1990, thereby showing higher current anomalies than v.3. This analysis concerns more recent time periods and depends on very similar differentials as those from v.3 despite higher absolute anomaly values in v.4. More on what distinguishes HadSST3 and 4 from other SST products at the end. The user guide for HadSST4 is here.
The Current Context
The chart below shows SST monthly anomalies as reported in HadSST4 starting in 2015 through December 2024. A global cooling pattern is seen clearly in the Tropics since its peak in 2016, joined by NH and SH cycling downward since 2016, followed by rising temperatures in 2023 and 2024.
Note that in 2015-2016 the Tropics and SH peaked in between two summer NH spikes. That pattern repeated in 2019-2020 with a lesser Tropics peak and SH bump, but with higher NH spikes. By end of 2020, cooler SSTs in all regions took the Global anomaly well below the mean for this period. A small warming was driven by NH summer peaks in 2021-22, but offset by cooling in SH and the tropics, By January 2023 the global anomaly was again below the mean.
Now in 2023-24 came an event resembling 2015-16 with a Tropical spike and two NH spikes alongside, all higher than 2015-16. There was also a coinciding rise in SH, and the Global anomaly was pulled up to 1.1°C last year, ~0.3° higher than the 2015 peak. Then NH started down autumn 2023, followed by Tropics and SH descending 2024 to the present. After 10 months of cooling in SH and the Tropics, the Global anomaly came back down, led by NH cooling the last 4 months from its peak in August. It’s now about 0.1C higher than the average for this period. Note that the Tropical anomaly has cooled from 1.29C in 2024/01 to 0.66C as of 2024/12.
Comment:
The climatists have seized on this unusual warming as proof their Zero Carbon agenda is needed, without addressing how impossible it would be for CO2 warming the air to raise ocean temperatures. It is the ocean that warms the air, not the other way around. Recently Steven Koonin had this to say about the phonomenon confirmed in the graph above:
El Nino is a phenomenon in the climate system that happens once every four or five years. Heat builds up in the equatorial Pacific to the west of Indonesia and so on. Then when enough of it builds up it surges across the Pacific and changes the currents and the winds. As it surges toward South America it was discovered and named in the 19th century It iswell understood at this point that the phenomenon has nothing to do with CO2.
Now people talk about changes in that phenomenon as a result of CO2 but it’s there in the climate system already and when it happens it influences weather all over the world. We feel it when it gets rainier in Southern California for example. So, for the last 3 years we have been in the opposite of an El Nino, a La Nina, part of the reason people think the West Coast has been in drought.
It has now shifted in the last months to an El Nino condition that warms the globe and is thought to contribute to this Spike we have seen. But there are other contributions as well. One of the most surprising ones is that back in January of 2022 an enormous underwater volcano went off in Tonga and it put up a lot of water vapor into the upper atmosphere. It increased the upper atmosphere of water vapor by about 10 percent, and that’s a warming effect, and it may be that is contributing to why the spike is so high.
A longer view of SSTs
Open image in new tab to enlarge.
The graph above is noisy, but the density is needed to see the seasonal patterns in the oceanic fluctuations. Previous posts focused on the rise and fall of the last El Nino starting in 2015. This post adds a longer view, encompassing the significant 1998 El Nino and since. The color schemes are retained for Global, Tropics, NH and SH anomalies. Despite the longer time frame, I have kept the monthly data (rather than yearly averages) because of interesting shifts between January and July. 1995 is a reasonable (ENSO neutral) starting point prior to the first El Nino.
The sharp Tropical rise peaking in 1998 is dominant in the record, starting Jan. ’97 to pull up SSTs uniformly before returning to the same level Jan. ’99. There were strong cool periods before and after the 1998 El Nino event. Then SSTs in all regions returned to the mean in 2001-2.
SSTS fluctuate around the mean until 2007, when another, smaller ENSO event occurs. There is cooling 2007-8, a lower peak warming in 2009-10, following by cooling in 2011-12. Again SSTs are average 2013-14.
Now a different pattern appears. The Tropics cooled sharply to Jan 11, then rise steadily for 4 years to Jan 15, at which point the most recent major El Nino takes off. But this time in contrast to ’97-’99, the Northern Hemisphere produces peaks every summer pulling up the Global average. In fact, these NH peaks appear every July starting in 2003, growing stronger to produce 3 massive highs in 2014, 15 and 16. NH July 2017 was only slightly lower, and a fifth NH peak still lower in Sept. 2018.
The highest summer NH peaks came in 2019 and 2020, only this time the Tropics and SH were offsetting rather adding to the warming. (Note: these are high anomalies on top of the highest absolute temps in the NH.) Since 2014 SH has played a moderating role, offsetting the NH warming pulses. After September 2020 temps dropped off down until February 2021. In 2021-22 there were again summer NH spikes, but in 2022 moderated first by cooling Tropics and SH SSTs, then in October to January 2023 by deeper cooling in NH and Tropics.
Then in 2023 the Tropics flipped from below to well above average, while NH produced a summer peak extending into September higher than any previous year. Despite El Nino driving the Tropics January 2024 anomaly higher than 1998 and 2016 peaks, following months cooled in all regions, and the Tropics continued cooling in April, May and June along with SH dropping. After July and August NH warming again pulled the global anomaly higher, September and October resumed cooling in all regions.
What to make of all this? The patterns suggest that in addition to El Ninos in the Pacific driving the Tropic SSTs, something else is going on in the NH. The obvious culprit is the North Atlantic, since I have seen this sort of pulsing before. After reading some papers by David Dilley, I confirmed his observation of Atlantic pulses into the Arctic every 8 to 10 years.
Contemporary AMO Observations
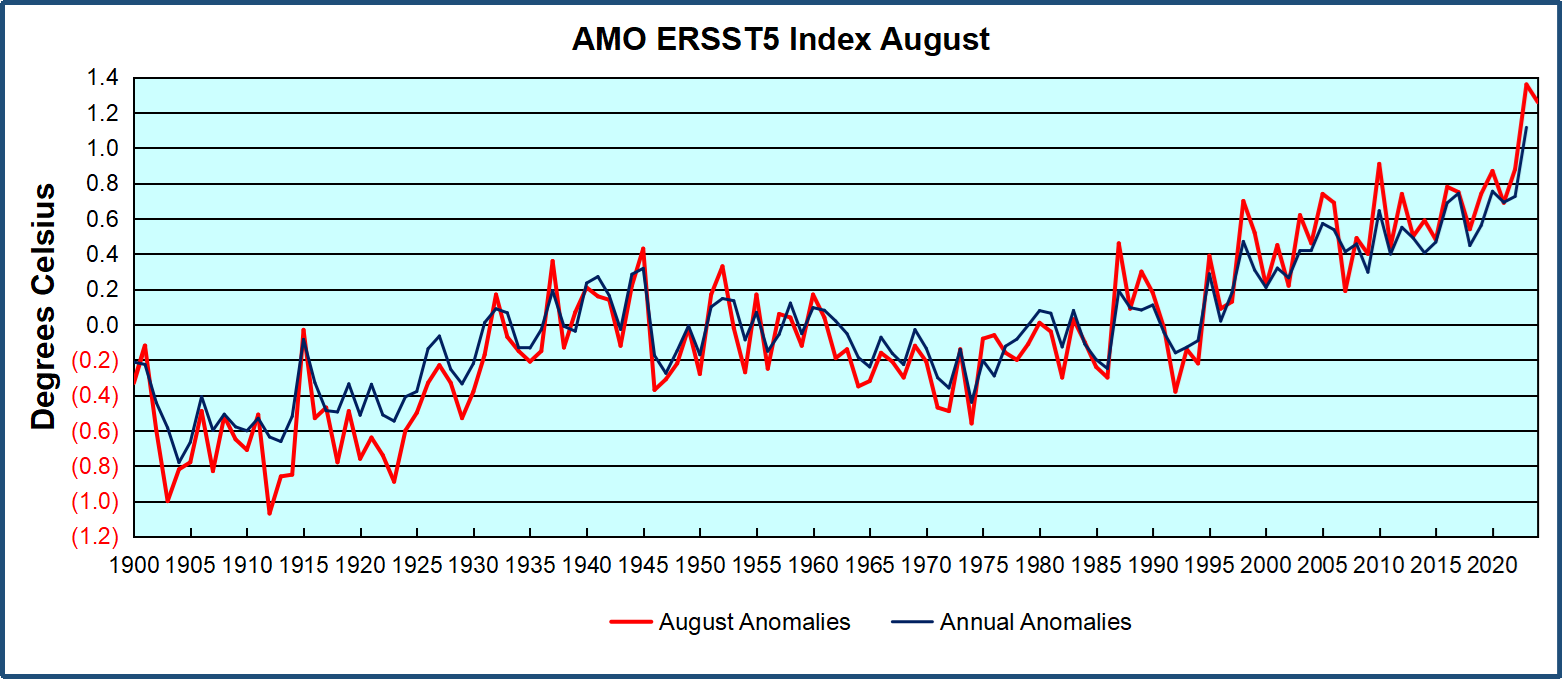
Through January 2023 I depended on the Kaplan AMO Index (not smoothed, not detrended) for N. Atlantic observations. But it is no longer being updated, and NOAA says they don’t know its future. So, I find that ERSSTv5 AMO dataset has current data. It differs from Kaplan, which reported average absolute temps measured in N. Atlantic. “ERSST5 AMO follows Trenberth and Shea (2006) proposal to use the NA region EQ-60°N, 0°-80°W and subtract the global rise of SST 60°S-60°N to obtain a measure of the internal variability, arguing that the effect of external forcing on the North Atlantic should be similar to the effect on the other oceans.” So, the values represent sst anomaly differences between the N. Atlantic and the Global Ocean.
The chart above confirms what Kaplan also showed. As August is the hottest month for the N. Atlantic, its variability, high and low, drives the annual results for this basin. Note also the peaks in 2010, lows after 2014, and a rise in 2021. Then in 2023 the peak was holding at 1.4C before declining. An annual chart below is informative:
Note the difference between blue/green years, beige/brown, and purple/red years. 2010, 2021, 2022 all peaked strongly in August or September. 1998 and 2007 were mildly warm. 2016 and 2018 were matching or cooler than the global average. 2023 started out slightly warm, then rose steadily to an extraordinary peak in July. August to October were only slightly lower, but by December cooled by ~0.4C.
Then in 2024 the AMO anomaly started higher than any previous year, then leveled off for two months declining slightly into April. Remarkably, May showed an upward leap putting this on a higher track than 2023, and rising slightly higher in June. In July, August and September 2024 the anomaly declined, and despite a small rise in October, is now lower than the peak reached in 2023.
The pattern suggests the ocean may be demonstrating a stairstep pattern like that we have also seen in HadCRUT4.
The purple line is the average anomaly 1980-1996 inclusive, value 0.18. The orange line the average 1980-2024, value 0.39, also for the period 1997-2012. The red line is 2013-2024, value 0.67. As noted above, these rising stages are driven by the combined warming in the Tropics and NH, including both Pacific and Atlantic basins.
The oceans are driving the warming this century. SSTs took a step up with the 1998 El Nino and have stayed there with help from the North Atlantic, and more recently the Pacific northern “Blob.” The ocean surfaces are releasing a lot of energy, warming the air, but eventually will have a cooling effect. The decline after 1937 was rapid by comparison, so one wonders: How long can the oceans keep this up? And is the sun adding forcing to this process?
Space weather impacts the ionosphere in this animation. Credits: NASA/GSFC/CIL/Krystofer Kim
Footnote: Why Rely on HadSST4
HadSST is distinguished from other SST products because HadCRU (Hadley Climatic Research Unit) does not engage in SST interpolation, i.e. infilling estimated anomalies into grid cells lacking sufficient sampling in a given month. From reading the documentation and from queries to Met Office, this is their procedure.
HadSST4 imports data from gridcells containing ocean, excluding land cells. From past records, they have calculated daily and monthly average readings for each grid cell for the period 1961 to 1990. Those temperatures form the baseline from which anomalies are calculated.
In a given month, each gridcell with sufficient sampling is averaged for the month and then the baseline value for that cell and that month is subtracted, resulting in the monthly anomaly for that cell. All cells with monthly anomalies are averaged to produce global, hemispheric and tropical anomalies for the month, based on the cells in those locations. For example, Tropics averages include ocean grid cells lying between latitudes 20N and 20S.
Gridcells lacking sufficient sampling that month are left out of the averaging, and the uncertainty from such missing data is estimated. IMO that is more reasonable than inventing data to infill. And it seems that the Global Drifter Array displayed in the top image is providing more uniform coverage of the oceans than in the past.
USS Pearl Harbor deploys Global Drifter Buoys in Pacific Ocean
he devastating wildfires in Los Angeles have once again become a rallying cry for those blaming climate change for natural disasters. Recent coverage, such as stories in Axios and by the BBC hastily and falsely connect these wildfires to a “rare confluence of climate factors,” a narrative that has become all too familiar. However, any such connection is unsupported by data.
The devastating wildfires in Los Angeles have once again become a rallying cry for those blaming climate change for natural disasters. Recent coverage, such as stories in Axios and by the BBC hastily and falsely connect these wildfires to a “rare confluence of climate factors,” a narrative that has become all too familiar. However, any such connection is unsupported by data. As is often the case, linking individual wildfires or even a single year’s wildfires to long-term climate change oversimplifies complex natural events, failing to address the broader context. To truly understand these fires, we must consider history, meteorology, and land management—not just the latest climate narrative.
California has a long history of wildfires, the vast majority of which occurred well before human-induced climate change became a point of discussion. Historical records and studies show that the region has always been prone to cycles of fire. For example, a study published by the U.S. Forest Service highlights the significant role of wildfires in the natural ecology of California, with fire-return intervals ranging from decades to centuries, depending on the ecosystem.
Native Americans set fires to manage vegetation and prevent catastrophic wildfires. However, these practices were abandoned after European settlement, contributing to the accumulation of fuel in forests. Today’s fires, while tragic, fit into a long history of natural and human-influenced fire activity in the region.
The cause? Santa Ana Winds, which is weather, not climate.
The current fires in Los Angeles are largely driven by the infamous Santa Ana winds, a well-documented weather phenomenon. These dry, gusty winds blow from the inland deserts toward the coast, creating the perfect conditions for rapid fire spread. The National Weather Service provides detailed explanations of the Santa Ana winds, describing how they are driven by high-pressure systems over the Great Basin. All it takes is a spark, or an arsonist. to initiate a raging wind-driven wildfire.
In this satellite video below from the Cooperative Institute for Research in the Atmosphere, note how the Santa Ana wind, coming from the Northeast, is fanning the fire, and blowing the smoke out to sea at a rapid pace.
The Axios article frames the fires as being fueled by “climate factors,” but Santa Ana winds have not changed as the planet has warmed and are a textbook example of weather, not climate. Weather describes short-term atmospheric conditions, while climate refers to long-term trends over decades or centuries. To conflate the two is to misrepresent the science.
Another critical factor in California’s wildfire problem is land management. Decades of fire suppression policies have allowed fuel – (aka dead trees, dry brush, and dense vegetation) – to accumulate, creating tinderbox conditions. A report from Cal Fire explains the role of vegetation management in reducing fire risks and outlines how fuel accumulation has made fires more intense
Meanwhile, urban expansion into wildland areas (the so-called wildland-urban interface) places more homes and infrastructure in harm’s way. Studies by the University of California, Berkeley, highlight the challenges posed by housing developments in fire-prone areas.
Historically, fires that would have naturally thinned forests and cleared underbrush were extinguished, leading to denser forests that burn more intensely. These issues receive far less attention than the simplistic claim that “climate change” is to blame.
Why does every natural disaster now seem to come with a climate change label? The media and policymakers have increasingly tied singular weather events—hurricanes, droughts, floods, and now wildfires—to global warming aka climate change. While it’s true that the climate influences weather patterns, the leap to blaming every fire or flood on climate change often skips over critical context.
The Axios article refers to “rare climate factors” but offers little in terms of specifics. Are these factors quantifiable, or are they speculative? Without rigorous data, these claims serve more as hyperbolic talking points than scientific evidence.
Blaming wildfires on climate change might make for an easy headline, but it distracts from real solutions. Improving forest management, enforcing sensible building codes, and investing in early detection and firefighting infrastructure could significantly reduce the risk and impact of wildfires. The Little Hoover Commission, an independent state oversight agency, has been vocal about the need for better forest management practices in California (source). Unblocking and stopping the removal of forest roads, for example, to allow easier access by firefighters to fires in distant wilderness areas before they become large conflagrations that reach populated areas, would be one good policy response to reduce the land, buildings, and lives lost to wildfires. Reinstituting large scale logging on overcrowded forested areas to reduce the fuel available when fires start would be another.
Policies driven by the climate change narrative often prioritize symbolic actions over practical measures. For example, California’s focus on renewable energy mandates and electric vehicles will have little or no impact on either the short- or long-term risks of wildfires. Worse, these policies can siphon resources away from critical fire prevention measures.
California’s wildfires are tragic, but they are not unprecedented. The media’s rush to attribute these fires to climate change reflects a broader trend of politicizing natural disasters, often at the expense of meaningful solutions.
It’s essential to approach the wildfire issue with a clear-eyed understanding of history, science, and policy. The fires in Los Angeles are a reminder not of climate doom, but of the importance of thoughtful land management and disaster preparedness—solutions grounded in reality, not rhetoric.
What made me laugh was their claim that the volcano caused a global temperature to drop of 1°C (1.8°F, aka “Nearly Two”). I’ve looked at lots of volcanic eruptions. There are links to my research on eruptions and temperature here. I have found that there is no consistent response in the global average surface temperature. I thought “This should be interesting”. I looked at the study to see what evidence they have.
I noticed that WUWT has a recent post about an interesting study that has identified the mystery huge volcanic eruption in 1831. Turns out that it comes from a volcano named Zavaritskii on an island in the Northwest Pacific between Japan and Russia.
What made me laugh was their claim that the volcano caused a global temperature to drop of 1°C (1.8°F, aka “Nearly Two”). I’ve looked at lots of volcanic eruptions. There are links to my research on eruptions and temperature here. I have found that there is no consistent response in the global average surface temperature. I thought “This should be interesting”. I looked at the study to see what evidence they have.
They use the Berkeley Earth land-only temperature data to verify their claim … the problem is that even using their methods, the Berkeley data doesn’t support their claim. The image and the caption in Figure 1 below are from their study.
Figure 1. ORIGINAL CAPTION: Figure S1: Time series of instrumental temperature anomalies spanning 1790–1840 CE. The period 1831–1833 CE is shaded grey. Instrumental temperature records are from Berkeley Earth [www.berkeleyearth.org, (8)] and show estimated global land average temperatures. These represent annual temperature anomalies relative to the 1790–1807 CE mean (a period without major volcanic eruptions).
Squint as I might at Figure 1, I’m not seeing the 1°C temperature drop post-1831. Not even close.
Plus, the Berkeley data is monthly, but they’re using annual averages. This is throwing away a bunch of valuable data.
So, I decided to take a proper look at the temperature record of all the major volcanic eruptions for the last two centuries. This eruption information is kept by the Smithsonian Institute in their Volcanoes of the World database. I used only the largest volcanoes, those with a Volcanic Explosivity Index of 6 or more. Here’s that record, compared to the same Berkeley Earth temperature dataset used in their study.
Figure 2. Large volcanic eruptions and the Berkeley Earth global monthly land surface temperature anomaly record.
Here’s the curious part. Of these 7 large volcanoes, there’s only one that is followed by a clear drop in temperature. That one is Pinatubo, the poster child for the claim that eruptions affect global average surface temperatures. All the rest of these big volcanoes show nothing anomalous. Even the two biggest eruptions, Tambora 1815 and Krakatau 1883, were not followed by global cooling in the Berkeley Earth record. Temperatures actually rose after each of those eruptions.
Anyhow … that’s why I laughed when they said they’d found a 1°C (1.8°F) cooling resulting from the 1831 volcano. I didn’t even have to look at the record above to know the chances were small that a large effect would be visible.
And in the event, Figure 2 shows the Zavaritskii volcano occurred halfway through a cooling period, and the cooling post-volcano and pre-volcano are indistinguishable.
I say that this lack of temperature response to eruptions is explained by my hypothesis that a variety of emergent phenomena work to thermoregulate the earth’s temperature. In particular, when temperatures fall due to say eruptions injecting aerosols into the stratosphere, the climate responds inter alia by cumulus cloud fields and thunderstorms forming later in the day. This allows more sunshine to be absorbed by the surface, which opposes the volcanic cooling.
For a different look at this question of temperature changes due to eruptions, I took a look at the UAH MSU satellite-based atmospheric records. Figure 3 shows eruptions and the temperatures at four different atmospheric levels from the top down—stratosphere, tropopause, middle troposphere, and lower troposphere.
Figure 3. UAH MSU satellite-based atmospheric temperature anomalies, in order of altitude from highest (top panel) down to lowest (bottom panel). Red lines show the dates of eruptions with a Volcanic Explosivity Index (VEI) of 5 or more. Numbers following the names show the VEI of the eruption.
Now, this shows the curious nature of the atmosphere—there is very little correlation between stratospheric temperature anomalies (top panel) and the rest of the lower atmosphere (lower three panels). There are clear indications of the 1982 and 1991 volcanoes in the stratosphere … but by the time that works its way down to the lower troposphere, the situation is quite different. There, only the Pinatubo/Cerro Hudson pair shows a temperature drop following the eruption, and even that is not visibly different from a number of other temperature drops during the period.
And by the time the effect of the eruption-injected stratospheric aerosols makes it down to the surface, we get Figure 4.
Figure 4. A closeup of the recent end of the data shown in Figure 2, with additional eruptions. Vertical red lines show VEI 5 and VEI 6 volcanic eruptions during the satellite era along with the Berkeley Earth global monthly land surface temperature record.
If the Mount St. Helens eruption caused the subsequent cooling, did the El Chichon eruption cause the subsequent warming? Once again we see the ~0.5°C temperature drop after Pinatubo, but other than that, there’s no clear indication that eruptions affect the global average surface temperature.
Yes, I know that this goes against the revealed wisdom. That wisdom says:
Eruption –> Stratospheric SO2 Aerosols –> Increased Albedo –> Less Sunlight –> More Cooling
Sounds logical, but it ignores the fact that the climate is a dynamic system that is constantly changing and adapting to a variety of forcings and factors. The revealed wisdom stops too soon. I say it goes like this:
Eruption –> Stratospheric SO2 Aerosols –> Increased Albedo –> Less Sunlight –> Cooling –> Delayed Formation Of Daily Tropical Cumulus Cloud Fields –> Decreased Albedo –> More Sunlight –> Less Cooling
plus
Eruption –> Stratospheric SO2 Aerosols –> Increased Albedo –> Less Sunlight –> Cooling –> Delayed- or Non-Emergence Of Daily Tropical Thunderstorm Formation –> Decreased Thunderstorm Cooling –> Less Cooling
Both of these emergent phenomena, the daily appearance of sunlight-reflecting tropical cumulus cloud fields and cooling thunderstorms, work to oppose the cooling action of the volcanic stratospheric aerosols, and to prevent large swings in the global surface temperature.
I provide interesting evidence for this hypothesis in my post below.




You must be logged in to post a comment.