Global warming, climate change, all these things are just a dream come true for politicians. I deal with evidence and not with frightening computer models because the seeker after truth does not put his faith in any consensus. The road to the truth is long and hard, but this is the road we must follow. People who describe the unprecedented comfort and ease of modern life as a climate disaster, in my opinion have no idea what a real problem is.
Scientists have known since the GISP2 borehole was drilled in 1993 that Central Greenland deglaciated at least once in the late Pleistocene (Bierman et al., 2024). Indeed, the Summit of the modern Greenland ice sheet was actually ice-free at some point between 250,000 and 1.1 million years ago – which is relatively recent from a geological perspective.
Today, with CO2 levels supposedly in the “dangerously high” range, Central Greenland has 3 kilometers of ice piled atop it.
Scientists have known since the GISP2 borehole was drilled in 1993 that Central Greenland deglaciated at least once in the late Pleistocene (Bierman et al., 2024). Indeed, the Summit of the modern Greenland ice sheet was actually ice-free at some point between 250,000 and 1.1 million years ago – which is relatively recent from a geological perspective.
Plants, wood, insects, fungi and other remnants suggestive of vegetation were recovered from the bottom of the boring site. This is quite a contrast to today’s 3000-meters-high ice sheet at this same location.
“The presence of poppy, spike-moss, fungal sclerotia, woody tissue, and insect parts in the GISP2 till shows that tundra vegetation once covered central Greenland, mandating that the island was largely ice-free.”
The atmospheric CO2 concentration is presumed to have ranged between 275 and 290 ppm during the Late Pleistocene, or during this same period when Greenland was ice-free. These sub-300 ppm CO2 levels are thought to be the same as they were from 1700 to 1900 (the Little Ice Age), when, as today, Central Greenland has remained buried in kilometers of ice.
The authors of this study use existing knowledge of Greenland’s climate (for example, Summit’s mean July temperature is -7°C) to calculate how much warmer Central Greenland was “when the ice was gone” during the last 1.1 million years. Controlling for lapse rate, Central Greenland’s average surface air temperatures were likely +3 to 7°C in July when it had no ice sheet.
The atmospheric CO2 concentration thus appears to be largely unrelated to either Greenland’s climate or its state of glaciation.
Science has no race — it is true, or it isn’t. But once we start deleting one race or judging one scientific hero by the color of their skin, we can still make science lessons racist. It’s just another anti-white virtue-signalling thing. Instead of teaching children how the world works, someone thinks we should teach them topics that make the Minister sound good at UN cocktail parties.
Let’s not put race politics in our science lessons
Science has no race — it is true, or it isn’t. But once we start deleting one race or judging one scientific hero by the color of their skin, we can still make science lessons racist. It’s just another anti-white virtue-signalling thing. Instead of teaching children how the world works, someone thinks we should teach them topics that make the Minister sound good at UN cocktail parties.
The UK Labour government wants to overhaul school science — if only they knew what science was. They got an “independent” review to tell them what they wanted to hear and invited the grovelling Royal Society’s of Science to sell out science to the latest Woke intellectual fashion. Shame on them.
Real science is about evidence, not the color of your skin, or the continent your last 1,000 ancestors lived on. It can’t be “de-Westernized” because it isn’t “Western” — the laws of physics work just as well in England as they do in Bangladesh. Hypersonic rockets don’t care what language you speak; penicillin kills streptococcus in the East and the West, and gravity sucks us all. Its universality is what makes science so fantastically useful, and ultimately so unifying. We are all just homo sapiens in this together, trying to comprehend the big world.
Naturally the UK Labour government want to screw that all up, as if science was just another kind of Arts degree:
Big Government, payer of almost all the science grants, asked the “science” societies to make up stuff for their PR campaign:
In response to the Department for Education’s call for evidence, top science bodies stressed the importance of teaching ‘non-Western’ contributions to science.
So they can turn science into another social studies unit:
The Royal Society of Biology, Royal Society of Chemistry, and Institute of Physics also said pupils should learn why some cultures were ‘less able to claim credit and ownership for ideas.
…the Royal Society of Biology’s own submission stated: ‘It is essential that all children feel included in the sciences by valuing their experiences and through the thoughtful use of contexts, imagery and narratives.
All children need to know what science is, they don’t need to be patronized. There’s a devastating condescension, a racist underbelly to the idea that someone with Hispanic, Malaysian, Kenyan or whatever skin can only learn science if we can teach them through neolithic folk songs or just-so-stories about imaginary ancestors. Spare them the soft racism of low expectations. How unforgivably demeaning.
All children should “feel included” in science because the laws of physics and chemistry apply to them; because they use phones, fly in planes and get x-rays.
Then, after all students learn what science is (observation, hypothesis, prediction, and testing with rigorous skepticism) then they can go to social studies classes to find out how scientific heroes changed the lives of millions, and why the discipline of science was crucial to the West, and how the search for truth became embedded in the dominant Western culture.
We don’t want more social studies in our science lessons, we want more science in our social studies…
They can learn the physics of electromagnetism in their science class and talk about the impact of Michael Faraday in their history lessons and how he had to teach himself, and how his idea of electric fields and electric motors changed the world.
Professor Faraday lecturing at the Royal Institution, 27th December, 1855
Killing off Western heroes is something communists and enemies want
Deleting the heroes of science (and the heroes of the UK) is a great way to demoralize and divide a generation. Instead of inspiring kids of all colors to grow up to be Alexander Fleming, the Labour Party want to teach children that their culture is not different, not worth fighting for, and not worth passing on to their own kids.
It’s a stupid way to run a country:
The Royal Society of Biology also said it had sought expertise on ‘decolonising the curriculum’ and for a ‘no more heroes’ approach to teaching science in schools.
This would mean ‘avoiding prescriptive lists of historic figures in biology’ and instead ‘exploring opportunities for local, recogniseable, diverse historic and contemporary figures through which discovery and exploration of biological concepts can be explored’.
President Xi would be pleased.
This is a test to see if we will resist. Mock it accordingly so the people that spout this craven nonsense crawl back in their holes.
Note that in 2015-2016 the Tropics and SH peaked in between two summer NH spikes. That pattern repeated in 2019-2020 with a lesser Tropics peak and SH bump, but with higher NH spikes. By end of 2020, cooler SSTs in all regions took the Global anomaly well below the mean for this period. A small warming was driven by NH summer peaks in 2021-22, but offset by cooling in SH and the tropics, By January 2023 the global anomaly was again below the mean.
The best context for understanding decadal temperature changes comes from the world’s sea surface temperatures (SST), for several reasons:
The ocean covers 71% of the globe and drives average temperatures.
SSTs have a constant water content, (unlike air temperatures), so give a better reading of heat content variations.
Major El Ninos have been the dominant climate feature in recent years.
HadSST is generally regarded as the best of the global SST data sets, and so the temperature story here comes from that source. Previously I used HadSST3 for these reports, but Hadley Centre has made HadSST4 the priority, and v.3 will no longer be updated. HadSST4 is the same as v.3, except that the older data from ship water intake was re-estimated to be generally lower temperatures than shown in v.3. The effect is that v.4 has lower average anomalies for the baseline period 1961-1990, thereby showing higher current anomalies than v.3. This analysis concerns more recent time periods and depends on very similar differentials as those from v.3 despite higher absolute anomaly values in v.4. More on what distinguishes HadSST3 and 4 from other SST products at the end. The user guide for HadSST4 is here.
The Current Context
The chart below shows SST monthly anomalies as reported in HadSST4 starting in 2015 through November 2024. A global cooling pattern is seen clearly in the Tropics since its peak in 2016, joined by NH and SH cycling downward since 2016, followed by rising temperatures in 2023 and 2024.
Note that in 2015-2016 the Tropics and SH peaked in between two summer NH spikes. That pattern repeated in 2019-2020 with a lesser Tropics peak and SH bump, but with higher NH spikes. By end of 2020, cooler SSTs in all regions took the Global anomaly well below the mean for this period. A small warming was driven by NH summer peaks in 2021-22, but offset by cooling in SH and the tropics, By January 2023 the global anomaly was again below the mean.
Now in 2023-24 came an event resembling 2015-16 with a Tropical spike and two NH spikes alongside, all higher than 2015-16. There was also a coinciding rise in SH, and the Global anomaly was pulled up to 1.1°C last year, ~0.3° higher than the 2015 peak. Then NH started down autumn 2023, followed by Tropics and SH descending 2024 to the present. After 10 months of cooling in SH and the Tropics, the Global anomaly was back down, led by NH cooling the last 3 months from its peak in August.
Comment:
The climatists have seized on this unusual warming as proof their Zero Carbon agenda is needed, without addressing how impossible it would be for CO2 warming the air to raise ocean temperatures. It is the ocean that warms the air, not the other way around. Recently Steven Koonin had this to say about the phonomenon confirmed in the graph above:
El Nino is a phenomenon in the climate system that happens once every four or five years. Heat builds up in the equatorial Pacific to the west of Indonesia and so on. Then when enough of it builds up it surges across the Pacific and changes the currents and the winds. As it surges toward South America it was discovered and named in the 19th century It iswell understood at this point that the phenomenon has nothing to do with CO2.
Now people talk about changes in that phenomena as a result of CO2 but it’s there in the climate system already and when it happens it influences weather all over the world. We feel it when it gets rainier in Southern California for example. So for the last 3 years we have been in the opposite of an El Nino, a La Nina, part of the reason people think the West Coast has been in drought.
It has now shifted in the last months to an El Nino condition that warms the globe and is thought to contribute to this Spike we have seen. But there are other contributions as well. One of the most surprising ones is that back in January of 2022 an enormous underwater volcano went off in Tonga and it put up a lot of water vapor into the upper atmosphere. It increased the upper atmosphere of water vapor by about 10 percent, and that’s a warming effect, and it may be that is contributing to why the spike is so high.
A longer view of SSTs
Open image in new tab to enlarge.
The graph above is noisy, but the density is needed to see the seasonal patterns in the oceanic fluctuations. Previous posts focused on the rise and fall of the last El Nino starting in 2015. This post adds a longer view, encompassing the significant 1998 El Nino and since. The color schemes are retained for Global, Tropics, NH and SH anomalies. Despite the longer time frame, I have kept the monthly data (rather than yearly averages) because of interesting shifts between January and July. 1995 is a reasonable (ENSO neutral) starting point prior to the first El Nino.
The sharp Tropical rise peaking in 1998 is dominant in the record, starting Jan. ’97 to pull up SSTs uniformly before returning to the same level Jan. ’99. There were strong cool periods before and after the 1998 El Nino event. Then SSTs in all regions returned to the mean in 2001-2.
SSTS fluctuate around the mean until 2007, when another, smaller ENSO event occurs. There is cooling 2007-8, a lower peak warming in 2009-10, following by cooling in 2011-12. Again SSTs are average 2013-14.
Now a different pattern appears. The Tropics cooled sharply to Jan 11, then rise steadily for 4 years to Jan 15, at which point the most recent major El Nino takes off. But this time in contrast to ’97-’99, the Northern Hemisphere produces peaks every summer pulling up the Global average. In fact, these NH peaks appear every July starting in 2003, growing stronger to produce 3 massive highs in 2014, 15 and 16. NH July 2017 was only slightly lower, and a fifth NH peak still lower in Sept. 2018.
The highest summer NH peaks came in 2019 and 2020, only this time the Tropics and SH were offsetting rather adding to the warming. (Note: these are high anomalies on top of the highest absolute temps in the NH.) Since 2014 SH has played a moderating role, offsetting the NH warming pulses. After September 2020 temps dropped off down until February 2021. In 2021-22 there were again summer NH spikes, but in 2022 moderated first by cooling Tropics and SH SSTs, then in October to January 2023 by deeper cooling in NH and Tropics.
Then in 2023 the Tropics flipped from below to well above average, while NH produced a summer peak extending into September higher than any previous year. Despite El Nino driving the Tropics January 2024 anomaly higher than 1998 and 2016 peaks, following months cooled in all regions, and the Tropics continued cooling in April, May and June along with SH dropping. After July and August NH warming again pulled the global anomaly higher, September and October resumed cooling in all regions.
What to make of all this? The patterns suggest that in addition to El Ninos in the Pacific driving the Tropic SSTs, something else is going on in the NH. The obvious culprit is the North Atlantic, since I have seen this sort of pulsing before. After reading some papers by David Dilley, I confirmed his observation of Atlantic pulses into the Arctic every 8 to 10 years.
Contemporary AMO Observations
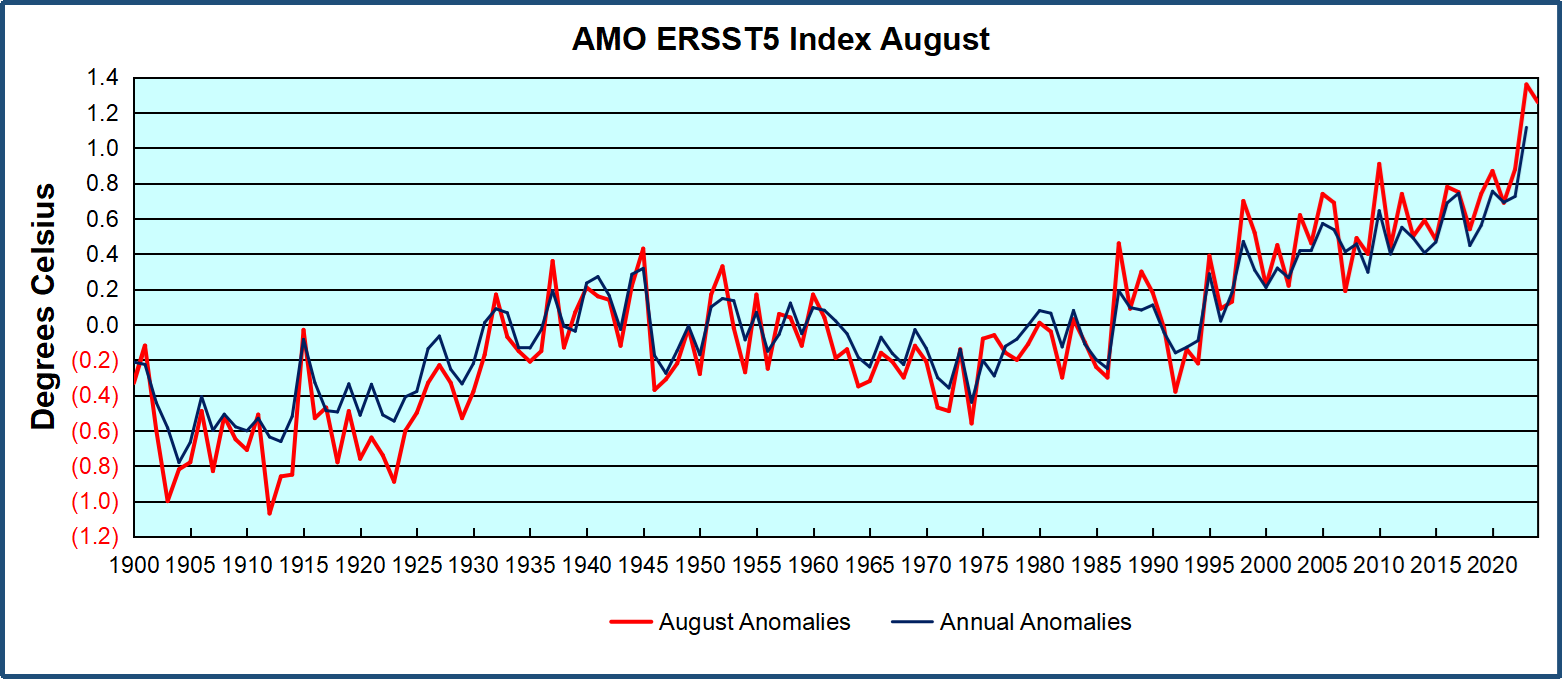
Through January 2023 I depended on the Kaplan AMO Index (not smoothed, not detrended) for N. Atlantic observations. But it is no longer being updated, and NOAA says they don’t know its future. So I find that ERSSTv5 AMO dataset has current data. It differs from Kaplan, which reported average absolute temps measured in N. Atlantic. “ERSST5 AMO follows Trenberth and Shea (2006) proposal to use the NA region EQ-60°N, 0°-80°W and subtract the global rise of SST 60°S-60°N to obtain a measure of the internal variability, arguing that the effect of external forcing on the North Atlantic should be similar to the effect on the other oceans.” So the values represent sst anomaly differences between the N. Atlantic and the Global ocean.
The chart above confirms what Kaplan also showed. As August is the hottest month for the N. Atlantic, its variability, high and low, drives the annual results for this basin. Note also the peaks in 2010, lows after 2014, and a rise in 2021. Then in 2023 the peak was holding at 1.4C before declining. An annual chart below is informative:
Note the difference between blue/green years, beige/brown, and purple/red years. 2010, 2021, 2022 all peaked strongly in August or September. 1998 and 2007 were mildly warm. 2016 and 2018 were matching or cooler than the global average. 2023 started out slightly warm, then rose steadily to an extraordinary peak in July. August to October were only slightly lower, but by December cooled by ~0.4C.
Then in 2024 the AMO anomaly started higher than any previous year, then leveled off for two months declining slightly into April. Remarkably, May showed an upward leap putting this on a higher track than 2023, and rising slightly higher in June. In July, August and September 2024 the anomaly declined, and despite a small rise in October, is now lower than the peak reached in 2023.
The pattern suggests the ocean may be demonstrating a stairstep pattern like that we have also seen in HadCRUT4.
The purple line is the average anomaly 1980-1996 inclusive, value 0.18. The orange line the average 1980-202404, value 0.39, also for the period 1997-2012. The red line is 2013-202409, value 0.69. As noted above, these rising stages are driven by the combined warming in the Tropics and NH, including both Pacific and Atlantic basins.
The oceans are driving the warming this century. SSTs took a step up with the 1998 El Nino and have stayed there with help from the North Atlantic, and more recently the Pacific northern “Blob.” The ocean surfaces are releasing a lot of energy, warming the air, but eventually will have a cooling effect. The decline after 1937 was rapid by comparison, so one wonders: How long can the oceans keep this up? And is the sun adding forcing to this process?
Space weather impacts the ionosphere in this animation. Credits: NASA/GSFC/CIL/Krystofer Kim
Footnote: Why Rely on HadSST4
HadSST is distinguished from other SST products because HadCRU (Hadley Climatic Research Unit) does not engage in SST interpolation, i.e. infilling estimated anomalies into grid cells lacking sufficient sampling in a given month. From reading the documentation and from queries to Met Office, this is their procedure.
HadSST4 imports data from gridcells containing ocean, excluding land cells. From past records, they have calculated daily and monthly average readings for each grid cell for the period 1961 to 1990. Those temperatures form the baseline from which anomalies are calculated.
In a given month, each gridcell with sufficient sampling is averaged for the month and then the baseline value for that cell and that month is subtracted, resulting in the monthly anomaly for that cell. All cells with monthly anomalies are averaged to produce global, hemispheric and tropical anomalies for the month, based on the cells in those locations. For example, Tropics averages include ocean grid cells lying between latitudes 20N and 20S.
Gridcells lacking sufficient sampling that month are left out of the averaging, and the uncertainty from such missing data is estimated. IMO that is more reasonable than inventing data to infill. And it seems that the Global Drifter Array displayed in the top image is providing more uniform coverage of the oceans than in the past.
USS Pearl Harbor deploys Global Drifter Buoys in Pacific Ocean
Forbes and NBC News were among several media outlets that ran what turned out to be ill timed articles on Christmas Eve and Christmas Day claiming climate change threatened to end snow on Christmas. This is false. Despite repeated claims of the “end of snow,” made repeatedly by myriad mainstream media outlets in the past, data show snowfall amounts overall have remained relatively stable over the past few decades, with, if anything, snow falling earlier while declining late in the season with a slightly earlier arrival of spring.
Forbes and NBC News were among several media outlets that ran what turned out to be ill timed articles on Christmas Eve and Christmas Day claiming climate change threatened to end snow on Christmas. This is false. Despite repeated claims of the “end of snow,” made repeatedly by myriad mainstream media outlets in the past, data show snowfall amounts overall have remained relatively stable over the past few decades, with, if anything, snow falling earlier while declining late in the season with a slightly earlier arrival of spring. Overall snow trends are virtually unchanged, and white Christmases are as frequent or infrequent as they have been historically going back to the little ice age prior to the late 1800’s when, due to entirely natural factors, winters were more severe.
Forbes’ Christmas Day article, “Will Climate Change End the Dream of a White Christmas?” and NBC’s Christmas Eve story, “How climate change is making white Christmas a rare event,” were both misleading and particularly ill-timed. Misleading because snowfall and snowpack on or around Christmas is not becoming rare, and ill-timed because even as the stories were running, New York and Boston, among other areas on the Eastern Seaboard were experiencing their first White Christmases in years, with more than one inch and four inches of snow on the ground respectively in the two cities. Lest on think that proves the point that snow for Christmas is becoming a rarer occurrence is these locations, it turns out snowfall and snowpack is relatively rare for bothcities on Christmas due to their locations on the Atlantic Ocean which moderates temperatures across the region.
Misleadingly bemoaning the disappearance of show, Forbes wrote:
For generations, the allure of a white Christmas has captured imaginations worldwide, a phenomenon immortalized in songs and movies. Yet, as global temperatures rise due to climate change, the possibility of snow-covered Decembers is slipping further out of reach in many regions. Recent data reveals the chilling truth that climate change is reshaping winters, and the implications go far beyond holiday aesthetics.
According to NASA, the planet’s average surface temperature has risen by about 1.1°C since the late 19th century, with most warming occurring in the past 40 years. Winters, once defined by prolonged snowfalls, are growing shorter and milder.
Neither Forbes nor NBC are the first to assert that climate change means the end of snow. Sadly, for media integrity, they also likely won’t be the last make such false claims. The New York Times, CNN, and the Daily Telegraph, among other promoters of fake climate news, have made such claims previously. Climate Change Weekly and Climate Realism, here, here, and here, for example, have debunked such claims in the past couple of years.
Had Forbes and NBC looked beyond the slight rise in temperature to speculate about snow’s decline, and rather looked at long-term snow data, as captured by the Rutgers Global Snow Lab, they would have found, that snow extent in the Northern Hemisphere has increased over the past 50 years of modest warming. (See the graph, below)
In fact, the now seemingly discontinued site, Cold Weather Report, during its operation detailed the number of snow records set in the United States and around the globe in recent years. Electroverse has an even longer, continuous track record for covering unusually severe cold and snow events and the harms they cause. Forbes and the other mainstream media outlets seemingly can’t be bothered to check the records discussed in sites like this before running their annual, seasonal slate of misleading alarming climate change stories about the end of snow.
As discussed in Climate at a Glance: Snowpack, NASA satellites also have measured a modest increase in snow cover across North America, Europe, and the Northern Hemisphere as a whole since the 1980s. (See the graph, below)
Some falls, winters, and springs will see colder temperatures and more snow than others, some will see the opposite, warmer temperatures and less snow, but long-term, there has been no trend in declining snowfall, snowpack, or snow extent during the recent period of modest warming. Credible news outlets should report this fact rather than trying to push alarm and climate action based on a false narrative about the end of white Christmases.
Scientific advancement and agricultural technology have revolutionized food production, enabling humanity to feed more readily a ballooning population. And working behind these celebrated innovations is an unacknowledged but indispensable contributor to the world’s growing food security: rising atmospheric carbon dioxide (CO2).
Scientific advancement and agricultural technology have revolutionized food production, enabling humanity to feed more readily a ballooning population. And working behind these celebrated innovations is an unacknowledged but indispensable contributor to the world’s growing food security: rising atmospheric carbon dioxide (CO2).
The very molecule that has been wrongly branded as a doomsday gas has been contributing to increasing yields for essential crops like rice, wheat and soybeans.
Food Security is Serious Business
The 20th century’s Green Revolution demonstrated how scientific intervention – including the use of fertilizers – could dramatically boost crop yields. The late 1960s saw a huge turnaround in yields across the globe, thanks to Norman Borlaug’s high-yielding, drought-adaptive, disease-resistant varieties of food crops.
Nations that had suffered severe poverty and famine became agricultural giants within a decade or so. Between 1965 and 1970, wheat yields nearly doubled in Pakistan and India, two nations that were once pleading for international aid to rescue their people from malnourishment and starvation.
Despite being criticized by some, agricultural advancements in the use of fertilizers, pesticides and gene editing have been vital. Without them, feeding our growing global population would be impossible. But they’re not the complete story.
Also driving higher crop yields has been an increasing concentration of CO2 in the atmosphere that began in the 19th century as the Industrial Revolution accelerated. The rate of increase rose further with global industrialization following World War II.
C3-C4 Divide: Understanding the Difference
Having an especially efficient photosynthetic pathway are C4 plants, which have a four-carbon sugar molecule produced during photosynthesis. These plants, which include corn and sugarcane, have an evolutionary adaptation from millions of years ago that was a response to an atmosphere relatively low in CO2. Thus, C4 crops are already operating near peak efficiency when it comes to CO2 utilization under suitable environmental conditions like that of the present era.
In contrast, C3 plants that developed during a time in the distant past when CO2 levels where many times higher than today’s show dramatic responses to increased atmospheric levels of the gas. C3 plants, named for their three-carbon sugar molecule, have a relatively inefficient photosynthetic process. Their stomata – tiny pores on leaves that allow gaseous exchange – must remain open longer to capture sufficient CO2, which leads to greater water loss through transpiration.
Higher ambient CO2 levels allow C3 plants to photosynthesize more efficiently while losing less water. The benefits of elevated CO2 aren’t merely theoretical, as proven in field studies that have confirmed laboratory findings.
These studies, conducted in real-world conditions, show consistent yield increases across various C3 crops. Wheat yields increase by 20-30% under elevated CO2 conditions, while rice shows increases of between 15-32%. Soybeans, another crucial C3 crop, exhibit yield increases of up to 46% in some studies.
Perhaps nowhere is the CO2 effect more evident than in greenhouse cultivation. Modern greenhouse operators routinely boost productivity by elevating CO2 levels to 800-1,000 parts per million (ppm), which are well above current atmospheric levels of around 420 ppm. The results are striking: tomato yields increase by 40-50%, cucumber production rises by 30-40%, and growth of lettuce and other vegetables accelerates significantly.
In addition, it has now come to light that even C4 crops – like corn and sugarcane – can benefit from elevated CO2 under conditions of drought and low soil nitrogen. This is big revelation for tropical Asian countries where sugarcane farmers often struggle with insufficient water for their plants. Further research could reveal that the 21st century’s elevated CO2 levels have been aiding crop production there.
Understanding CO2‘s role in crop productivity should inform the policy landscape, where governments and corporate entities like Blackrock and Vanguard have incorrectly promoted the reduction of atmospheric CO2 as a “life-saving” endeavor without understanding basic plant biology. The opposite is true: More atmospheric CO2 is a boon to humanity, and less is bad.
We should be grateful for the industrial emissions of carbon dioxide that contribute to greater crop productivity instead of spending billions on foolish projects to remove the gas from the air to store it underground. Such initiatives will do nothing to improve the weather while impoverishing people.
Today’s release of carbon dioxide through the combustion of coal, oil and natural gas is reversing a process that sequestered CO2 from the atmosphere millions of years and lowered to less than optimum concentrations the amount of the gas available for plant growth.
A resolution worth adopting this New Year would be to reject the coordinated demonization of CO2 by climate scaremongers and to celebrate it for what it is: the gas of life.
This commentary was first published at BizPac Review on December 27, 2024.
Vijay Jayaraj is a Science and Research Associate at the CO2 Coalition, Arlington, Virginia. He holds an M.S. in environmental sciences from the University of East Anglia and a postgraduate degree in energy management from Robert Gordon University, both in the U.K., and a bachelor’s in engineering from Anna University, India.
Your report claims that “climate change has brought extreme weather from hurricanes to month-long droughts”
It then goes on to list a handful of random weather events, but fails to provide any evidence that these are anything other than natural events which happen all the time. Nor any evidence that such events have been getting more frequent or extreme over time.
The report highlights typhoons in the Philipppines and Hurricane Beryl as examples of climate change, stating that it may be increasing their intensity. Yet last year the number of both global Tropical Cyclones (the generic term for typhoons and hurricanes), and the strongest ones were both below average. Nor does the official data show any evidence of them becoming more powerful over time. (See Fig 1).
There is also a section on heatwaves in Asia, which again fails to offer any evidence that these were in any way unusual. There is for instance a reference to a heatwave in Delhi last May & June, yet the official temperature record from the Indian Met Office for those months last year shows temperatures were not unusually high at all there. (See Fig 2)
Another section of your report addresses the drought in the Amazon, but the World Bank Climate Portal states that rainfall there has increased by 5% in the last 30 years: (See Fig 3)
Whatever the cause of last year’s drought, it is not part of any longer-term trend and therefore cannot be “climate-related”.
Finally, you highlight floods in Nigeria, Chad and Sudan. It is certainly true that the climate in these countries is now wetter than it was 40 years ago, but the 1970s and 80s marked the Great Sahel Drought across this whole swathe of Africa. Since then, rainfall has merely returned to levels seen before 1970. The wetter climate has nothing to do with global warming, as implied. (see Fig 4)
Throughout your report, you base your claims on Weather Attribution Computer Models. However, computer models are not evidence of anything and can be manipulated to provide whatever results are desired. That is why they are widely derided by the wider scientific community.
Unless you can provide factual data to back up your claims, the report should be withdrawn and a correction published.
As Donald Trump prepares to resume his role as U.S. President in January, perhaps the most important work under his auspices will be that of the so-called Department of Government Efficiency. Americans are waiting with bated breath foraudits of the Department of Defense, which just failed its seventh straight audit, and other federal agencies.
Mail delivery truck. White postal van. Cartoon vehicle in flat style. Delivery service transport. Vector illustration
As Donald Trump prepares to resume his role as U.S. President in January, perhaps the most important work under his auspices will be that of the so-called Department of Government Efficiency. Americans are waiting with bated breath foraudits of the Department of Defense, which just failed its seventh straight audit, and other federal agencies.
The mammoth job being undertaken by Elon Musk, Vivek Ramaswamy, and their cohorts will surely include a stern review of “climate crisis” spending, much of it from the Biden-Harris $1.2 trillion Infrastructure Investment and Jobs Act (IIJA) of 2021 that dwarfed the $831 billion from the Obama-Biden American Recovery and Reinvestment Act of 2009.
The crown jewel of the 2009 law was the $535 million allocated to Solyndra, which all went down the tubes when the company declared bankruptcy shortly after paying its executives hefty bonuses and leaving its 1,100 employees without severance pay.
Open the Books chronicled a long list of other Obama-Biden green energy ripoffs, including $401 million to Abound Solar, $280 million to Calisolar, $193 million to Fisker Automotive, and $132 million to A123 Systems. A report from the Inspector General’s Office later found that the Department of Energy did not properly manage and approve Solyndra’s loan guarantee.
On the heels of the 2021 IIJA, Biden-Harris wangled another $370 billion for “renewable energy and climate resilience” spending out of the 2022 Inflation Reduction Act (IRA). It is these climate-focused bills, along with money spent to foment wars in Europe and the Middle East, that have ballooned the national debt and fueled runaway inflation – and likely led to the Trump victory.
One example of wasteful federal spending under the IRA was a $3 billion supplemental appropriation to Oshkosh Defense to finalize the design and assemble 50,000 of the U.S. Post Office’s Next Generation Delivery Vehicles (NGDVs).
In February 2021, after a 3-year delay, Postmaster General Louis DeJoy had promised that the first NGDVs would be on carrier routes in 2023. That date was already years behind the initial goal to have new trucks during Trump’s first term. The USPS contracted with Oshkosh Defense, which announced in March 2022 that the initial order was for 50,000 NGDVs over a 10-year period at a cost of $2.9 billion.
The initial order included only 10,019 battery-electric vehicles, with the rest to be powered by traditional internal combustion engines. The goal was to get the cheaper to build ICE vehicles into post offices quickly to replace aging Grumman vehicles that lacked modern-day safety measures and conveniences, most notably air conditioning.
But once the $3 billion in IRA funding was approved, that initial order was changed to 35,000 BEVs and just 15,000 ICE vehicles, with the priority reversed to build the BEVs first. That extra money was sparked by protests from “green” groups that the USPS should not buy ANY ICE vehicles and federal “logic” that the $3 billion in taxpayer funds – which seemingly doubles the cost per vehicle — would make the BEV NGDVs “more affordable” (for the government, not the taxpayer).
Sadly, as reported in The Washington Post, as of December 11, 2024, only 93 of the scheduled 3,000 all-electric NGDVs had been delivered. The shortfall is reminiscent of the report last March by the Post that only seven electric-vehicle charging stations had been put in place nearly two years after Congress allocated $7.5 billion to vastly expand the public charging network.
While the taxpayer is further subsidizing these new postal vehicles for an agency that lost $9.5 billion (but “just” $1.8 billion in “controllable” costs) in fiscal 2024, the real cost over the 30-year lifespan traditional with postal vehicles will be much, much higher – largely from battery replacement costs. Worse, mail carriers will have longer waits for their new vehicles.
The arguments for an all-electric postal fleet included that BEVs are perfect for delivering mail, given that the stop-and-go driving allows the use of regenerative braking and that the trucks all return to their charging stations at the end of each shift. Some pointed to older ICE vehicles catching fire (without mentioning that BEV fires are much more difficult to contain).
Back in March, however, Michael O. Foster, Director of the Motor Vehicle Craft Division of the American Postal Workers Union, acknowledged that “there are positives and negatives to having a fleet of electric vehicles.” He cited the greater stress on the electric grid as a major negative. Charging stations, he added, take up space and can affect parking, but with fewer moving parts there could be a reduction in maintenance requirements for NGDV BEVs.
Foster also said that the mailbox-to-mailbox type of delivery does not fully utilize the vehicle’s ability to put electricity back into the battery while braking. Moreover, these BEVs have an 8-hour charge time with a range of about 200 miles and “should primarily be used on park and loop routes where box to box delivery isn’t required.”
Speculation is already rampant that the second Trump Administration may take a long look at the USPS contracts and recommend major changes. One faction wants to privatize the postal service altogether, a move that could lead to an entirely new funding mechanism for delivering mail to American homes and businesses.
At a recent press conference, Trump said that taking the Postal Service private is “an idea that a lot of people have liked for a long time.” Indeed, the first Trump Administration had created a task force to recommend a pathway to put the money-losing agency on firmer financial footing, but opposition from Congress killed that initiative.
The White House in 2018, though, said that a privatized Postal Service “would have a substantially lower cost structure, be able to adapt to changing customer needs and make business decisions free from political interference and have access to private capital markets to fund operational improvements without burdening taxpayers.”
As badly as taxpayers have been abused during the Biden years, removing some of those burdens would be a welcome change.
Mexico is another country which continues to increase emissions. Even their Paris NDC was explicit about this, as it pledged only to cut emissions from a theoretical Business as Usual scenario. The resulting targeted emissions in 2030 would be higher than they were in 2015!
While Miliband wants to lead us over the cliff, the rest of the world is just getting on as normal.
Mexico is another country which continues to increase emissions. Even their Paris NDC was explicit about this, as it pledged only to cut emissions from a theoretical Business as Usual scenario. The resulting targeted emissions in 2030 would be higher than they were in 2015!
Since then, Mexico has upped the reduction from 22% to 35%, but as Climate Action Tracker point out, they have also upped the BAU:
Mexico’s climate policies continue to go backwards, as fossil fuel use is prioritised and climate-related policies and institutions dismantled. Mexico’s updated 2030 target (NDC), submitted in November 2022 results in higher emission levels than the targets from 2016, breaching both agreements under the Paris Agreement and Mexican Law – where governments committed to improve their targets over time. The updated NDC lacks transparency and disguises its lack of ambition by counting forests differently in the base and in the target year. Mexico will meet the unambitious target with already implemented policies as emissions continue to rise through 2030. With this update, the CAT’s rating of Mexico’s climate targets and action worsens from “Highly insufficient” to “Critically insufficient”.
While the new target includes a larger percentage reduction it still leads to higher emissions. The NDC update increases the percentage reduction of the unconditional target from 22% to 35% (30% with own resources and an additional 5% from agreed international support) by 2030 and from 36% to 40% conditional on additional international support. But the business-as-usual (BAU) baseline, against which the targets are defined, has been revised upwards. In addition, Mexico expects a higher contribution of emissions sinks in forests to achieving the target. Together this means that the new target can be met even if emissions excluding those of forestry are higher than what they could have been under the old target.
The 2022 NDC update replaces the 2020 update, which became invalid after a Mexican court found that it is less ambitious than the very first NDC of 2016 and therefore a violation of continuous progression of ambition. The 2022 update is less specific on the contribution of forestry to the target, which may make it more difficult to argue its ambition.
Mexico pursues a “gross-net” approach, meaning it counts only emissions sources in its BAU, ignoring sinks from land use and forestry. However, the NDC does intend to use these sinks to achieve the target, highlighting that nature-based solutions are ‘central’ to achieving the targets. In 2019, reported sinks were almost 200 MtCO2e, or about a quarter of Mexico’s emissions excl. land use, land use change and forestry. While technically allowed, this accounting approach has been criticised as in-transparent for over 20 years.
Mexico’s 2022 NDC update removes the target to peak emissions in 2026 and does not mention any net zero nor other long-term targets.
Australia’s new mandatory climate reporting legislation begins this week.
The legislation requires companies to disclose their emissions and how a warming planet may impact their balance sheets.
What’s next:
Only the largest entities need to start reporting this year, but more will be captured by the legislation in coming years.
Australia has introduced new mandatory climate reporting rules that require business owners to estimate their company’s emissions and outline plans to tackle future risks.
The legislation, passed in 2024, is the most significant change to reporting requirements and director responsibilities in a generation, according to the Australian Institute of Company Directors (AICD).
It will require companies to disclose their greenhouse gas emissions and explain how a range of future climate scenarios could impact their business, in a sustainability report filed alongside their financial data.
Initially, the legislation will apply only to Australia’s largest companies but by 2027, thousands of corporate and not-for-profit organisations will be included — something AICD managing director and CEO Mark Rigotti said would be a significant change in the way companies approach their mandatory disclosures.
“It’s actually quite a fundamental step change in reporting and there probably hasn’t been as significant a change since 2003, when we moved from sort of domestic financial standards to international financial reporting standards,” Mr Rigotti said.
I’m not a legal expert so please consult your own lawyers, but it seems the only legally safe way to avoid being prosecuted for making misleading financial statements is to tell the truth.
Greens will be on the lookout, to pounce on companies which make misleading statements in their company reports about their climate policies. I fully expect to see some showcase prosecutions for companies which make misleading statements, directors who think they can play business as usual, misleading the public and their investors about their climate commitments.
The best way to play it safe is to admit you don’t have any plans to address climate change or reduce emissions.
Companies have a fiduciary duty to serve the interests of shareholders. A commitment to winding up the business if climate change erodes profit is a legally acceptable response to all these alleged climate threats. Companies are under no obligation to continue operating under adverse trading conditions. If the board believes shareholder capital is at risk, they are entirely justified enacting an orderly shutdown of the company and sale of corporate assets, to return as much capital as possible to shareholders.
So a company which says “If climate change adversely affects our business, we shall cease trading and sell all our assets” is entirely within their rights to do so, providing they can justify this statement as being in the best interest of shareholders. Going for short term profits, using their lack of climate action as a strategy to undermine competitors and win market share, then shutting down the company when this course of action is no longer tenable, is an entirely acceptable way to respond to the alleged climate crisis.
The reality of course is there is no climate crisis. But by taking an official position of accepting the existence of the crisis, then explaining you don’t intend to do anything about it, along with justifications for this position, company directors should be able to minimise their personal risk while serving the best interests of their shareholders.
If any director caves in to pressure to spend big on climate action, that course of action also carries risks. Merchant banks in the USA have been accused of conflicts of interest, because of their green commitments. Directors who cave to the green blob might find themselves personally liable for investor capital losses, if they divert too much shareholder cash away from profit making activities, if courts find they breached their fiduciary duty to shareholders.
I hope some company directors have the courage to take the high road, to stand up for shareholder interests instead of ducking and weaving, business as usual, trying to finesse their position while the green walls are closing in. Because if some of them do stand up and take the government on at their own game, 2025 is going to be an entertaining year for Australian climate policy.
UN.org excerpt: The Brazilian government, the United Nations and UNESCO are joining forces to strengthen research and measures to address disinformation campaigns that are delaying and derailing climate action.
UN.org excerpt: The Brazilian government, the United Nations and UNESCO are joining forces to strengthen research and measures to address disinformation campaigns that are delaying and derailing climate action.
“We must also take on climate disinformation. Together with Brazil and UNESCO, the United Nations is launching the Global Initiative for Information Integrity on Climate Change. We will work with researchers and partners to strengthen action against climate disinformation.” – United Nations Secretary-General António Guterres
“This initiative will bring together countries, international organizations, and networks of researchers to support joint efforts to combat disinformation and promote actions in preparation for COP30 in Brazil.” – President Luiz Inácio Lula da Silva of Brazil
Aiming to expand the scope and breadth of research into climate disinformation and its impacts, the effort will gather evidence from around the world to inform and bolster strategic action, advocacy and communications.
The Initiative responds to the commitment in the Global Digital Compact, adopted by United Nations Members States at the Summit of the Future in September 2024, which encourages UN entities, in collaboration with Governments and relevant stakeholders, to assess the impact of mis- and disinformation on the achievement of the Sustainable Development Goals.
“Through this initiative, we will support the journalists and researchers investigating climate issues, sometimes at great risk to themselves, and fight the climate-related disinformation running rampant on social media.” – Audrey Azoulay, Director General of UNESCO
As part of the Initiative, a Global Fund will be created to finance networked, in-depth research that will contribute to exposing and dismantling disinformation related to climate change, as well as socializing the results of the research. The Fund will be administered and implemented by UNESCO and will be structured as a Multi-Partner Trust Fund.
The Initiative will support and strengthen existing communications campaigns on climate change to mitigate and counter climate disinformation, particularly in the lead-up to the 30th Conference of the Parties to the UN Framework Convention on Climate Change, COP30, to be held in Brazil in November 2025. It will also support ongoing advocacy and communications to strengthen the integrity of information environments globally and work to garner support from civil society and scientific groups worldwide.
Among those joining the Initiative are UN Member States (Chile, Denmark, France, Morocco, Sweden and the United Kingdom have confirmed participation), UN entities (UN Climate Change, the World Meteorological Organization), the Organisation for Economic Co-operation and Development (OECD), and civil society representatives.
…
‘Verified for Climate’
One of the ongoing key efforts to stand up to climate disinformation is Verified for Climate, a joint initiative of the United Nations and the social impact agency Purpose, promoting solutions-focused, science-based information to debunk myths and put an end to the narratives of denialism, doomism, and delay.
Originally launched in response to the COVID-19 pandemic, ‘Verified’ is a global communications infrastructure that addresses the most pressing and emerging challenges of mis- and disinformation around the world.
‘Verified for Climate’ is based on a three-pillar approach: trusted messenger and community engagement to engage and persuade audiences at a ground level; global creative campaigns to reach target audiences en masse and make visible the issue; and convenings that focus on insights from climate communications experts, leveraging solutions to encourage global cooperation.
#
END UN.org excerpt
The UN wants to control climate information so you only hear facts that “boost support for urgent climate action”
That’s just blatant activism
Imagine a similar initiative for information integrity on migration
The United Nations is an intergovernmental body of morally bankrupt bureaucrats who have anointed themselves as the leading scientific authority on all matters, including environmental issues.
Don’t take my word for it, here it is straight from the horse’s mouth,


You must be logged in to post a comment.