Chinaโ€™s AI Sputnik Moment Just Changed the World

Green energy is dead โ€“ China just fired the opening shot in a new high energy cold war race to build the ultimate AI.

From Watts Up With That?

Essay by Eric Worrall

Green energy is dead โ€“ China just fired the opening shot in a new high energy cold war race to build the ultimate AI.

DeepSeekโ€™s tech breakthrough hailed in China as answer to win AI war

โ€˜We should have confidence that China will eventually win the AI war with the US,โ€™ Qihoo 360โ€™s Zhou Hongyi said in a Weibo post

Ben Jiangin Beijing and Bien Perezin Hong Kong

Published: 12:00pm, 28 Jan 2025Updated: 1:25pm, 28 Jan 2025

DeepSeek, extolled by some as the โ€œbiggest dark horseโ€ in the open-source large language model (LLM) arena, now has a bullโ€™s eye on its back, as the start-up is being touted as Chinaโ€™s secret weapon in the artificial intelligence (AI) war with the US.

The Hangzhou-based company sent shock waves across Wall Street and Silicon Valley for developing AI models at a fraction of the cost compared with OpenAI and Meta Platforms, which prompted US President Donald Trump to call the breakthrough a โ€œwake-up callโ€ and โ€œpositiveโ€ for Americaโ€™s tech sector.

At home, Chinese tech executives and various commentators rushed to hail DeepSeekโ€™s disruptive power.

Zhou Hongyi, co-founder, chairman and chief executive of Chinese cybersecurity firm Qihoo 360, declared that DeepSeek has โ€œupended the worldโ€ in a recent video posted on his Weibo account, after the start-upโ€™s release of two powerful new AI models โ€“ built at a lower cost and with less computing resources than what larger tech firms typically need for LLM development.

โ€ฆRead more:

ย https://www.scmp.com/tech/tech-trends/article/3296503/deepseeks-tech-breakthrough-hailed-china-answer-win-ai-war

The impact of this breakthrough on the US tech landscape has been dramatic;

Nvidia sheds almost $600 billion in market cap, biggest one-day loss in U.S. history

PUBLISHED MON, JAN 27 20254:08 PM ESTUPDATED MON, JAN 27 20255:26 PM EST

Samantha Subin@SAMANTHA_SUBIN

  • Nvidia shares plunged 17% on Monday, resulting in a market cap loss of close to $600 billion, the biggest drop ever for a U.S. company.
  • The sell-off, which hit much of the U.S. tech sector, was sparked by concerns about increased competition from Chinese AI lab DeepSeek.
  • Data center companies that rely on Nvidia chips also plummeted, with Dell, Oracle and Super Micro Computer all falling by at least 8.7%.

Nvidia lost close to $600 billion in market cap on Monday, the biggest drop for any company on a single day in U.S. history.

The chipmakerโ€™s stock price plummeted 17% to close at $118.58. It was Nvidiaโ€™s worst day on the market since March 16, 2020, which was early in the Covid pandemic. After Nvidia surpassed Apple last week to become the most valuable publicly traded company, the stockโ€™s drop Monday led a 3.1% slide in the tech-heavy Nasdaq.

The sell-off was sparked by concerns that Chinese artificial intelligence lab DeepSeek is presenting increased competition in the global AI battle. In late December, DeepSeek unveiled a free, open-source large language model that it said took only two months and less than $6 million to build, using reduced-capability chips from Nvidia called H800s. 

โ€ฆRead more:

ย https://www.cnbc.com/2025/01/27/nvidia-sheds-almost-600-billion-in-market-cap-biggest-drop-ever.html

Back in December I predicted 2025 would be the year of the gigawatt AI project, and suggested China was getting into the AI game in a big way, though details were sparse. This observation has now been confirmed by the DeepSeek announcement.

My research back in December also suggested China has an edge in this race, because of their vast surplus of fossil fuel energy. Chinaโ€™s construction slowdown has left lots of surplus energy and industrial capacity looking for a use. AI could be the ticket to soak up that spare capacity.

The USAโ€™s only hope of catching up with China is to match Chinaโ€™s access to energy, by cost, stability and quantity. Because one thing AI needs more than anything is gigawatts of rock stable dedicated capacity. On the energy front, the USA is so far behind the game, it will take the USA years to level up even to Chinaโ€™s current capacity on this most critical metric.

Where is the room in this new AI space race for energy conservation, expensive renewables, and impractical battery storage?

The USA better get this right, because the USA is the only power which can hope to match Chinaโ€™s AI research resources.

US AI companies are rising to the challenge. President Trump recently gave his backing to the Stargate Project, a $500 billion collaboration by US AI companies, which some people are describing as an AI Manhattan Project.

Britain and Europe have expressed interest in AI, but for the foreseeable future there is no point taking such announcements seriously. Right now both are so energy poor they are not even on the map. Until they set their house in order, and ditch their green fantasies, Britain and Europe will continue to be spectators to the greatest tech revolution in human history.

Despite hundreds of billions of dollars in resources being advanced by favourites to win the AI race, there are other players whose outstanding achievements qualify them as contenders.

India is a big player in the AI game โ€“ they have the energy resources and people power to match Chinaโ€™s AI push, and have long been a software and computing titan, thanks to their governmentโ€™s long standing policy of zero tax on offshore IT industry income, and special low tax high tech economic zones. The large scale presence of Indian immigrants in Silicon Valley is also testament to Indiaโ€™s tech prowess โ€“ no doubt India will attempt in coming years to lure top Indian Silicon Valley IT people to return home, to participate in Indiaโ€™s AI tech race. I fully expect India to make a similar AI announcement to China in the coming year.

Israel is solid a contender, their AI battlefield technology is world class. But it remains to be seen whether the Israeli economy can muster the resources required for a serious attempt to build the first artificial general intelligence.

There is one other contender worth mentioning โ€“ Turkey. Despite ongoing Turkish economic and political instability, Turkey has a surprisingly robust high tech manufacturing sector, with a solid track record of high tech achievement. During the recent Libyan civil war, which Turkey and Russia turned into a high tech weapons showcase by arming opposing factions, Turkey decisively defeated Russiaโ€™s world class drone jamming system by creating the worldโ€™s first autonomous terminator robot, an AI attack robot which does not need a control signal. Turkey might be the 100 to one outsider when it comes to the race to build the worldโ€™s first AI super intelligence, but given unlocking the secret to building the first artificial super intelligence might require brains rather than brawn, a theoretical breakthrough rather than global superpower scale investment, Turkey cannot be completely discounted as a contender.

There are other players which in the future might become significant, such as Nigeria, which is becoming a serious presence in the high tech field, Japan, with a long history of AI pioneering, AI powered animatronics and other advanced technologies, and Iran, which is quietly upping its skills base by supplying high tech weapons to Russia. But I do not believe these players are treating the AI arms race as a serious enough national priority to be true contenders, though I might be mistaken about Japan.

One thing is clear. The USA has hesitated too long to put all the required stepping stones in place, and has a lot of catchup to do. The USAโ€™s energy shortfall relative to China could cripple US efforts to keep up with Chinaโ€™s AI push, unless this shortfall is remedied in the near future.


If you want to know why AI needs so much energy, this article delves into how AI works.3

Only bad people get their news from social media and believe โ€œconspiracy theoriesโ€

The trick in this โ€œpeer reviewedโ€ propaganda is how they define civic values. You might think it means checking on elderly neighbors, donating to charity, or volunteering at the Scouts, but actually โ€œCivic values were defined as an individualโ€™s belief in democratic institutions โ€œ. So if you question parliament or universities you are not a good citizen. The institutions are sacred!

From JoNova

By Jo Nova

The Blob are afraid they will lose even more followers to social mediaโ€ฆ

Academics and the old dying media have produced a study that โ€œshowsโ€ people who believe social media posts are bad people. The message here for believers is that only horrible people get their news from sites like X or TikTok.  Those selfish people score badly on civic values.

The trick in this โ€œpeer reviewedโ€ propaganda is how they define civic values. You might think it means checking on elderly neighbors, donating to charity, or volunteering at the Scouts, but actuallyย โ€œCivic values were defined as an individualโ€™s belief in democratic institutionsย โ€œ. So, if you question parliament or universities, you are not a good citizen. The institutions are sacred!

This transparent paper is just a get-out-of-jail free card for sloppy, self-serving academics. Mike Benz warned us that the Blob redefined โ€œdemocracyโ€ as โ€œdemocratic institutionsโ€ in 2016, which meant people could be tarred with the โ€œanti-democraticโ€ brush if they criticized the โ€œessential institutionsโ€ of democracy, like elections, insurrections, vaccines, or senile Presidents.

The left destroy the meaning of words to deceive their flock. The right let them get away with it.

Australians who get most of their news from social media more likely to believe in climate conspiracy, study finds

Amanda Meade, The Guardian

Those who believe global heating is a conspiracy get most of their information about news and current events from commercial and social media, according to a study by researchers at Monash University.

The study, led by Prof Mark Andrejevic and Assoc Prof Zala Volcic, found that those who relied on social media as the main source of news scored lower on a measure of โ€œcivic valuesโ€ than people who relied on newspapers and non-commercial media.

Civic values were defined as an individualโ€™s belief in democratic institutions and practices, as well as their openness to considering perspectives that challenged their own.

Of course, having redefined โ€œcivic valuesโ€ they can also define โ€œconspiraciesโ€ any way they want. Even if a Nobel Prize winner is not convinced about a wild hypothesis invented by B-Grade modelers, just call it a conspiracyโ€ฆ

For the climate change question, researchers asked whether โ€œfluctuations in the climate are the result of natural cycles that take place regardless of human activityโ€.

Of those who got most of their news from commercial TV and radio, 37% agreed with the statement. Of those who got most of their information from social media, 25% believed climate change was a conspiracy.

To rephrase, nearly 40% of the people said climate fluctuation is natural, which presumably the team at Monash would call a โ€œconspiracyโ€.  The Sun colludes with the moon-wolf or something.

But the social purity of the ABC radio audience is 98%. These publicly funded โ€œjournalistsโ€ are practically offering hypnosis. Obviously they never present both sides of the story. If they did that, the ABC audience would form more a bell curve of opinions, rather than a religious believer 98:2 split.

Conversely, those who disbelieved in conspiracies about climate change were more likely to get their information from public broadcasters ABC and SBS. Only 2% of those whose main source of information was public radio and 6% of those whose main source was public television believed the climate crisis was a conspiracy.

So 98% of public radio listeners all think the same thing on a complex topic, and this is supposed to be a sign of a healthy democracy?

But the good news is that 60% of Australians mainly get their news from social media sources. No wonder the Blob is aquiver. Only 34% got their news from Channel Seven, Nine and Ten, and just 6% got it from ABC or SBS public broadcasters.

REFERENCE

Global Warming to Kill Millions in Europeโ€“Telegraph

Needless to say, the scary scenarios highlighted by the Telegraph are based on the most extreme global warming scenario of 4C.

From NOT A LOT OF PEOPLE KNOW THAT

By Paul Homewood

h/t Ian Magness

There is an unbelievably poor in the Telegraph today by Sarah Knapton, Science Editor, headlined โ€œGlobal warming to prevent 3.4 million deaths from cold โ€ฆ but at a deadly costโ€.

It is based on a new study which claims global warming will prevent 3.4 million deaths from the cold in Europe by the end of the century, but heat will kill 5.8 million.

Apparently Italy, France and Spain would face hundreds of thousands of excess deaths.

But nowhere does Knapton recognise the fact that cold kills four times as many people than heat in southern Europe now.

https://www.thelancet.com/action/showPdf?pii=S2542-5196%2821%2900081-4

Needless to say, the scary scenarios highlighted by the Telegraph are based on the most extreme global warming scenario of 4C.

Thankfully the Telegraph readers quickly saw through this latest piece of propaganda.

Devious Climate Attributionย Studies

Weather and climate extremesโ€”such as high temperatures, floods, droughts, tropical cyclones, extratropical cyclones, and severe thunderstormsโ€”have always threatenedย both human and natural systems. Given their significant impacts, there is considerable interest in how human-caused climate change influences these extremes. This is the focus of the relativelyย new discipline of Extreme Event Attribution (EEA).

From Science Matters

ย Byย Ron Clutz

Patrick Brown raises the question Do Climate Attribution Studies Tell the Full Story? Excerpts in italics with my bolds and added images, his analysis concluding thusly:

How a cascade of selection effects bias
the collective output of extreme event attribution studies.

Weather and climate extremesโ€”such as high temperatures, floods, droughts, tropical cyclones, extratropical cyclones, and severe thunderstormsโ€”have always threatened both human and natural systems. Given their significant impacts, there is considerable interest in how human-caused climate change influences these extremes. This is the focus of the relatively new discipline of Extreme Event Attribution (EEA).

Over the past couple of decades, there has been an explosion in EEA studies focusing on (or, โ€œtriggered byโ€) some prior notable weather or climate extreme. Non-peer-reviewed reports from World Weather Attribution (e.g., here, here, and here) represent some of the most notable examples of these kinds of analyses, and many similar studies also populate the peer-reviewed literature. The Bulletin of the American Meteorological Societyโ€™s โ€œExplaining Extreme Events From a Climate Perspectiveโ€ annual series compiles such studies, as does the Sabin Center for Climate Change Law, and they are also synthesized in reports like those from the IPCC (IPCC WG1 AR6 Chapter 11.2.3) and the United States National Climate Assessment.

The collective output of these kinds of studies certainly gives the impression that human-caused climate change is drastically changing the frequency and intensity of all kinds of weather extremes. Indeed, Carbon Brief recently published an extensive summary of the science of EEA studies, which begins with the proclamation, โ€œAs global temperatures rise, extreme weather events are becoming more intense and more frequent all around the world.โ€

However, these numbers cannot be taken as an accurate quantification of the influence of climate change on extreme weather because they are heavily influenced by a cascade of selection biases originating from the physical climate system, as well as researcher and media incentives. Identifying and understanding these biases is a prerequisite for properly interpreting the collective output of EEA studies and, thus, what implications they hold for general scientific understanding, as well as political and legal questions.

The large apparent discrepancy between the size of the influence of human-caused climate change on extreme weather reported in EEA studies (like those compiled by Carbon Brief) compared to more comprehensive systematic analyses (like those compiled by the IPCC) can, in large part, be attributed to the many layers of Selection Biases that influence the EEA literatureโ€™s collective output.

Selection Bias is a broad term that refers to any bias that arises from a process that selects data for analysis in a way that fails to ensure that data is representative of the broader population that the study wishes to describe.

Selection biases in the context of EEA studies include those associated with the physical climate system itself, those concerning proclivities and incentives facing researchers/journals, and those concerning the proclivities and incentives facing the media. They include

Occurrence Bias is a bias introduced by the physical climate system. Since EEA studies tend to be triggered by extreme events that have actually occurred, there is reason to believe that these studies will disproportionately sample events that are more likely than average to be exacerbated by climate change because the events occurred in the first place. Essentially, extreme events that are more likely to occur under climate changeโ€”and thus more likely to be observedโ€”are going to be overrepresented in EEA studies, and extreme events that are less likely to occur under climate changeโ€”and thus less likely to be observedโ€”are going to be underrepresented in EEA studies.

The map below illustrates this phenomenon. It shows changes in the magnitude of extreme drought under climate change. Specifically, it shows the fractional change in the intensity of once-per-50-year droughts (as quantified by monthly soil moisture) between a preindustrial and 21st-century run (SSP2-4.5 emissions) of the highly-regarded NCAR CESM2 Climate Model. Blue areas represent locations where the model simulates that extreme droughts become less frequent and intense with enhanced greenhouse gas concentrations, and red areas represent locations where the model simulates that extreme droughts become more frequent and intense with enhanced greenhouse gas concentrations. It is notable that overall, this model simulates that warming decreases the frequency and intensity of extreme drought in more locations than it increases it (consistent with soil moistening under warming simulated by other models).

Now, hereโ€™s the kicker: The black dots show locations where once-per-50-year droughts actually occurred in the 21st-century simulation and thus represent events that would plausibly trigger EEA studies.

What do you notice about where the dots are compared to where the red is? Thatโ€™s right; the simulated EEA studies overwhelmingly sample areas where droughts are getting more intense and more frequent by the very nature that those are the types of droughts that are more likely to occur in the warming climate. The result is that the EEA sample is majorly biased: warming decreased the intensity of once-per-50-year droughts by about 1% overall, but it increased their intensity within the EEA sample by 18%!

Thus, if you just relied on the EEA sample, you would come away with an
incorrect impression not only on the magnitude of change in extreme droughts
but also on the sign of the direction of change!

Choice Biasย arisesย when researchers use prior knowledge to choose events for EEA studiesย that are more likely to have been made more severe by climate change. A clearย example of Choice Biasย pervading theย Carbon Brief databaseย is there have beenย 3.6 times more studies on extreme heat than there have been on extreme winter weatherย (205 vs. 57).ย Another exampleย would be theย dearth of EEA studies on extratropical cyclonesย (the kinds of low-pressure systems with cold and warm fronts that are responsible for most of the dramatic weather outside of the tropics). The IPCCย states thatย the number of extratropical cyclones associated with intense surface wind speeds is expected to decrease strongly in the Northern Hemisphere with warming. Yet, it is relatively rare for EEA attribution studies to be done on these types of systems, whichย results in an exclusion of this good news from the EEA literature.

Publication Biasย could be playing a role, too, whereย researchers are more likely to submit, and journals areย likely to publishย studies that report significant effectsย on salient eventsย compared to studies that find null effects.

From Clark et al., 2023

Finally, theย climate reporting mediaย ecosystem is characterized by actorsย whoseย explicit mission is to raise awareness of the negative impacts of climate change,ย and thus, there will be a naturalย Media Coverage Biasย with a tendency to selectively highlight EEA studies where climate change is found to be a larger driver than EEA studies that do not reach such a conclusion. These selection biases are apparent at the aggregate level, but there is also strong evidence of their presence in individual studies.

A moreย recent specific exampleย suggestive of many of these dynamics is a study,ย Gilford et al. (2024), titledย โ€œHuman-caused Ocean warming has intensified recent hurricanesโ€.ย This study was conducted by three researchers atย Climate Central, which summarizes the studyโ€™s findings with the following infographic:

From Climate Central press release on Gilford et al. (2024).

Essentially, they claim that climate change is enhancing the intensity of all hurricanes and that the enhancement is quite large: Storms today are calculated to be an entire Category stronger than they would have been in a preindustrial climate.

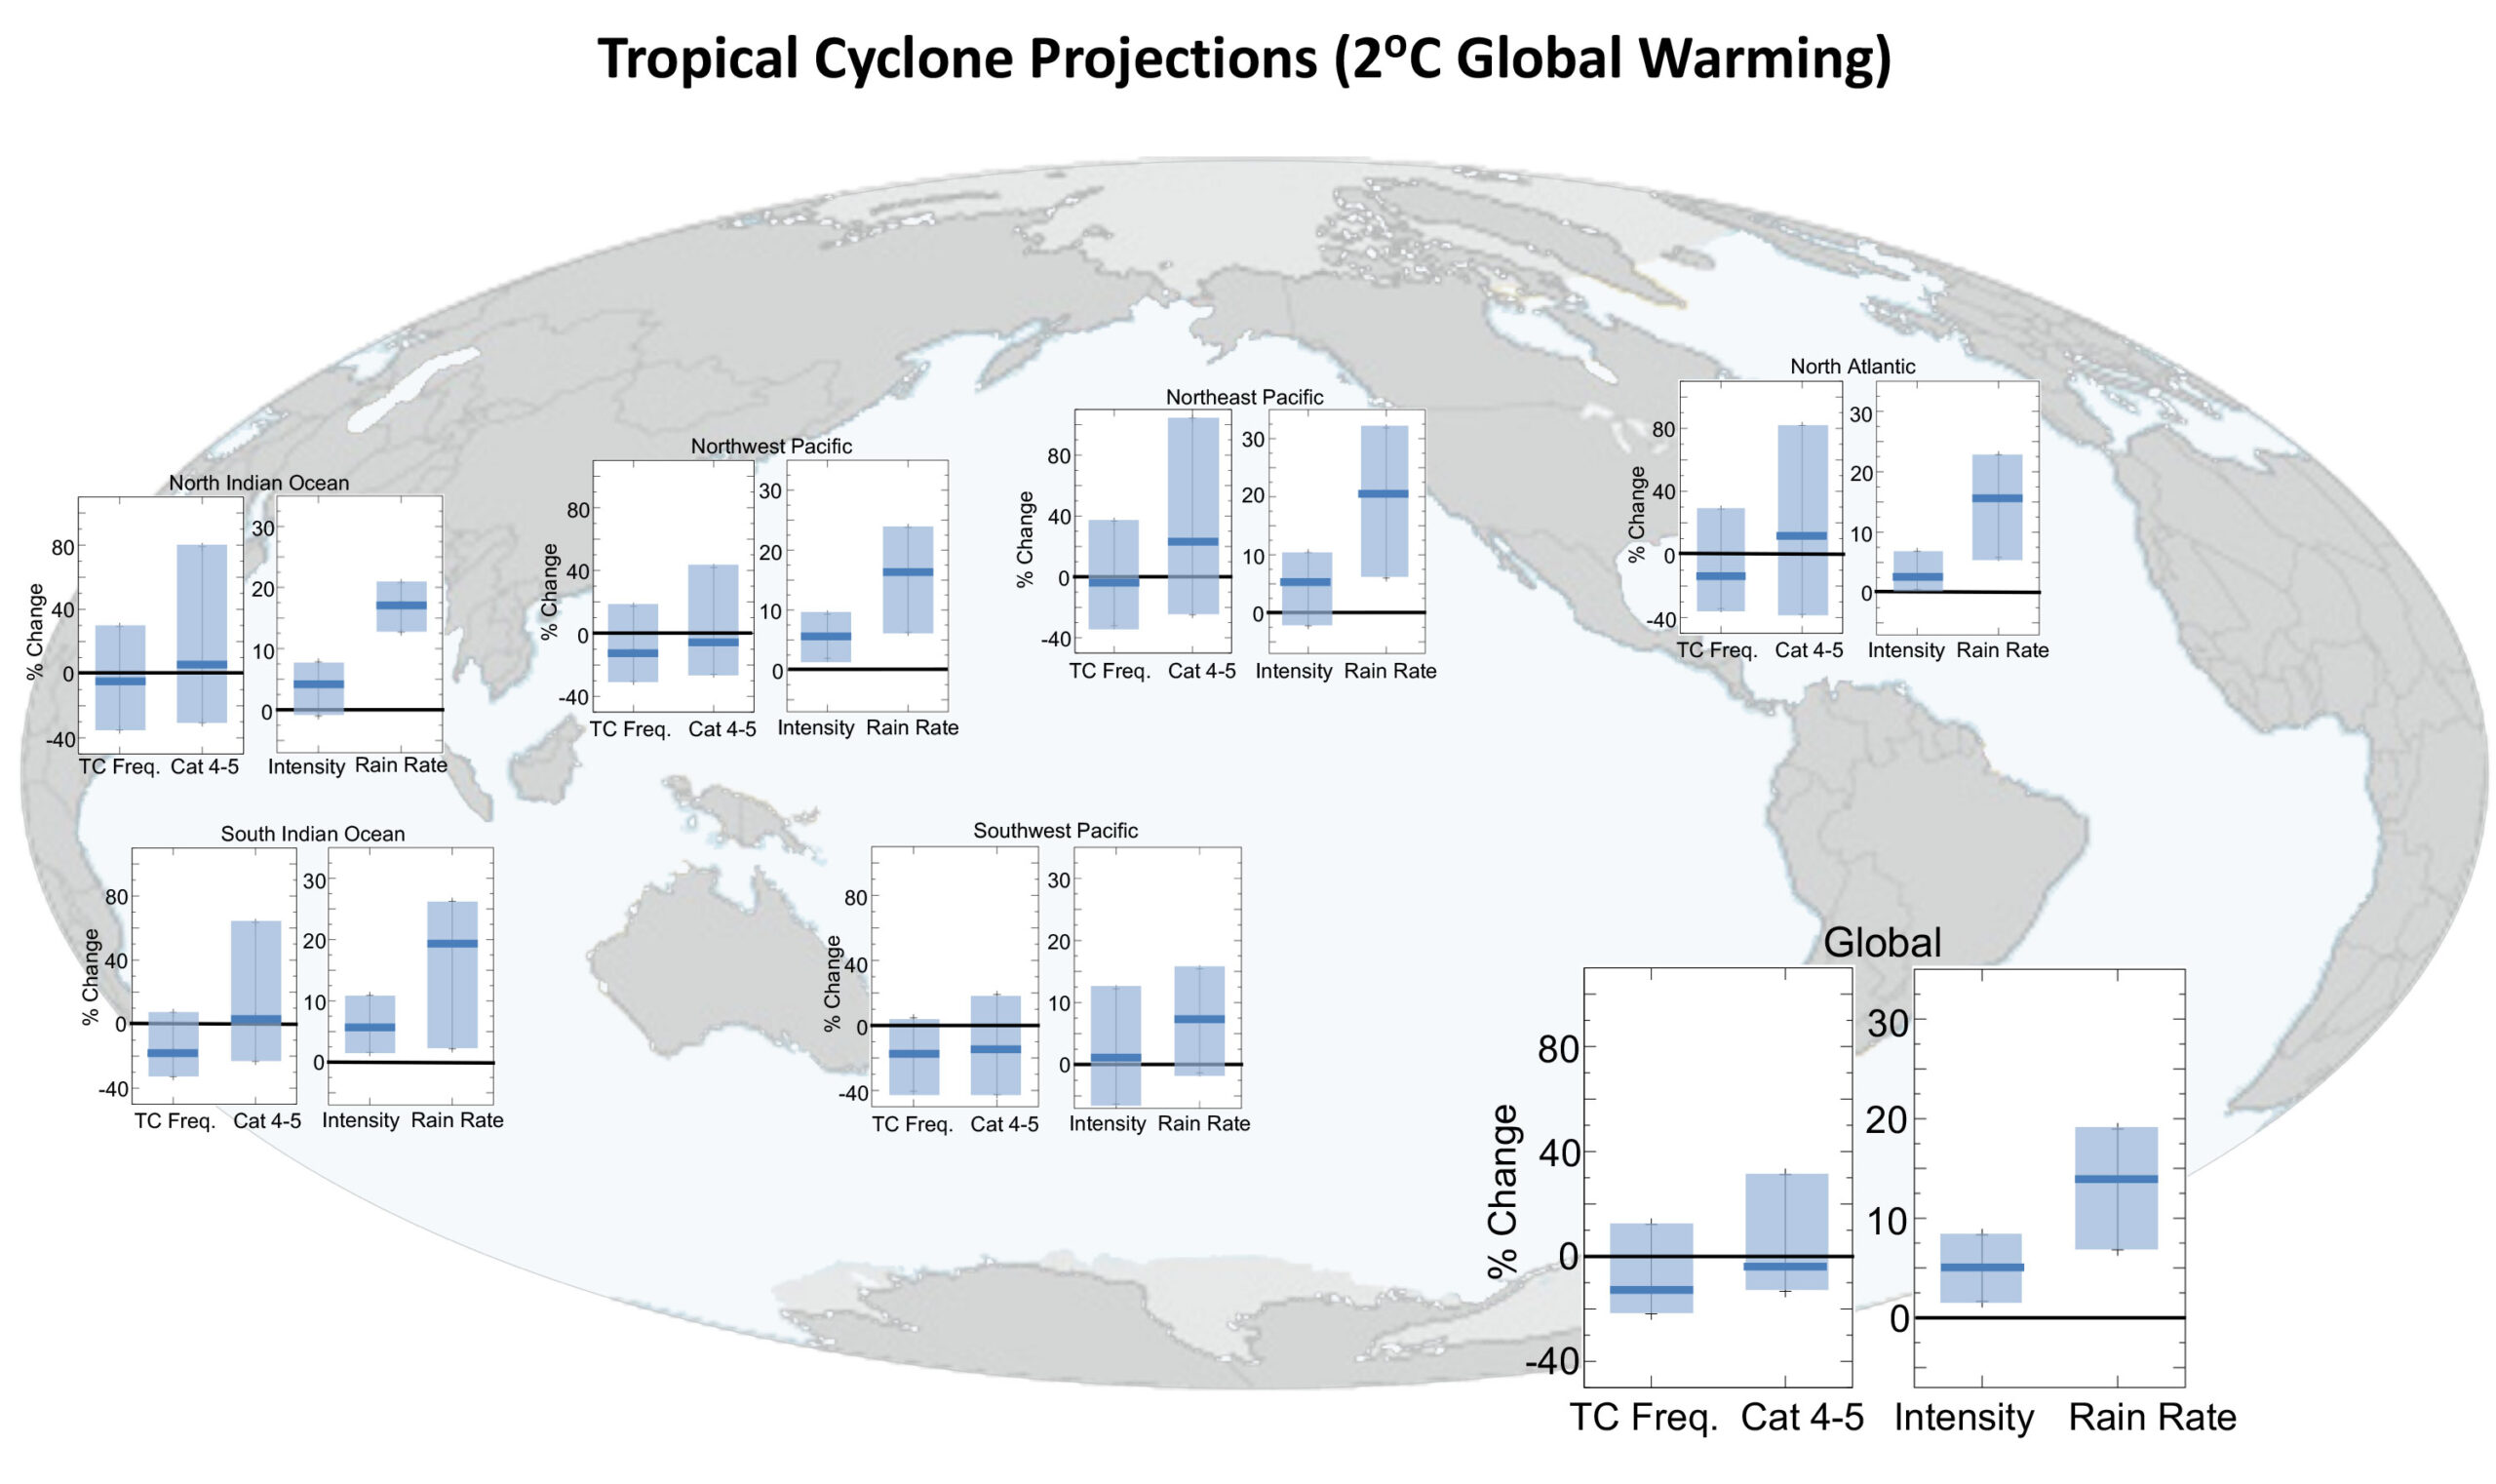
This is a huge effect, and thus, if it were real, it is reasonable to expect to see clear long-term trends in metrics of tropical cyclone (hurricane) intensity like the accumulated number of major (Category 3+) hurricane days or the accumulated cyclone energy from all tropical cyclones (which is proportional to the square of hurricane windspeed accumulated over their lifetimes). However, any long-term trends in such metrics are subtle at best, both globally and over the North Atlantic.

From Colorado State University Department of Atmospheric Science Tropical Meteorology Project.

So, this is a microcosm of the aforementioned apparent discrepancy between more broad quantifications of changes in extremes and their associated EEA counterparts, and again, Iโ€™d argue there areย several selection biases at play affecting the production and dissemination of the EEA study.

Letโ€™s start with Choice Bias on methodology. Human-caused warming changes the environment in some ways that work to enhance hurricanes and in other ways that diminish them. The main way that hurricanes are enhanced is via the increase in sea surface temperatures (which provides the fundamental fuel for hurricanes), and the main way that hurricanes are diminished is via changes in atmospheric wind shear and humidity.

The net result of these countervailing factors pulling in opposite directions is that we expect fewer hurricanes overall, but when hurricanes are able to form, they can be stronger than they would otherwise. These factors, though, are small relative to natural random variability, and thus, they are difficult to detect in observations.

However, the Climate Central researchers made the methodological choice
to largely exclude the influence of factors that diminish
hurricane development from the study.

Are these Choice Biases in event type and methodology an accident? There are many reasons to believe they are not.

The research paper itself spells out that the motivation of the study is to โ€œconnect the dotsโ€ between climate change and hurricanes because โ€œlandfalling hurricanes with high intensitiesโ€”can act as โ€˜focusing eventsโ€™ that draw public attentionโ€ and that โ€œIncreased attention during and in wake of storms creates opportunities for public and private discourse around climate and disaster preparedness.โ€

Then, there is the extensive media coverage of this study. It was picked up by 134 news outlets and ranked in the 99.95th percentile of research articles (across all journals) of similar age in terms of online attention. Further, it was immediately incorporated into seven Wikipedia articles (likely having high leverage on AI queries, which would make its findings indistinguishable from scientific โ€œfactโ€). This is affected by the aforementioned Media Coverage Bias, but it is also undoubtedly directly influenced by the efforts of Climate Central, which is explicitly an advocacy organization whose self-described specialty is media placement and dissemination.

The above sheds light on the reasons for certain choice biases in a particular study, but there is plenty of evidence that these selection biases are pervasive in the EEA field. After all, Dr. Myles Allen essentially founded the field with the motivation of answering the question, โ€œWill it ever be possible to sue anyone for damaging the climate?โ€. This same motivation seems to animate many of the most high-profile scientists in the field today, like Allenโ€™s protege, Dr. Friederike Otto (co-founder and leader of World Weather Attribution). She and her organization are frequently cited as bringing the necessary intellectual authority to credibly sue fossil fuel companies. She states the motivation of her work explicitly:

โ€œAttributing extreme weather events to climate change, as I do
through my work as a climatologist, means we can hold
countries and companies to account for their inaction.โ€

Given the explicitly stated motivation of those in the EEA field, it is quite reasonable to suppose that there are major selection biases at play, and thus, it is not at all surprising that the collective output of the EEA field would look so different from more broad comprehensive assessments.

Trump Dumps the Paris Agreement: Is it a Big Deal?

According to the UKโ€™sย Telegraph,ย just hours after President Trump issued executive orders to withdraw the US from the Paris climate agreement, Ed Miliband, the British Secretary of State for Energy Security and Net Zero, โ€œwarnedโ€ Mr Trump that the rise of Net Zero is โ€œunstoppableโ€. The tendentiousness of theย Telegraphโ€™s headline is remarkable. Just who is this mere Department Secretary to โ€œwarnโ€ the Chief Executive of the worldโ€™s leading economic and military power of anything?

From The Daily Sceptic

Byย Tilak Doshi

According to the UKโ€™s Telegraph, just hours after President Trump issued executive orders to withdraw the US from the Paris climate agreement, Ed Miliband, the British Secretary of State for Energy Security and Net Zero, โ€œwarnedโ€ Mr Trump that the rise of Net Zero is โ€œunstoppableโ€. The tendentiousness of the Telegraphโ€™s headline is remarkable. Just who is this mere Department Secretary to โ€œwarnโ€ the Chief Executive of the worldโ€™s leading economic and military power of anything?

Evidently, the British Secretary is deluded enough to take up the mantle of responsibility to warn President Trump of ignorance in energy affairs. But Mr Miliband has company, ranging from leading academics to senior global leaders conferring at last weekโ€™s World Economic Forum in Davos. Rather than simply dismissing his antics as another sign of Mad Edโ€™s silly climate posturing, it behoves us to take his warning at face value.

Is the US withdrawal from the Paris climate agreement really such a big deal?

No Big Dealโ€ฆ

Appearing before the House of Lords Environment and Climate Change Committee a day after President Trumpโ€™s inauguration, Mr Miliband sought to downplay the impact of Americaโ€™s planned withdrawal from the international climate treaty which Mr. Trump had announced on the same day.

He said

Other countries believed it was in their national self-interest to remain in the Paris Agreement and to continue working on these (climate) issues, because they saw both the advantages of moving forward on this and the dangers for them of not moving forward. So I think the transition is unstoppable, not fast enough, but unstoppable.

Presumably, M. Miliband was referring to Mr Trumpโ€™s previous withdrawal from the Paris agreement during his first term in office from January 2017, a move which was promptly reversed by President Joe Biden in January 2021. President Bidenโ€™s administration reversed almost every energy initiative of the previous administration. It sought to portray the first exit from the Paris agreement โ€“ and Mr Trumpโ€™s first-term Presidency โ€“ as an aberration from the liberal-progressive โ€˜arc of historyโ€™. After all, as it was widely claimed by the Democrat establishment and its media shills, wasnโ€™t the Trump win in 2016 only made possible by Russian collusion?

In 2017, when Mr Trump first gave notice of withdrawal from the Paris agreement, a statutory delay of four years from the date of the agreement coming into force in November 2016 applied. In effect, the US was out of the agreement for only a few months before Trumpโ€™s first term Presidency expired. This time around, the statutory delay is one year. Thus from 2026 onwards, at least to the end of Mr Trumpโ€™s second term, the US will be not participate in any of the Paris agreement commitments including any financial obligations.

The US thus remained a party to the Paris agreement for almost the entirety of President Trumpโ€™s first term, during which its administrative staff continued participating in programmes and initiatives that were pursued under the Obama Presidency. The US State Department continued to participate in the ongoing negotiations, including co-chairing with China the Enhanced Transparency Framework.

At the COP29 UN annual climate summit held in Baku, Azerbaijan, in the shadow of Trumpโ€™s triumphant election win, Mr John Podesta โ€“ President Bidenโ€™s Climate Envoy โ€“ had no hesitation in telling governments around the world to โ€œkeep faithโ€ in their efforts to โ€œcombat global warmingโ€. He confidently asserted that the Trump Presidency could only slow, not stop, the transition from fossil fuels:

For those of us dedicated to climate action, last weekโ€™s outcome in the United States is obviously bitterly disappointing. โ€ฆ But what I want to tell you today is that while the United States federal Government, under Donald Trump, may put climate action on the back burner, the work to contain climate change is going to continue in the United States.

Gina McCarthy, President Obamaโ€™s Administrator of the Environmental Protection Agency (EPA) and later the White House Climate Adviser for President Biden, accused the Trump administration of having โ€œabdicated its responsibility to protect the American people and our national securityโ€ by leaving the Paris Agreement. Now representing an environmental NGO, Ms McCarthy assured her audience that โ€œour states, cities, businesses and local institutions stand ready to pick up the baton of US climate leadership and do all they can โ€” despite federal complacency โ€” to continue the shift to a clean energy economyโ€.

The belief that the global climate agenda signified by the Paris agreement is undiminished despite the re-election of Donald Trump is not restricted to US Democrat and environmental NGO activists. At last weekโ€™s World Economic Forum in Davos, European Commission President Ursula von der Leyen said:

The coming years will be vital well beyond Europe. All continents will have to speed up the transition towards Net Zero and deal with the growing burden of climate change. โ€ฆThe Paris Agreement continues to be the best hope for all humanity. So Europe will stay the course and keep working with all nations that want to protect nature and stop global warming.

โ€ฆBut Trumpโ€™s Second Shot Makes It a Big Deal

President Trumpโ€™s second term is unlikely to repeat the mistakes of his first one. He has taken a sledgehammer approach to replacing Democrat activists in Government with staff more inclined to his โ€˜MAGAโ€™ vision. President Trump has long said he believes the biggest mistake he made during his first term was hiring people disloyal to his campaign promises.

Harvard Universityโ€™s Robert Stavins โ€“ a leading academic who has done decades of research and published extensively on international climate negotiations โ€“ seems to find it disappointing that โ€œTrump now seems determined to purge the upper ranks for the executive branch of anyone other than loyalistsโ€. As if an incoming President would seek to hire disloyal staff!

Few would disagree with White House spokesman Steven Cheung, who said that: โ€œNo one should be surprised that those being hired should align with the mission of the administration. Nobody in private industry would ever hire someone who isnโ€™t mission focused, and the Government should be no different.โ€ Brian McCormack, Chief of Staff to National Security Adviser Mike Waltz, finds President Trumpโ€™s hiring decisions similarly unexceptional: โ€œEvery President is entitled to have a staff and the advisers that he needs to implement the goals that the American people elected him to pursue.โ€

President Trumpโ€™s detractors have suggested that despite his pulling the US out of the Paris agreement, it will matter little to the global climate agenda. The โ€˜show must go onโ€™ and true believers will step in to the breach. Thus, last weekโ€™s Reuters headline about billionaire climate warrior Michael Bloomberg who โ€œsteps in to help fund UN climate body after Trump withdrawalโ€.

Climate alarmists Ed Miliband, Ursula von der Leyen, Gina McCarthy and Michael Bloomberg share an underlying presumption that the energy transition away from fossil fuels to the brave new world of renewable energy and โ€˜clean techโ€™ is made inevitable because โ€˜markets demand itโ€™ and technological change has made it possible. In the great moral crusade to โ€˜save the planetโ€™, they share the fatal conceit that what they want is what the world needs.

Yet, Trumpโ€™s second term takes place in a vastly changed world from his first. The rise of populist parties in Austria, Italy, the Netherlands, Hungary, Poland, France, Germany and the UK โ€“ dismissed as the โ€˜far Rightโ€˜ by the mainstream media โ€“ in a Europe stricken with deindustrialisation and recession has fundamentally altered the policy presumptions that held sway just a few years ago. Ms Von der Leyenโ€™s own party, a constituent of the European Parliamentโ€™s EPP which is the EUโ€™s most influential political group, is now recommending a freeze of the CO2 duty, abolishing renewable energy targets and reverting to pre-2019 โ€˜green waveโ€™ policies.

If Brussels is looking shaky in its anti-Trump predilections, the world of international business seems to have collapsed like a house of cards in its previous trumpeting of the ESG agenda. The ESG movement, a crucial pillar in the business sectorโ€™s buy-in of the Paris agreement, has had a series of reversals recently.

The Net Zero Asset Managers initiative and Climate Action 100+, which pushed ESG goals and decarbonisation of the American economy, suffered a flurry of high-profile exits by companies such as BlackRock, the worldโ€™s largest asset management company. โ€œMore than 70 companies have left woke ESG organisations like NZAM and Climate Action 100+ since the Committeeโ€™s investigation started,โ€ Republican Jim Jordan told the Daily Wire.

The Net Zero Banking Alliance (NZBA) was established in April 2021 under the auspices of the United Nations and its champion Mark Carney, the โ€˜rock star central bankerโ€˜. It was dedicated to helping lenders reduce their carbon footprints. The group has been abandoned in quick succession by Goldman Sachs Group Inc., Wells Fargo & Co., Citigroup Inc., Bank of America Corp. and Morgan Stanley.

The ESG colossus, which seemed to have reigned supreme in business boardrooms the world over in the past decade, has now been irretrievably compromised. The adage โ€˜go woke, go brokeโ€˜ was right on target.

Markets and Technology Will Not Drive the Energy Transition

No, the markets do not drive the so-called energy transition and technological change obeys the laws of physics and economics. For instance, in the transportation sector, neither markets nor technology has made electric vehicles affordable or popular. Within hours of being sworn into the White House, President Donald Trump signed an executive order meant to end policies supporting EVs. In his inauguration speech, Mr Trump said: โ€œWe will revoke the electric vehicle mandate, saving our auto industry and keeping my sacred pledge to our great American autoworkers. โ€ฆ In other words, youโ€™ll be able to buy the car of your choice.โ€

President Trump has not only given Americans their freedom to buy cars of their choice, a very big deal in that country. He has also eased bureaucrat-imposed efficiency standards for dishwashers, showerheads, refrigerators, laundry machines, toilets, gas cookers, incandescent lights and the like. Mr Trump, in short, has rescued the American consumer from the dead hand of an impoverishing green ideology that yields ultimate power to an efficiency technocracy.

These measures are part of President Trumpโ€™s flurry of executive orders which remove regulatory obstacles to the rapid development of fossil fuel resources and all associated infrastructure while seeking to prevent wind farms from being built on federal lands and waters.

President Trumpโ€™s executive order for the US to exit the Paris agreement is a huge deal, not least in saving the nation hundreds of millions of dollars which would have been spent on climate boondoggles such as President Bidenโ€™s euphemistically termedย Inflation Reduction Actย andย vast transfersย in climate funds pledged to developing countries. Let not the naysayers say otherwise.

Dr Tilak K. Doshi is an economist, a member of the CO2 Coalition and a former contributor to Forbes. Follow him on Substack and X.

Another Ocean Warming Scare: Bad Models, Bad Data, and a Clear Agenda

Another day, another climate โ€œcrisisโ€ declared by scientists who seem more interested in pushing policy than in practicing rigorous, unbiased science. The latest entry in this parade of alarmism comes from Merchant et al., who claim to have proven that sea surface temperature (SST) is accelerating at an alarming rate due to Earthโ€™s Energy Imbalance (EEI). Their solution? The usualโ€”immediate and severe reductions in fossil fuel use. But before we surrender modern civilization to the dictates of climate activists, letโ€™s take a closer look at this paper and see if its conclusions hold up.

SONY DSC

From Watts Up With That?

By Charles Rotter

https://www.reading.ac.uk/news/2025/Research-News/Ocean-surface-warming-four-times-faster-now-than-late-1980s

Abstract

Global mean sea surface temperature (GMSST) is a fundamental diagnostic of ongoing climate change, yet there is incomplete understanding of multi-decadal changes in warming rate and year-to-year variability. Exploiting satellite observations since 1985 and a statistical model incorporating drivers of variability and change, we identify an increasing rate of rise in GMSST. This accelerating ocean surface warming is physically linked to an upward trend in Earthโ€™s energy imbalance (EEI). We quantify that GMSST has increased by 0.54ย ยฑย 0.07 K for each GJ mโ€“2ย of accumulated energy, equivalent to 0.17 ยฑ 0.02 K decadeโ€’1ย (W mโ€’2) โ€’1. Using the statistical model to isolate the trend from interannual variability, the underlying rate of change of GMSST rises in proportion with Earthโ€™s energy accumulation from 0.06 K decadeโ€“1ย during 1985โ€“89 to 0.27 K decadeโ€“1ย for 2019โ€“23. While variability associated with the El Niรฑo Southern Oscillation triggered the exceptionally high GMSSTs of 2023 and early 2024, 44% (90% confidence interval: 35%โ€“52%) of the +0.22 K difference in GMSST between the peak of the 2023/24 event and that of the 2015/16 event is unexplained unless the acceleration of the GMSST trend is accounted for. Applying indicative future scenarios of EEI based on recent trends, GMSST increases are likely to be faster than would be expected from linear extrapolation of the past four decades. Our results provide observational evidence that the GMSST increase inferred over the past 40 years will likely be exceeded within the next 20 years. Policy makers and wider society should be aware that the rate of global warming over recent decades is a poor guide to the faster change that is likely over the decades to come, underscoring the urgency of deep reductions in fossil-fuel burning.

https://iopscience.iop.org/article/10.1088/1748-9326/adaa8a

Of course, the news stories were all teed up ready to publish the moment the embargo was lifted.

Ocean-surface warming four times faster now than late-1980s

Ocean temperature rise accelerating as greenhouse gas levels keep rising

The surface of our oceans is now warming four times faster than it was in the late 1980s

Another day, another climate โ€œcrisisโ€ declared by scientists who seem more interested in pushing policy than in practicing rigorous, unbiased science. The latest entry in this parade of alarmism comes from Merchant et al., who claim to have proven that sea surface temperature (SST) is accelerating at an alarming rate due to Earthโ€™s Energy Imbalance (EEI). Their solution? The usualโ€”immediate and severe reductions in fossil fuel use. But before we surrender modern civilization to the dictates of climate activists, letโ€™s take a closer look at this paper and see if its conclusions hold up.

Spoiler: They donโ€™t.

The House of Cards Built on Uncertain Data

The foundation of Merchant et al.โ€™s argument is that Earthโ€™s oceans are warming faster than before, and this acceleration is due to a growing energy imbalance. The problem? The data they use to reach this conclusion is riddled with uncertainty.

They rely heavily on satellite observations to measure EEI, the supposed imbalance between incoming solar radiation and outgoing heat. However, they openly admit that the absolute accuracy of these measurements is not precise enough to detect imbalances as small as ~1 W/mยฒ with confidence. In other words, they are trying to measure a trend that is smaller than the margin of error in the instruments they use. That alone should be enough to dismiss this study.

But it gets worse.

Because the data is unreliable, they supplement it with โ€œreconstructedโ€ EEI estimates before 2000 using a mix of proxy data and modeling. This means that nearly half their dataset is not even direct observationโ€”itโ€™s modeled guesswork. And yet, they use it to claim they can measure multi-decadal acceleration trends with certainty.

Acceleration? Or a Statistical Magic Trick?

If you go looking for acceleration, youโ€™ll probably find itโ€”especially if you design your statistical model to guarantee that outcome. Thatโ€™s exactly what Merchant et al. have done.

They test three models to explain sea surface temperature trends:

  1. Linear warming modelย โ€“ Predicts a steady, slow warming trend.
  2. Quadratic modelย โ€“ Assumes an accelerating trend.
  3. EEI-driven modelย โ€“ Uses their highly uncertain EEI data to โ€œexplainโ€ why warming is accelerating.

Unsurprisingly, they find that the model assuming acceleration fits best, which is exactly what they wanted to prove in the first place. This is not scienceโ€”itโ€™s circular reasoning disguised as research.

What they donโ€™t do is consider alternative explanations for the changes in sea surface temperature. Natural ocean cycles like the Pacific Decadal Oscillation (PDO) and Atlantic Multidecadal Oscillation (AMO) can drive temperature fluctuations on multi-decadal timescales. These are well-documented, yet Merchant et al. ignore them entirely, preferring to attribute every fraction of a degree increase to human emissions.

Exaggerating Future Warming for Maximum Alarm

The authors then take their dubious acceleration trend and extrapolate it forward to claim that future ocean warming will far exceed previous estimates. They construct three scenarios:

  1. On-trendย โ€“ EEI continues rising, leading to catastrophic warming.
  2. Moderateย โ€“ Warming still accelerates but not as fast.
  3. Mitigatedย โ€“ Even with severe emissions cuts, warming will still accelerate.

This is nothing but a glorified version of the climate doomsday scenario playbookโ€”start with a model that assumes acceleration, plug in arbitrary assumptions about future emissions, and produce worst-case predictions that just happen to align perfectly with the climate policy agenda.

Ignoring Uncomfortable Contradictions

The study claims that EEI has been rising since around 2010 and that this is driving SST acceleration. But even they acknowledge that anthropogenic aerosol reductions (i.e., cleaner air) could be responsible for part of the observed trend. If less pollution is allowing more sunlight to reach the ocean, wouldnโ€™t that mean past warming was suppressed by pollution, rather than proving COโ‚‚-driven warming is out of control?

And if thatโ€™s true, wouldnโ€™t this mean that climate models have been overestimating the role of COโ‚‚ all along? Merchant et al. conveniently ignore these contradictions because they donโ€™t support their acceleration narrative.

The Real Purpose of This Study: Climate Policy, Not Science

The biggest red flag in this paper is the authorsโ€™ final conclusion:

โ€œPolicy makers and wider society should be aware that the rate of global warming over recent decades is a poor guide to the faster change that is likely over the decades to come, underscoring the urgency of deep reductions in fossil-fuel burning.โ€

Notice how they jump from a scientific claim to a policy demand without hesitation? This is the true goal of the paper: to manufacture an urgent climate crisis that justifies drastic intervention.

No mention of alternative explanations for the observed warming.
No discussion of uncertainties in their methods.
No consideration of the costs or consequences of their proposed policies.

Just a predetermined conclusion wrapped in the appearance of scientific rigor.

Final Verdict: Junk Science in Service of Activism

This paper is not an objective scientific analysisโ€”it is an advocacy document masquerading as research. It relies on uncertain data, manipulates statistical models to reinforce a preferred narrative, and exaggerates future warming to scare policymakers into action.

The truth is, given the uncertainties involved, nothing we are seeing is cause for concern. The climate has always fluctuated, and minor changes in sea surface temperature are entirely within natural variability. The only thing accelerating here is the desperation of climate activists to keep their funding and political influence intact.

The next time you see a breathless headline aboutย โ€œaccelerating ocean warmingโ€, rememberย bad models, biased assumptions, and agenda-driven science are the real drivers behind these claimsโ€”not reality.

Mace Headโ€™s โ€œRecord Windโ€ Claims Only Based on 22 Yearsย Data

You will of course remember the claims last week that Eowyn had set a new wind speed record in Ireland.

Leaving aside the fact that Kilkeel in N Ireland has the official record of 124 mph in 1974, I wondered just how far back Met Eireannโ€™s records went for Mace Head.

From NOT A LOT OF PEOPLE KNOW THAT

By Paul Homewood

You will of course remember the claims last week that Eowyn had set a new wind speed record in Ireland.

Leaving aside the fact that Kilkeel in N Ireland has the official record of 124 mph in 1974, I wondered just how far back Met Eireannโ€™s records went for Mace Head.

So I asked them, and have just received this reply:

Thank you for your email.

The AWS at Mace Head was installed in 2003 and has been measuring wind at that location since 2003.

You can get all past hourly, daily and monthly datasets for Mace Head on the Met ร‰ireann historical data webpage here:ย 

https://www.met.ie/climate/available-data/historical-data

Even by our own Met Officeโ€™s practices, this takes the biscuit.

How can they declare a record at a site that has only been in use for 22 years? No reputable organisation would do this. It has no more legitimacy than the Kilkeel in N Ireland declaring record winds on The Needles, which began recording wind speeds in 1996.

Mace Head, which has been measuring temperatures for 50 years, is in one of the most exposed locations on the west coast of Ireland. So much so that Irelandโ€™s Weather Channel predicted it would set a record the day before the storm.

It will always be top of the list, or close to it, when gales hit that part of the coast.

So Met Eireann have no idea whether winds higher than 114 mph have hit Mace Head before 2003 โ€“ say in 1945 or 1961, when the previous record of 113 mph was set.

To declare a record with such a short set of data devalues the process. All they can legitimately claim is that it was the strongest gust since 2003.

The 2024 Hurricaneย Season

The Global Warming Policy Foundation (GWPF) has today published its periodic review of global hurricane activity. The review is based on the findings of key scientific bodies, comparing them to sensationalist news reporting and popular perceptions.

From NOT A LOT OF PEOPLE KNOW THAT

By Paul Homewood

The 2024 Hurricane Season

Paul Homewood

London, 28 January โ€“ The Global Warming Policy Foundation (GWPF) has today published its periodic review of global hurricane activity. The review is based on the findings of key scientific bodies, comparing them to sensationalist news reporting and popular perceptions.

  • Trends in landfalling Atlantic/western Pacific hurricanes have been stable or decreasing since 1950.
  • There is also no global trend in overall hurricane frequency since reliable records began in the 1970s.
  • The apparent increase in the number of hurricanes since the 19th century has been due to changes in observation practices over the years, rather than an actual increase.
  • Data show no long-term trends in US landfalling hurricanes since the mid-19th century, when systematic records began, either in terms of frequency or intensity.
  • Similarly, after allowing for the fact that many storms were not spotted prior to the satellite era, there are no such trends in Atlantic hurricanes either.
  • There is growing evidence that wind speeds of the most powerful hurricanes may now be overestimated in comparison to pre-satellite era ones, because of changing methods of measurement.
  • The increase in Atlantic hurricanes in the last fifty years is not part of a long-term trend but is linked to a recovery from a deep minimum in hurricane activity in the 1970s, associated with the Atlantic Multidecadal Oscillation.

The author, climate researcher Paul Homewood, said:

โ€œThe observational findings of meteorological agencies in 2024 once again confound those who claim to see a โ€˜climate crisisโ€™ in the hurricane data. It is clear that we have not seen an increase in hurricane frequency, even though the public have been scared into thinking that tropical storms are getting worse.โ€

GWPF Director, Dr Benny Peiser, said:

โ€œThe gap between media hype, popular perceptions and the reality of empirical data is becoming ever more evident. This report sets out the facts and is a welcome corrective to misleading news coverage of hurricanes.โ€
Read the full paper here: The 2024 Hurricane Season (pdf)

Donโ€™t mention Climate Science, said Melania to the President

In his inauguration speech, on becoming the 47th President of the United States, Donald Trump stated very categorically that there are only two genders: male and female. In making this statement, he seemed to have no problems offending the transgender community.

From Jennifer Marohasy

Byย jenniferย 

In his inauguration speech, on becoming the 47th President of the United States, Donald Trump stated very categorically that there are only two genders: male and female.   In making this statement, he seemed to have no problems offending the transgender community.

Trump made no such bold, or counter cultural pronouncements about climate change.  He avoided the issue while at the same time announcing an energy emergency. He used the word โ€˜energyโ€™ three times โ€“ energy prices, energy emergency and American energy โ€“ but he did not mention โ€˜climateโ€™, not once in his inaugural address.    He didnโ€™t mention the word โ€˜environmentโ€™ either.

Of course, the energy emergency โ€“ assuming it does indeed exist โ€“ is a consequence of concerns about climate change and the environment.  The Paris Agreement, which the President subsequently announced he would be withdrawing the United States from, has as its main goal keeping global temperatures below 1.5 degrees Celsius (2.7 degrees Fahrenheit) specifically by dramatically reducing the use of coal, oil and gas.   It is ostensibly about saving the environment โ€“ something never mentioned in Trumpโ€™s inaugural address.

While claiming an energy emergency, in the first week of his presidency Trump also announced he will halt the leasing of federal waters for offshore wind farms.   He wants to solve the energy crisis, not with American wind, but with American oil and gas.

Trump specifically said:

The inflation crisis was caused by massive overspending and escalating energy prices, and that is why today I will also declare a national emergency.  We will drill baby, drill.

America will be a manufacturing nation once again, and we have something that no other manufacturing nation will ever have โ€” the largest amount of oil and gas of any country on earth โ€” and we are going to use it.  Weโ€™ll use it.

We will bring prices down, fill our strategic reserves up again right to the top, and export American energy all over the world.

This puts Trump at odds with the King of England, Charles III, and so many others of the ruling class who have been making a fortune out of the energy transition that, according to Trump, has unsustainably forced up prices.

While Trump wants to contain the spread of wind farms, earnings from King Charlesโ€™s sovereignโ€™s public estate have more than doubled as a direct result of planned new offshore wind farms along the British coastline.

More specifically, profits at the Kingโ€™s property group more than doubled to ยฃ1.1billion in the 12 months to the end of March 2024, up from ยฃ443million in the previous financial year.  Most of the ยฃ658million increase in profits came from the extra fees paid by the developers who won the rights to build six new offshore wind farms โ€” in the North Sea and off the coasts of Cumbria, Lancashire and north Wales.  In total, the in the fourth round of seabed leasing in January 2023 banked just over ยฃ1billion for the Crown Estate.

For sure, the policies of Trump as they relate to energy production do not appear consistent with King Charles III who rules over the Commonwealth including Australia.  But neither Charles nor Donald is commenting on this โ€“ for the moment.

The chatter is that Trump has great respect for the monarch, and that his wife Melania is a pen pal of King Charles, both sharing a concern for the environment and specifically climate change โ€“ that was also not mentioned at the inauguration.

Australian conservatives meanwhile are reaffirming support for the King, with the leader of the Opposition, Peter Dutton, indicating that should he win the election in Australia later this year that Australia will not withdraw from the Paris Agreement.  Indeed, as far as I can tell, here in Australia at least, there is no interest in putting this country, or its people and businesses first when it comes to issues of energy affordability.

The Australian government is absurdly claiming we can continue as a global aluminium powerhouse while transitioning to wind and solar.  Dutton, in opposition, is claiming nuclear, as a fine source of future reliable electricity.  Never mind, that nuclear would likely increase the wholesale electricity prices to the point it was at least twice as expensive as electricity from new and refurbished coal-generating electricity plants but still cheaper than renewables.

Of course, what is missing in all of this is some discussion about the science that underpins the notion there is a climate emergency in the first place, an emergency requiring the energy transition which more than doubled the earning of our King last financial year, while according to the new President of the United States it is unaffordable.

Instead, everyone is being polite and not mentioning it.    A situation that could continue for as long as Melania and the King of England are pen pals โ€“ at least.

***

The feature image/photograph shows wind farms off the coast of Norwich, with Jennifer Marohasy in the foreground back in September 2015.

Record ยฃ2.4 Billion in CfD Subsidies Paid Out in 2024

Hot on the heels of the record payments made under the Feed-in-Tariff scheme in the year to end March 2024, the data is now available for subsidies paid under the Contract for Difference Scheme (CfDs) in calendar year 2024. The data comes from the Low Carbon Contract Company (LCCC). The data is subject to minor revision and the data snapshot for this piece was taken on January 14th, 2025.

From The Daily Sceptic

Byย David Turver

Hot on the heels of the record payments made under the Feed-in-Tariff scheme in the year to end March 2024, the data is now available for subsidies paid under the Contract for Difference Scheme (CfDs) in calendar year 2024. The data comes from the Low Carbon Contract Company (LCCC). The data is subject to minor revision and the data snapshot for this piece was taken on January 14th, 2025.

A record ยฃ2.4 billion was paid out in subsidies across a range of technologies, but the largest recipient was offshore wind. There are some other interesting facts buried in the data that we can now explore.

How Do CfDs Work?

I am often asked how CfDs work, so it is worth giving a brief explanation before diving into the detail of the data. I have pulled Figure 1 below from the Renewable Exchange to illustrate how they work.

Figure 1 โ€“ How CfDs Work

The black line shows the market price (or reference price) of electricity on any given day. The red line is the CfD strike price and reflects how much the generator will get paid for its electricity, regardless of the market value. Note that in reality, as we shall see below, the average strike price for active offshore wind CfDs is over ยฃ150/MWh.

When the black line is below the red line, the generator receives the market price for the electricity generated plus a CfD top-up (subsidy) for the difference. On the rare occasions when the market price is above the strike price, the generator pays back money to the LCCC as illustrated by the blue line, so its net revenue is equal to the strike price.

Full Year Subsidies

Figure 2 shows the full year subsidies since the scheme began in late 2016, broken down by technology type.

Figure 2 โ€“ Total CfD Subsidies by Year and Technology (ยฃ)

As well as 2024 being a record year overall, offshore wind received more subsidy than in any other year with ยฃ1.9 billion paid out. Biomass conversion, a euphemism for burning trees, received ยฃ309 million and biomass with combined heat and power (CHP) received a further ยฃ90 million. Onshore wind received ยฃ73 million and the two solar farms with active CfDs received just over ยฃ1 million.

Incidentally, in December 2024, ยฃ260.3 million was paid out in subsidies, the second highest month on record, with April 2024 being the highest at ยฃ269.8 million.

Supporters of renewables often point out that when the market price of electricity is above the CfD strike price, then generators pay money back. This is true, but that was only significant in 2022 when a net ยฃ346 million was repaid and compares to the net cost of the scheme of ยฃ9.6 billion since inception.

Top-20 Subsidy Days

From the data, it is also possible to work out the Top 20 subsidy days since the scheme began. These are listed in Figure 3 below.

Figure 3 โ€“ Top-20 CfD Subsidy Days Since Inception

The top thirteen CfD subsidy days all occurred in 2024, and a total of 16 days from the same year all appear in the Top-20. The day with the highest subsidy payments was December 22nd, 2024, with over ยฃ20 million paid out in a single day. Offshore wind was the main recipient of this Government mandated largesse on that day, getting over ยฃ18.3 million and biomass receiving over ยฃ1 million.

The record subsidy days in December last year came despite elevated gas prices pushing up the reference price. The annual indexation of CfD strike prices with inflation means that as each year progresses, we are likely to see many more record subsidy days, especially if gas-prices fall back to more normal levels.

Top CfD Subsidy Recipients

We can also see the top recipients of the subsidy largesse. The all-time Top 10 list is shown in Figure 4a below with the Top 10 for 2024 shown in Figure 4b.

Six of the all-time Top-10 recipients are offshore wind farms. Walney has received the most at ยฃ1.76 billion, with Hornsea Project 1 coming in second at ยฃ1.67 billion. In third place is Drax that has been paid ยฃ1.6 billion in subsidy for burning trees. Note Drax also has another plant that is funded by Renewables Obligation Certificates, so this is only part of the story. The other offshore wind farms in the Top-10 are Dudgeon, Beatrice, Burbo Bank and East Anglia One. Lynemouth and Teesside Biomass plants also make the Top-10 along with the Dorenell onshore windfarm.

The 2024 Top-10 is dominated by offshore windfarms, with Drax coming in at number six with Lynemouth biomass plant in ninth place with Teesside Biomass and CHP plant in tenth place.

CfD Electricity Generation

We can now work to explain why the subsidy payments have been rising. To begin with, we can look at total generation as shown in Figure 5.

Generation is also hit an all-time high in 2024, with a substantial increase to offshore wind generation to another annual high due to the activation of the CfDs for Hornsea Project 2 and Moray East in March last year. Biomass and Biomass with CHP also saw considerable increase in output. There are only two active CfDs for solar power and their output is virtually undetectable.

CfD Strike Prices

As can be seen in Figure 6, in general strike prices rise over time as they get indexed up with inflation in April each year.

The strike price for Biomass has gone up each year since 2017 rising from ยฃ107/MWh to over ยฃ139/MWh last year. A similar picture emerges for onshore wind and solar. The exception is offshore wind where prices fluctuated in the ยฃ160-165/MWh range from 2017 to 2022. Then there was a big jump in 2023 to ยฃ171/MWh before falling back to ยฃ154/MWh in 2024. The drop in 2024 can be explained by Hornsea Project 2 and Moray East activating their CfDs in March 2024. The strike price for these two projects is much lower than the other projects at ยฃ78/MWh, so they brought down the average even though the strike price of the other projects indexed upwards.

CfD Reference Prices

The weighted average reference price for the year (equivalent to the black line in Figure 1) has fluctuated a lot since 2017 as shown in Figure 7.

Figure 7 โ€“ Weighted Average Reference Price (ยฃ per MWh)

The charts for offshore wind, onshore and solar are all very close, so for clarity this chart shows just the intermittent reference price for offshore wind. The various flavours of biomass use a different reference price called the Baseload Market Reference Price (BMRP) and we shall deal with separately. Average offshore wind reference prices were in the range ยฃ41-57/MWh from 2017 to 2019. Prices plummeted in 2020 as gas prices and demand fell due to Covid. Prices rose in 2021 to an average of ยฃ115/MWh mainly due to the energy crisis that began in the second half of that year. Prices rose again in 2022 to ยฃ177/MWh as the energy crisis continued with Russiaโ€™s invasion of Ukraine before falling back somewhat to ยฃ89/MWh in 2023. Prices have fallen further in 2024 to ยฃ67/MWh even though prices have been somewhat elevated in the latter part of the year.

CfD Subsidies Per MWh

The difference between the strike price and the reference price allows us to calculate the subsidies received per MWh of generation as shown in in Figure 8.

Figure 8 โ€“ CfD Subsidy by Year and Technology (ยฃ per MWh)

In 2022, all technologies paid back into the system on average, with negative subsidies per MWh generated. However, in 2023 and 2024 subsides rose back into positive territory for all three intermittent technologies.

We can see the share of market revenue and subsidy revenue for each technology in 2024 set out in Figure 9.

Figure 9 โ€“ Market Price and Subsidy 2024 (ยฃ per MWh)

Offshore wind received subsides of ยฃ86/MWh, which is more than the intermittent reference price of ยฃ67/MWh, meaning that on average CfD funded offshore wind farms got more of their revenue from subsidies (56%) than they got from selling their power on the market. Onshore wind received ยฃ48/MWh (43%) and solar got ยฃ45/MWh (41%) of their revenue from subsides.

Load Factors

We can also calculate the average load factor for the main intermittent technologies funded by Contracts for Difference as shown in Figure 10.

Figure 10 โ€“ Load Factor by Technology (%)

We can see a general downtrend in the amount of electricity generated compared to nameplate capacity for all three technologies. However, offshore wind achieved a load factor of just 38.7%, the lowest on record, despite new wind farms coming online. However, the average is skewed somewhat by Moray East that had a load factor of just 21%, probably reflecting a high level of curtailment during the year. Curtailment happens when wind is producing more power than there is demand or the grid can handle, so windfarms are asked to switch off. Although Beatrice and Triton Knoll showed a big increase in load factor in 2024 compared to 2023, East Anglia 1 and Hornsea Project One both saw significant reductions.

CfD Subsidies for Biomass Plants

Moving back to biomass plants, we can see how much subsidy they received per MWh of generation and the relationship between subsidies and generation in Figure 11.

Figure 11 โ€“ Subsidies (ยฃ per MWh) and Generation (MWh) for Biomass Plants

Conclusions

What conclusions can we draw from all this data? It is virtually certain that the overall subsidy payments will continue to rise in the coming years because more offshore wind farms are coming on stream that will push up the level of generation.

It is more difficult to predict strike prices. However, we know that new developments coming online such as Neart na Gaoithe (NNG) where the strike price is currently ยฃ158/MWh, coupled with a new round of indexation coming in April will have the effect of pushing up the average strike price. However, other projects with lower strike prices such as Dogger Bank and Sofia may come online and activate their CfDs too which would push strike prices in the opposite direction.

Reference prices are even harder to predict because we do not know future gas-prices which are the main driver of reference prices. Higher gas prices would tend to reduce subsidies because the reference price goes up. Gas prices are currently elevated, so provided global tensions do not escalate, we might expect gas-prices to fall and therefore reference prices would fall too and subsides would rise. Moreover, putting more offshore wind on the grid tends to reduce reference prices when it is most windy. Lower reference prices would tend to increase subsidies per MWh at the time when there is most generation.

It is sad to conclude that we are in for higher bills as the bill for Contracts for Difference continues to escalate.

David Turver writes the Eigen Values Substack, where this article first appeared. He will be giving a Sacred Cows talk on January 28th in London entitled โ€œNet Zero: Why the cure is worse than the climate change diseaseโ€. More details and ticket details can be found here.