Global warming, climate change, all these things are just a dream come true for politicians. I deal with evidence and not with frightening computer models because the seeker after truth does not put his faith in any consensus. The road to the truth is long and hard, but this is the road we must follow. People who describe the unprecedented comfort and ease of modern life as a climate disaster, in my opinion have no idea what a real problem is.
The Heartland Institute’s Anthony Watts, H. Sterling Burnett, Linnea Lueken, and Jim Lakely will dive deeper into that topic. Plus, we’ll review some of the Crazy Climate News of the Week, including a deep freeze that’s on the way for most of the continental United States.
Senate committee rooms on Capitol Hill were buzzing with activity this week as many of President Trump’s picks for cabinet posts were underway. Three of the key hearings on climate and energy policy were Lee Zeldin for EPA, Doug Burgum for Interior, and Chris Wright for Energy. We hope you caught Heartland’s two three-hour long “watch parties” with gavel-to-gavel coverage this week, but there’s still more to examine. What did the hearing performances of Trump’s picks say about how they will serve in their roles? Which federal agency of the three needs the most work to change its purpose? And can these appointments succeed in carrying out Trump’s agenda in the face of a deeply entrenched federal bureaucracy that is opposed to almost all of Trump’s major climate and energy goals?
The Heartland Institute’s Anthony Watts, H. Sterling Burnett, Linnea Lueken, and Jim Lakely will dive deeper into that topic. Plus, we’ll review some of the Crazy Climate News of the Week, including a deep freeze that’s on the way for most of the continental United States.
Join us LIVE at 1 p.m. ET and join the chat to engage in the show with other fans.
The Cloud Reduction Global Warming, CRGW, theory is a cascading natural process that only since about 1970 has become significant in Climate Change. The basic elements of CRGW theory have been around forever, it is the size (% of the earth affected) that has increased to the point that this natural process can be seen. The CRGW theory starts on land with the concept of a Special Parcel, SP, that has been changed from its virgin state such that less water is evaporated than the original virgin land.
The Cloud Reduction Global Warming, CRGW, theory is a cascading natural process that only since about 1970 has become significant in Climate Change. The basic elements of CRGW theory have been around forever, it is the size (% of the earth affected) that has increased to the point that this natural process can be seen. The CRGW theory starts on land with the concept of a Special Parcel, SP, that has been changed from its virgin state such that less water is evaporated than the original virgin land. (SP examples: UHIs, forest to crop, or surface mining) The lower water evaporation (as indicated by lower surface air specific humidity, SH) creates higher temp and lower relative humid, RH, than the original land. How much a SP has changed the evaporation is not known since the original evaporation is not known, but if the land surrounding the SP is unchanged it can be used as a reference (the zero) for how much the SP has changed. The changed vs virgin land difference in SH remains relatively constant as the size of the SP increases with time. The SP’s lower humidity hotter air rises in a plume about 2 to 4 time larger than the land area it came from to cloud level: thus, amplifying the cloud level effect. The cloud cover is related to the Vapor Pressure Deficit, VPD, (the difference between the saturated water vapor pressure and the actual water vapor pressure). Higher VPD less clouds. The less clouds more Sun (lower global albedo). More Sun more atmospheric enthalpy, higher temperatures, and more evaporation of water (SH rising). This cascading series of natural events increase with the size of the earth’s total SPs. Simply put: if less water is put into the atmosphere from land (relative to what was evaporated previously) the global cloud fraction will decrease, and it will get HOTter.
The atmosphere fingerprint supports the CRGW theory: Since 1970 temperatures, specific humidity, enthalpy, and VPD have been rising while relative humidity and cloud cover have been declining. The lower evapotranspiration, ET, (proportional to SH) in over 1500 cities has been confirmed by Mazroonei et al (8). The existence of Urban Heat Island plumes has been modeled and weather balloons have confirmed their existence.
Reasonable estimates of global SP ET (or SH) change in a mathematical models suggest that CRGW could be a significant contributor to global warming and is reversable.
Introduction
This essay is intended to be a summary of all 7 previous essays (1),(2),(3),(4),(5),(6),(7) with the theme of CO2 is innocent, but Clouds are Guilty (thanks WUWT). To the reviewers of previous essays thanks for your suggestions and comments. I hope this essay will answer some of your comments.
In this essay ET change and SH change are used interchangeably. Evapotranspiration, ET, is defined as the total water flux evaporated into the atmosphere from surface Evaporation and plant Transpiration. Specific humidity, SH is the concentration of water in air. On an annual basis ET is proportional to surface SH. CRGW theory uses %ET change = %SH change. Change not the actual value.
Prior to about 1970 climate scientist assumed that the annual cloud cover and reflectivity of short-wave radiation of the earth were relativity constant, because there was no data to say otherwise (13). With the advent of satellite data that is changing. The “urban heat island effect”, UHI, was known but alone was too small to be a significant climate change variable. In this essay the UHI’s possible amplifying relationship to cloud reduction and climate change is presented. It is also suggested that other land changes could have similar UHI climate change properties.
CO2 is innocent
The main points of the innocents of CO2 are:
The IPCC’s current theory (radiative forcing, RF) is that in the upper atmosphere CO2 via Planck’s Law and Kirchhoff’s Law will absorb long wave radiation and reflect heat back to the lower atmosphere. To prove this theory NASA put the CERES satellite up to measure the radiation related to this theory. RF theory should show relatively constant short wave, SW, radiation out and decreasing long wave, LW, radiation out with time See Figure 1. Twenty years of CERES data analyzed by Dübal et al (15)and Loeb et al (16) show SW out decreasing and LW out radiation increasing over the 20 years, contrary to RF theory, see Figure 2. Their papers also indicated there may be some evidence of RF but clouds were the main source of SW and LW change over the 20 years.
In the lower atmosphere CO2 is a greenhouse gas that absorbs long wave, LW, radiation and heats the atmosphere. The Beer-Lamber law says that this absorption is a function of distance and concentration (of CO2). At 400 ppm, CO2 is saturated in the lover atmosphere. Saturation means that more CO2 will not change the LW absorption in the lower atmosphere. The IPCC agrees… See (1) and (2) for more information.
Decreasing relative humidity, RH, with time does not fit the RF theory.
Decrease in low altitude clouds and no change to high altitude clouds does not fit the RF theory. RF theory would support decreasing all altitude clouds
Another theory is needed to explain the CERES data and the atmospheric observations. CRGW theory does that.
CRGW Theory – Cascading Natural Steps.
The Special Parcel, SP
Clausius–Clapeyron law describes the atmospheric behavior in a special parcel, SP: as the SH decreases the temperature increases at a constant enthalpy, see Figure 3. As enthalpy increases this relationship increases. The density decreases as the temperature increases, the decrease in SH has little effect on the density change, see Figure 4.
In a SP the SH change is not known (invisible) because the starting SH is lost to time, but can be relative to surrounding virgin land. Clausius–Clapeyron laws apply to all SPs: urban UHIs, rural structures, forest to crop, surface mining, etc. Prior to 1970 the total area of all these SPs was not large enough to have much of an impact on climate change. All these SPs are sources of ET change (increase of decrease) vs what was there before the SP.
A wide range of ET from UHIs was verified by Mazrooei et al. (2021) (8) and Lu Hao et al. (2021) (9) with a creative method from satellite data. Their data shows SPs in arid environments can have positive ETs and SPs in wet environments have negative ETs, showing a ET range of +10% to -50%. With a -12% ET change globally. Mazrooei et al.’s work proves that the (invisible) starting step of the CRGW theory is real, significant, and negative. See (7) for more information.
Vapor Pressure Deficit, VPD and Clouds
From the SPs temperature and SH, the saturation vapor pressure, Psw, and the actual water vapor pressure, Pw, can be calculated. The difference between these is the Vapor Pressure Deficit, VPD, and is a measure of the probability of condensation of water to clouds, fog, or rain. The lower the VPD the higher the probability of cloud formation. The VPD has been increasing over time and as expected clouds have been decreasing. This correlation, see Figure 5, is not that good, probability due to the fact that all clouds are not the same. Cloud cover includes dark rain clouds, non-rain clouds, high clouds, low clouds, and partly cloudy all these cloud types count in the cloud fraction but have a different correlation to VPD. CERES data (for 20 years) shows that cloud SW radiation reflectivity is a better correlation to the surface VPD, see (3) pie charts 3 and 4. A higher VPD vs cloud cover slope will decrease the cloud cover and thus the global temperature. Lake (5) for more information.
VPD and Enthalpy, En
The increase in SW radiation from the reduced cloud cover is absorbed by the earth to heat the land, oceans, and atmosphere as measured by the enthalpy. The En for the atmospheres can be calculated from the atmospheric (surface) temperature and SH and has increased with time. As expected En and VPD are correlated, see Figure 6. This slope of Figure 6 will be used in a mathematical model.
Enthalpy and SH
The increase in SW radiation is absorbed by water and evaporates water (mainly from the oceans). On land plant transportation is the main source of water to the atmosphere. The En vs SH correlation is good, see Figure 7. The slope of Figure 7 will be used in a mathematical model
Figure 7. Specific humidity vs Enthalpy
The Plume
SPs that produce lower density air (hot air) tend to produce a plume. These plumes amplify the VPD correlation to cloud cover. Modeling has shown UHI plumes can be 2 to 4 time the area of the UHI they came from.
Data from weather balloons “Soundings” suggest that a plume of higher VPD air is created over cloud free UHI’s and can be 1 to 4 time greater than the area of the UHI. The plume is created by the lower density of the hot-lower humidity air (lower ET) rising from the UHI and forcing turbulence (mixing) with the much low humidity air in the upper atmosphere.
“Soundings” data show the VPD decreasing as the altitude increases. If the VPD nears zero clouds may form, see Figure 8. Higher surface VPD increases the probability that the rising air will miss zero and stay clear sky. Bigger plumes increase the area of no clouds. Lower SP air density from lower ET (higher temperature, Figure 2) may cause bigger plumes. See (6) for more information.
Figure 8. VPD vs altitude from a SP.
Figure 8. VPD vs altitude from a SP.
How much of the Earth is changed
Size matters, if the area of all the SPs on land is less than 2% the CRGW theory is insignificant in climate change; but if the SP area is around 10% the CRGW theory could account for most of the observed climate change. Table 1 shows how the area of several SP categories may have changed over the years. (Table 1 is a guess based on several internet sources.) The increase in area from the 1970s to the present suggest the very little CRGW significance in 1970 to significant in 2020.
Table 1. Possible area of Special Parcels on earth since 1860.
Put it all together mathematically
I created an Excel model linked here, using proven Clausius–Clapeyron related psychometrics equations and the correlations in Figures 5, 6, and 7 was developed with inputs of total earth area of SPs, Table 1, and the average ET (SH) change. See (4) for psychometric equations used and more information.
Verbal description of the model:
Pick a starting point global annual temperature (T) and specific humidity (SH) from on-line global data (11) and calculate the global Enthalpy and VPD. (example for 1975: T=14.01 ‘C and SH= 7.59 g/kg(da) calculated En=33.37 kJ/kg(da) and VPD = 3.82hP/kg(da))
Input an average change in SH to the sum-total of all the SPs on land. (example -12%). Subtract % change in SH from the starting SH. (example SPs SH = 6.68g/kg(da)).
From psychometric equations a SP temperature can be calculated at the same En in step 1. (example T= 16.3 ‘C)
Input the total area of all SPs on land. (example 10%)
Use a global energy balance with the SP’s T and SH to calculate the new average global temperature and VPD. (example: SH = 7.54 g/kg(da) and T = 14.18 ‘C and VPD = 4.04 hP/kg(da), En will be the same as starting conditions.)
The change in VPD in step 5 will force a change in cloud fraction and the resulting En according to the slope of the VPD vs En correlations. (example new En = 34.16 kJ/kg(da))
At this point in the model En is an empirical representation of the new level of energy in the atmosphere that can evaporate more water as represented by a strong SH vs En correlation. (example SH= 7.70 g/kg(da))
With SH and En from steps 7 and 6 a new T can be calculated. (example: T= 14.54 ‘C)
With step 8 SH and T calculate a new VPD. Example: VPD = 4.24 hP/kg(da))
Use this interim VPD to estimate an interim En from slope of VPD vs En and an interim SH from SH vs En slope.
Repeat step 10 until T, SH, En, and VPD quit changing (about 10 iterations). (example final ( T= 15.1 ‘C, SH = 7.95 g/kg(da), En = 35.37 kJ/kg(da), VPD = 4.37 hP/kg(da))
The model’s results for the example above are shown in Figure 9 along with the observed data. Note there are many combinations of ET change, earth area, and plume size that will give results like observed.
Figure xx. Atmospheric fingerprint 1975 to 2020 and model results.
Discussion
With new data and input from readers, CRGW theory has been evolving over the 7 essays already published in WUWT. This essay suggests that cascading natural steps in CRGW theory are real and significant contributor to global warming. The psychrometric equations governing atmospheric properties are proven science. The correlation of VPD to cloud cover and enthalpy should exist and should improve with time. The magnitudes of the VPD to clouds and atmospheric enthalpy relationships has uncertainty, but the negative slope of VPD vs Clouds and the positive slope of VPD vs enthalpy support the CRGW theory. The special parcel ET change is just being studies for UHIs, no ET change study has been done for forest to crop or mining. The global area of the SPs could be refined. Plumes exist but need a lot of research to quantify the global contribution. The suggested values for ET change, SP area, and plume size variables produce a temperature rise close to observed.
A mathematical model comes close to matching the atmospheric fingerprint: a strong suggestion that CRGW is a significant contributor to climate change. This model also suggests that CRGW theory can be stopped or reversed. If any combination of higher +ET change, reduced SP area, or new source of water into the atmosphere can stop or reverse climate change.
The CRGW theory is that a lower ET locally mixes with global air to reduce cloud formation, less cloud means more sun and more evaporation of water to increase the global ET (SH). A decrease in local ET (SH) causes a global increase in ET (SH)! – This happens because the SP’s lower ET change is relative to its virgin ET and remains relatively constant while the area of the SP increases the global increase in ET is absolute.
Time for the IPCC to add CRGW theory to their evaluation of climate change?
11. Climate Explorer web siteClimate Explorer: Select a monthly field (knmi.nl) go to “Cloud Cover” or any other data set, for CC click “EUMETSAT CM-SAF 0.25° cloud fraction” click “select field” at top of page on next page enter latitude (-90 to 90) and longitude (-180 to 180) for whole earth. Raw data link is above the graph.
Frank Sinatra says if you can make it in New York, you can make it anywhere. So what does it mean when it’s repeatedly made clear that you just can’t make it in New York? That question is one the climate litigation campaign is grappling with today.
Frank Sinatra says if you can make it in New York, you can make it anywhere. So, what does it mean when it’s repeatedly made clear that you just can’t make it in New York? That question is one the climate litigation campaign is grappling with today.
In yet another demoralizing defeat for the nationally-coordinated climate litigation campaign – and a poignant moment of déjà vu – New York City’s lawsuit against American energy producers yesterday has been dismissed (for the second time). The Supreme Court of the State of New York’s ruling firmly rejected the city’s claims that the companies had misled the public about their products and their sustainability commitments.
This defeat marks the third blow to New York – city and state – in their attempts to “take down” American energy companies.
New York City filed its own climate case against the industry in 2018 – only for it to be thrown out in 2021. Undeterred, the city refiled a new lawsuit a month later, giving their means-to-an-ends crusade a facelift by swapping out the claims to focus on alleged consumer protection violations.
Today, that case joined the ghosts of failed New York lawsuits past, with the State Supreme Court acknowledging it as an obvious “re-purposing” of rejected allegations. Ten years and three lawsuits later, New York has nothing to show for its decade-long effort other than an 0-3 record.
Judge: Plaintiffs Can’t Have It Both Ways As To Whether Everyone Knew
Justice Anar Rathod Patel, an appointee of Democratic Governor Kathy Hochul, ruled that New York City’s claims did not sufficiently make the case that the oil companies could have deceived the public about the climate impacts of its oil and gas products.
While the City hoped to hold the companies “accountable” for not putting warning labels on gasoline pumps, Judge Patel argued that such disclosures weren’t necessary because the city itself admitted that New York City consumers are climate-aware consumers:
“The City cannot have it both ways by, on one hand, asserting that consumers are aware of and commercially sensitive to the fact that fossil fuels cause climate change, and, on the other hand, that the same consumers are being duped by Defendants’ failure to disclose that their fossil fuel products emit greenhouse gases that contribute to climate change.” (emphasis added)
Greenwashing Claims Don’t Pass Muster, Plaintiffs Took Statements Out of Context
Judge Patel also rejected the plaintiff’s far-fetched greenwashing claims, stating that the City did not convincingly make the case that companies made false statements in connection with the sale of energy to New York city consumers:
“Second, the City has not sufficiently pled that Defendants’ alleged greenwashing campaigns, involving statements about clean energy and alternative energy sources, are ‘made in connection with the sale’ of a consumer good (i.e., fossil fuel products) in NYC, as required under the CPL.”
Interestingly, the Judge duly noted that many of the corporate statements that plaintiffs cited were taken out of context, and when she actually went to the companies’ websites to read the claims, they didn’t appear to be “deceptive” in any sense:
“[C]ertain of the alleged statements are distortions of statements that have been taken out of context and Plaintiff does not not—and cannot—allege that each statement when viewed ‘in light of its context on the product label or advertisement as a whole’ is misleading to the reasonable consumer.” (emphasis added)
So, to summarize: it turns out that the “deceivers” were never the energy companies to begin with. Rather, New York City attempted to deceive the legal system by taking information out of context in order to name and shame American energy companies. While unfortunate, this activity isn’t surprising considering the City’s law firm, Sher Edling, is currently under Congressional investigation for its dark money financing and questionable ties to activist-academics.
Bottom Line: New York has now taken three big swing-and-a-misses. Will they try to step up to the plate again for a fourth attempt at climate litigation? We say it’s time to go back to the dugout.
California’s annual wildfires follow a pattern: wet fall and winter months spur plant growth; arid summers turn trees, brush and grass into tinder-dry fuel, primed for ignition by lightning, sparks, careless campers and arsonists; strong, gusty Santa Ana winds fan flames into infernos.
California’s annual wildfires follow a pattern: wet fall and winter months spur plant growth; arid summers turn trees, brush and grass into tinder-dry fuel, primed for ignition by lightning, sparks, careless campers and arsonists; strong, gusty Santa Ana winds fan flames into infernos.
Most critical, poor to nonexistent local, state and federal forest management result in far too many skinny, thirsty trees per acre, millions of diseased and dead trees left uncleared, and forest floors covered in brush and debris. It’s a recipe for disaster.
The 2018 Paradise Fire had been the most destructive and deadly in California history. But the multiple fires still burning uncontrollably near Los Angeles this year have already set records for the value of property destroyed, because so many were multi-million-dollar homes.
The 2025 fires have already reduced more than 12,000 homes and other buildings to ash, chimneys and concrete foundations. Dozens of people have died. The numbers are still climbing. AccuWeather’s loss forecasters say the Palisades and Eaton Fires alone will destroy property worth $135-150 billion.
How is this possible?
Incompetence, negligence, malfeasance and indifference appear to run rampant in local, state and federal government. Elected officials and bureaucrats not only learned nothing from hundreds of wildfires.
They repeatedly give climate change, fish and forest preservation, DEI hiring and other progressive ideologies precedence over their most fundamental responsibility: safeguarding constituents against fires, earthquakes, and mudslides triggered by recurrent downpours.
Altadena, Malibu and Pacific Palisades are surrounded by Topanga State Park and Santa Monica Mountains National Recreation Area forestlands, where timber harvesting and thinning have been delayed, restricted or prohibited for decades.
Unprecedented fuel buildup is the primary reason wildfires have become dramatically more catastrophic than in the past. Just getting one forest-thinning project approved takes five years and millions of dollars in studies. Lawsuits, inadequate budgets and “let nature run its course” attitudes delay work even longer, while massive wildfires incinerate water and biotic resources they claim to be protecting.
Resistance to building more water storage and transport projects, often to protect insignificant species like the delta smelt, means insufficient water to fight fires – or keep storage tanks full and hydrants working.
Claiming older forests are increasingly threatened by climate change, President Biden greatly restricted tree thinning in national forests, before curtailing the policy as California fires raged. Meanwhile, California’s 2020 wildfires alone released twice as many greenhouse gases into the atmosphere as state-mandated fossil-fuel restrictions on vehicles and electricity power plants reduced 2003-2019.
Governor Gavin Newsom and his solidly Democrat legislature intend to spend some $50 million to challenge Trump Administration policies, and a measly $2.6 billion on “forest and wildfire resilience.” Meanwhile, they plan to spend another $14.7 billion on zero-emission vehicles and the “clean” energy transition, billions more on the already $100-billion “bullet train,” and additional tens of billions on wind and solar projects.
They’ve also driven insurance companies out of the state, by restricting risk analyses and what they can charge for home insurance in high-fire-risk areas, leaving hundreds of thousands of families uninsured or dependent on the state’s FAIR Plan, which in June 2024 had only $385 million in reserves.
Los Angeles Mayor Karen Bass cut $17.6 million from the Fire Department budget, suspended or fired over 100 firefighters who refused to get Covid vaccines, and flew to Ghana for an inauguration amid the fire season. LA Fire Department Chief Kristin Crowley has criticized these actions but spent millions on DEI programs and hiring more women, gays and minorities.
Capping it off, LA Water and Power Department CEO Janisse Quiñones drained the 117-million-gallon Santa Ynez Reservoir that would have replenished Pacific Palisades’ three-million-gallon water storage tanks that firefighters relied on to supply water to battle the infernos. Fire hydrants and hoses went dry.
Cracks in the reservoir’s concrete floor required repairs. However, drainage began in February 2024, and no workers, equipment or materials were on-hand for 24/7 repair work once the reservoir was empty. In fact, no contractor was hired until November 2024!
What can citizens do? Fire these incompetent elected officials and unelected bureaucrats. End “woke” DEI policy supremacy. Hire people who care enough to focus on fundamental responsibilities.
Recognize that Santa-Ana-powered wildfires can carry huge flaming branches hundreds of yards and even a mile or more. Plan and prepare accordingly.
Fix reservoirs and build new ones, to capture wet-season rains for dry seasons. For coastal communities like Malibu, consider using seawater for firefighting and buy the necessary equipment. (Would such limited saltwater really ruin soils? Do firefighters really need freshwater or treated potable water?)
Develop codes for homes and buildings, to make them fireproof or at least fire-resistant.
Do what the Getty Villa and several neighbors did in Malibu: have fire hoses, fire-retardant gel and other equipment on hand ahead of fires; clear brush and limit tree numbers and heights around you; develop a plan and practice executing it – so that you can save your homes, businesses and lives.
Have evacuation plans, bugout bags, and fully fueled cars ahead of time, to at least save your lives.
And ignore politicians, media hacks and activists who blame climate change. Baloney.
Earth’s climate has changed throughout geologic and human history. We cannot separate natural from manmade factors, control natural forces, or regulate soaring greenhouse emissions from China, India and other countries. We must do what our ancestors did during the Little Ice Age and other periods:
Adapt to warming and other changes – and prepare for fires that threaten us every year.
Jimmy Carter’s term as U. S. President (1977–1981) included major deregulation with airlines, motor carriers, and railroads. Other advances were scored in communications, tax policy, and regulatory budgeting. But the “great deregulator” had a very different approach with energy, which (along with inflation) defined his economic infamy.
Jimmy Carter’s term as U. S. President (1977–1981) included major deregulation with airlines, motor carriers, and railroads. Other advances were scored in communications, tax policy, and regulatory budgeting. But the “great deregulator” had a very different approach with energy, which (along with inflation) defined his economic infamy.
Carter began wellhead deregulation of petroleum and natural gas—but with a Windfall Profit Tax for crude oil and intrastate regulation for gas. Carter’s basic mindset was oriented toward the federal planning of supply and demand, outlined in the National Energy Plan of 1977. The visible hand of government, not the invisible hand of markets, was to be controlling.
What Was the Problem?
The energy crisis in Carter’s time was blamed on the irreversible, worsening depletion of oil and gas. Physical fixity meant an increasing cost of extraction, hence the problems of supply and price. The “economics of exhaustible resources” was mainstream fare in the textbooks and journals, spawning a new subdiscipline, energy economics. The engineering mind of the 39th President was determined to overcome a perceived limit to growth.
Oil shortages in 1972–74, and natural gas curtailments in the winters of 1971/72 and 1976/77, had set the stage. To Carter, and his energy czar James Schlesinger, [1] crude oil and natural gas had to be replaced by super-abundant coal, synthetic oil and gas from coal (synfuels), and supplemented by renewable energies. (Nuclear, never embraced, was completely off the table with the Three Mile Island incident in March 1979.)
On the demand side, less energy had to be consumed in transportation, industry, and power generation, not to mention in homes and businesses.
Major new legislation—interpreted in many thousands of Federal Register pages—empowered the newborn U.S. Department of Energy (1977). The new laws (in 1978) were the National Energy Conservation Policy Act; Power Plant and Industrial Fuel Use Act; Public Utilities Regulatory Policy Act; Energy Tax Act; and Natural Gas Policy Act.
And in 1980: the U.S. Synthetic Fuels Corporation Act; Biomass Energy and Alcohol Fuels Act; Renewable Energy Resources Act; Solar Energy and Energy Conservation Act; Solar Energy and Energy Conservation Bank Act; Geothermal Energy Act; and Ocean Thermal Energy Conversion Act.
Planning, More Planning
The National Energy Plan of 1977 stated, “neither Government policy nor market incentives can improve on nature.” [2] While recognizing the perverse effects of price ceilings on supply and demand, Carter blamed foreign political control by OPEC for his activism (“there was no free market or effective competitive forces relating to world oil supplies and price,” he stated in his memoirs). [3]
These false rationales resulted in a regulatory experience that was frustrating, wasteful, even bizarre. A new term, gapism, described the multitude of government programs passed to synthetically increase supply and reduce demand, given “disequilibrium” under price controls. “One can only conjecture that many gapologists do not really appreciate the fact that at higher prices consumers really do buy less and producers offer more,” observed Edward J. Mitchell, “or that they believe these tendencies are so weak that only astronomical prices will eliminate gaps.” [4]
The Economists Error
Experts, academics, and planners were all-in with the fixity-depletion premise of Carter energy policy. Forgotten or ignored was Scarcity and Growth: The Economics of Resource Availability (1963), which challenged depletionism and credited “man’s ingenuity and wisdom” with “increasing, not diminishing, returns.” [5]
“There has been a certain tendency to regard technological advance as a chancy phenomenon, a bit of luck that is sure to run out sooner or later (with the ever-present implication that it will be sooner),” explained Harold J. Barnett and Chandler Morse. [6] But data suggested otherwise. “Every cost-reducing innovation opens up possibilities of application in so many new directions that the stock of knowledge, far from being depleted by new developments, may even expand geometrically.” [7]
It would take a contrarian, Julian Simon, to resurrect Barnett-Morse’s “great 1963 book” in the Carter era. [8] And in the 1980s, with energy prices decontrolled, the resource optimists would win the debate. Energy economics was just economics, after all. And less dismal.
Conclusion
Jimmy Carter was apparently well-intentioned in choosing the bureaucratic means to provide reliable and affordable energy for Americans. But he could have ended the energy crisis quickly and simply with an opposite public policy.
Carter was under the sway of false theories about what human ingenuity could accomplish in a free market, with or without major negative foreign policy events. Those false ideas had resounding negative consequences. The energy lessons of the 1970s should not be forgotten.
[1] “Schlesinger’s views on national economic policy were closer to French indicative planning than to the invisible hand ….” James L. Cochrane, “Carter Energy Policy and the Ninety-fifth Congress.” In Energy Policy in Perspective, Craufurd D. Goodwin, ed. (Washington, DC: The Brookings Institution, 1981), p. 553.
[2] Executive Office of the President, Energy Policy and Planning Office, The National Energy Plan (Washington, DC: GPO, 1977), p. xiii.
[3] Jimmy Carter, Keeping Faith: Memoirs of a President (New York: Bantam Books, 1982), p. 94. In a 1977 address to the nation, Carter used the memorable phrase “the moral equivalent of war” to describe America’s challenge against OPEC and oil imports in general.
[4] Edward J. Mitchell, U.S. Energy Policy: A Primer (Washington, DC: American Enterprise Institute, 1974), pp. 20–21.
[5] Harold J. Barnett and Chandler Morse, Scarcity and Growth: The Economics of Natural Resource Availability (Baltimore, MD: Johns Hopkins Press, for Resources for the Future, 1963), pp. 3, 8.
[6] Barnett and Morse, Scarcity and Growth, p. 235.
[7] Barnett and Morse, Scarcity and Growth, p. 236.
Heat pumps may never be cheaper than gas boilers, Ed Miliband has admitted as Labour sneaks a new boiler tax through Parliament that will push up prices.
Heat pumps may never be cheaper than gas boilers, Ed Miliband has admitted as Labour sneaks a new boiler tax through Parliament that will push up prices. The Telegraph has more.
The Energy Secretary made the comments as Labour snuck a boiler tax through Parliament with minimal scrutiny on Wednesday, despite warnings the move will push up prices.
Under the scheme, which will come into force in April, boiler manufacturers will be fined if they fail to sell enough heat pumps, which companies have warned will force them to increase the price of installing a new gas boiler by as much as £120.
When asked to confirm whether the Government would abandon the proposed 2035 ban on new gas boilers at a Parliamentary committee, he said: “We can say to people you need to get a heat pump, not a gas boiler, potentially, at some point in the future.
“But I’m very wary of saying we’re going to stop people having gas boilers at a point when we can’t guarantee heat pumps are going to be cheaper for people.
“We must proceed in a way that we can say to people they will be better off in the transition.
“I do not want to be in a position where we say to people ‘you must go down this road’ and then people say – rightly – ‘you have made me worse off’.”
Heat pumps currently cost around £10,000 if bought without any Government subsidy, compared to around £3,000 for a gas boiler.
The relatively high price of electricity also means they are often more expensive to run than a gas boiler, despite being more efficient.
Ministers tabled the powers to enact the boiler tax as a statutory instrument, a type of legislation that can be passed with minimal scrutiny.
The measure was brought to a delegated committee in a side room of Parliament on Monday night, where there was little debate and no vote.
Labour MPs were only forced to vote for the policy at all after Tories in the chamber shouted out their opposition on Tuesday, triggering a ballot.
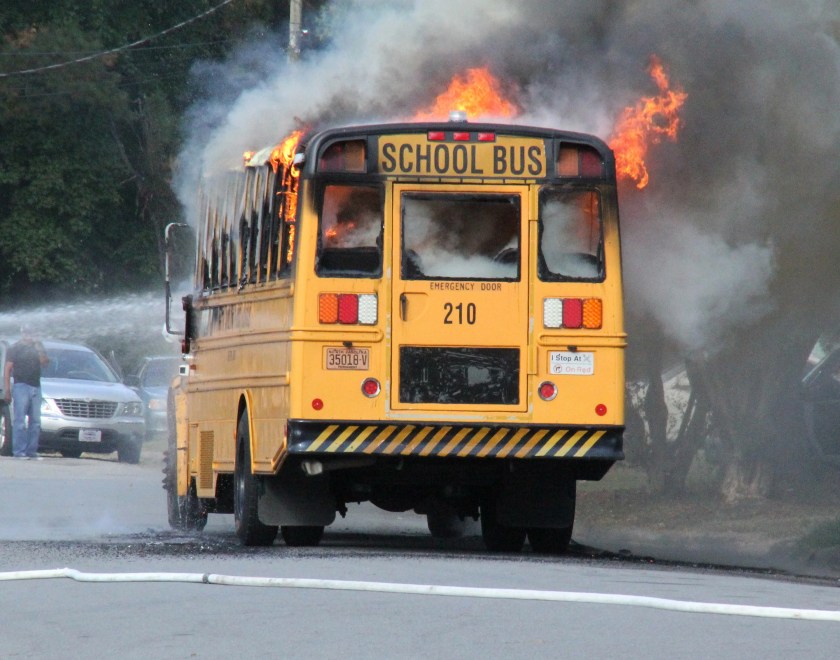
It was reported that children has smelled burning on the bus, which led the driver to evacuate.
Every report seems to absolve the battery – “the fire’s cause remains unknown, but the bus’ battery is not believed to be involved.” is a statement widely reported.
This is of course nonsense. There has been no time to find out what the cause was, as they admit, so how do they know the battery was not at fault.
Either way, such claims are meaningless and dangerous. The cause of ignition is irrelevant – once the bus on fire, it is the battery which turns it into a death trap.
The headline says it all. Time for persistent AMOC worriers like the BBC to pack up their coulds, mights and maybes and move on to other speculations. AMOC has many variables and alarmist guessing games are a waste of time.
The headline says it all. Time for persistent AMOC worriers like the BBC to pack up their coulds, mights and maybes and move on to other speculations. AMOC has many variables and alarmist guessing games are a waste of time. – – – Earth, being 71% covered in water, is influenced by the ocean and its movements, says Phys.org.
In the Atlantic Ocean, a system of connected currents, called the Atlantic Meridional Overturning Circulation (AMOC), moves water throughout the world’s oceans powered by a combination of winds and ocean density.
It not only distributes the ocean’s heat, moisture, and nutrients, but regulates the Earth’s climate and weather.
As the climate is continuously changing and the atmosphere is warming, many scientists fear that fresh water from melting polar ice sheets could significantly disrupt—or collapse—the AMOC. While a decline of the AMOC would have grave consequences, a collapse would be truly catastrophic.
However, studies about the AMOC’s long term future are uncertain. Instead of predicting the future, a team of scientists from Woods Hole Oceanographic Institution (WHOI) quantified the past to help inform where we could be going.
In a new paper published in Nature Communications, scientists found that the AMOC has not declined in the last 60 years.
Authors Nicholas P. Foukal, adjunct scientist in Physical Oceanography at WHOI and assistant professor at the University of Georgia; Jens Terhaar, affiliated scientist at WHOI and senior scientist at the University of Bern; and Linus Vogt, visiting student at WHOI when he started to work on this study and now scientist at LOCEAN, Sorbonne Université, say their results mean that the AMOC is currently more stable than expected.
“Our paper says that the Atlantic overturning has not declined yet,” said Foukal, who conducted the research while at WHOI. “That doesn’t say anything about its future, but it doesn’t appear the anticipated changes have occurred yet.”
Their findings contrast with previous work, notably a paper from 2018 cited in their study, which reported that the AMOC has declined over the last 70 years.
This past work relied on sea surface temperature measurements to understand how the AMOC has changed, but “we’ve learned that sea surface temperature doesn’t work as well as initially thought,” said Terhaar, who began leading this study at WHOI as a postdoctoral scientist and completed the work in Bern. . . . The paper states that air-sea heat flux anomalies in the North Atlantic are tightly linked to the AMOC and that “the decadal averaged AMOC has not weakened from 1963 to 2017.”
Since there are many processes that lead to large year-to-year variability in the AMOC, the air-sea heat flux and the AMOC are correlated strongest at those timescales, as opposed to annual averages.
Full article here. – – – Image credit: researchgate.net
“So the U.S. is about one percent, with six years to go, toward meeting the Biden/Harris goal for offshore wind of 30 GW. Just another rank exaggeration, another energy fantasy, in the undoing.”
“So the U.S. is about one percent, with six years to go, toward meeting the Biden/Harris goal for offshore wind of 30 GW. Just another rank exaggeration, another energy fantasy, in the undoing.”
It should simply be worded “The Offshore Wind Rescue Act.” Instead, the Reinvesting in Shoreline Economies and Ecosystems Act (S. 373: 118th Congress) reads:
To modify the disposition of certain outer Continental Shelf revenues and to open Federal financial sharing to heighten opportunities for renewable energy, and for other purposes.
A BILL To modify the disposition of certain outer Continental Shelf revenues and to open Federal financial sharing to heighten opportunities for renewable energy, and for other purposes.
Be it enacted by the Senate and House of Representatives of the United States of America in Congress assembled, SECTION 1. SHORT TITLE. This Act may be cited as the ‘‘Reinvesting In Shoreline Economies and Ecosystems Act of 2023’’ or the ‘‘RISEE Act of 2023’’.
This bill increases revenue streams provided to states from offshore wind projects, offshore oil and gas leases, and onshore energy and mineral resources. States must use the revenue for specified purposes, such as coastal restoration, conservation, or infrastructure.
Specifically, the bill requires revenues generated from offshore wind projects carried out under a lease entered into on or after January 1, 2022, to be deposited into accounts for the U.S. Treasury, the National Oceans and Coastal Security Fund, and adjacent coastal states. Currently, this revenue is deposited in the U.S. Treasury. The Department of the Interior must disburse the revenue to a state in an amount that is based on a formula that is inversely proportional to a state’s distance from the offshore wind site.
In addition, the bill removes the cap on the amount of revenue generated from offshore oil and gas leases that may be shared with states under the Gulf of Mexico Energy Security Act of 2006.
It also eliminates a fee under the Mineral Leasing Act that Interior currently collects to administer the onshore revenue sharing program.
Comment
The gray train is over. This languishing bill, supported by the political side of the Climate Industrial Complex, first introduced on February 9, 2023, will die in the Committee on Energy and Natural Resources. The terrible economics of offshore wind, and the growing pressure on electricity rates from prior wind and solar duplication, will not be reversed anytime soon.
So what has become of the Biden-Harris Administration goal of constructing 30,000 MW (30 GW) of offshore wind by 2030? The current operating projects are:
Coastal Virginia Offshore Wind: 12 MW (2 turbines), offshore Virginia
South Fork Wind Farm: 132 MW (12 turbines) , offshore Long Island
Block Island Wind Farm: 30 MW (5 turbines), offshore Rhode Island
Vineyard Wind 1: 130 MW (24 turbines), offshore Massachusetts (in construction with a planned 62 turbine, 806 MW project
The U.S. is about one percent there (with six years to go) to meet the Biden/Harris goal for offshore wind of 30 GW. Just another rank exaggeration, another energy fantasy, in the undoing.




You must be logged in to post a comment.