The Roman Climate Optimum: Warmer Than Today in Europe โ€” But Not Globally

The Roman Warm Period (RWP), also called the Roman Climatic Optimum (or Roman Climate Optimum), was a multi-century interval of relatively warm and often more stable/humid conditions primarily in Europe, the Mediterranean, and the North Atlantic, roughly spanning ~250 BC to AD 400 (with peak or most stable conditions often placed around 100 BC- AD 200 or similar).

Cooling and increased climate variability after the Roman Climatic Optimum are well- documented and are considered contributing stressors to challenges faced by the Roman Empire.

The Roman Warm Period (RWP, or Roman Climatic Optimum, roughly 250 BC- AD 400) was a multi-century phase of relatively warm conditions mainly in Europe, the Mediterranean, and the North Atlantic. Comparisons to today must distinguish regional vs. global scales, proxy uncertainties, and rates of change.

Infographic illustrating the Roman Climate Optimum (200 BCE - 200 CE) and its warmer climate compared to today in Europe, featuring a world map showing temperature variations, historical context, and climate change data.
AI generated by Grok

The Roman Warm Period (RWP), also called the Roman Climatic Optimum (or Roman Climate Optimum), was a multi-century interval of relatively warm and often more stable/humid conditions primarily in Europe, the Mediterranean, and the North Atlantic, roughly spanning ~250 BC to AD 400 (with peak or most stable conditions often placed around 100 BC- AD 200 or similar).

It is named for its chronological overlap with the rise, expansion, and early imperial peak of Rome, though climate was one contributing environmental factor among many (political, military, economic, and technological) rather than a sole cause of Roman success.

Key Characteristics

Temperature: Proxy data (tree rings, speleothems/stalagmites, marine sediments, pollen, glacier advances/retreats, and archaeological indicators) indicate conditions often ~1- 2ยฐC warmer than later pre-industrial centuries in parts of Europe and the Mediterranean. Some high- resolution Mediterranean Sea-surface temperature (SST) reconstructions (e.g., Sicily Channel Mg/Ca ratios from foraminifera) show the Roman period as the warmest of the last ~2,000 years in those records, with peaks up to ~2ยฐC above late pre- modern averages.

Hydrology and variability: Many European and Mediterranean records point to relatively warm and humid/stable conditions during much of the period (favoring agriculture), though with regional and temporal differences, including drier intervals and a shift toward cooler, drier, or more variable conditions later (especially from the 3rd- 5th centuries).

Regional nature: Modern multi- proxy analyses treat it (like the Medieval Warm Period or Little Ice Age) as a regional phenomenon rather than a globally coherent, synchronous event. Evidence is strongest for Europe, Mediterranean, North Atlantic; signals elsewhere are weaker or asynchronous.

Evidence Sources

Proxies include:

  • Tree- ring width/density and dendrochronology (e.g., Alps, Italy, Scandinavia).
  • Speleothem (stalagmite) isotope records (e.g., northern Italy showing warming and humidity trends).
  • Marine sediments and SST reconstructions across the Mediterranean (Alboran, Sicily, Aegean, etc.).
  • Glacier behavior (Alpine retreat facilitating passes).
  • Historical/literary notes (e.g., Theophrastus on date palms in Greece; Pliny; grape/olive cultivation extents) and archaeological finds (e.g., warmth- loving insects farther north, such as the nettlebug in Britain).
  • Other indicators like mollusk shells, pollen, and biomarkers.

The term itself entered wider use after a 1995 thesis and a 1999 Nature paper; earlier literature discussed related warm/stable conditions without the specific label.

Relation to Roman History

Favorable conditions (milder winters, longer growing seasons, reliable harvests in key grain and agricultural zones, and more passable Alpine routes) coincided with Romeโ€™s expansion and the early Empireโ€™s prosperity and stability. Climate deterioration and increased variability (linked in some reconstructions to the 3rd- century crisis and later challenges) have been discussed as one stressor among many contributing to later difficulties, including in the Western Empireโ€™s decline, though historians emphasize that climate was not deterministic.

Some recent local studies (e.g., biomarkers from Roman sites in Dacia/Romania) reconstruct mean annual temperatures ~2ยฐC above modern local values during occupation, consistent with broader warmer/drier signals in parts of Eastern Europe.

Context and Caveats

It is one of several late-Holocene climate fluctuations (preceding the Late Antique Little Ice Age and followed much later by the Medieval Warm Period). Reconstructions continue to be refined with denser proxy networks; absolute temperatures, exact boundaries, and global vs. regional coherence remain subjects of ongoing research. Comparisons to modern instrumental temperatures depend on the baseline chosen and the specific region/proxy.

In short, the RWP reflects a well- documented phase of relatively favorable climate in the Roman heartland and surrounding regions that provided a supportive environmental backdrop for classical Mediterranean civilization at its height.

A historic scene depicting an ornate fountain with sculptures, surrounded by ancient Roman architecture and people dressed in traditional attire.

The climate of ancient Rome (roughly the period of the Roman Kingdom, Republic, and Empire, ~753 BC- AD 476 in the West) was fundamentally Mediterranean: mild, wet winters and hot, dry summers, with regional variations across the Italian peninsula and the wider empire. It largely coincided with the Roman Warm Period (or Roman Climatic Optimum, ~250 BC- AD 400), a phase of relatively warm, stable, and often more humid conditions that supported agriculture and population growth.

Overall Climate Regime

Italy sat in a subtropical/Mediterranean zone. Northern areas were more temperate, while central and southern Italy experienced classic Mediterranean patterns. Annual precipitation in the Rome area was typically in the range of several hundred millimeters, concentrated in autumn and winter, with dry summers. The Tiber River and surrounding marshes were prone to seasonal flooding, especially during snowmelt or heavy rains.

Key features during the Roman era included:

Temperatures: Often comparable to or slightly warmer than mid- 20th- century averages in many proxies (sometimes estimated ~1- 2ยฐC warmer in parts of the Mediterranean and Europe during peak phases). Evidence includes northward shifts of warmth- loving species (e.g., the nettlebug Heterogaster urticae farther north in Britain than in the 1950s) and expanded cultivation of olives, grapes, and other crops.

Precipitation and humidity: Relatively reliable and sometimes wetter than in intervening cooler periods, aiding agriculture. Some records indicate more frequent summer rain in parts of southern Italy than today. North Africa (a key grain supplier) and parts of Spain also benefited from adequate moisture.

Stability: The early and high Empire (~100 BC- AD 200) featured exceptional climatic stability, which correlated with agricultural productivity, urban growth, and imperial expansion.

Chronological Variations

Climate was not static:

Early period (Kingdom and Republic, before ~100 BC): Part of the broader Subatlantic phase, with cool summers and mild, rainy winters. Occasional severe winters froze the Tiber (recorded in 398 BC, 396 BC, 271 BC, and 177 BC). The climate was generally more humid and cooler than the modern baseline in the first half of the 1st millennium BC, with higher precipitation in what is now more arid southern Italy.

Roman Climatic Optimum peak (~100 BC- AD 150/200): Warmer and more stable conditions prevailed. Alpine glaciers retreated, improving passes; growing seasons lengthened; and agriculture expanded (e.g., viticulture farther north). This phase supported the Republicโ€™s late expansion and the early Empireโ€™s prosperity.

Later Empire (3rd century onward): Increased variability, cooling, and shifts toward drier conditions in some regions. These changes overlapped with the 3rd- century crisis and later stresses. A brief recovery of more favorable conditions occurred in the 4th century, after which cooler and more variable climate (leading into the Late Antique Little Ice Age) contributed to challenges in the West, while the East sometimes fared differently.

Extreme events are recorded in historical sources: powerful storms that wrecked fleets during the First Punic War (255 BC and 249 BC), droughts (e.g., 226 BC lasting months), and occasional unusual phenomena.

Impact on Roman Society and Agriculture

Favorable conditions during the Optimum enhanced yields of the Mediterranean triad (cereals/wheat, vines, olives), supporting large urban populations (Rome itself exceeding 1 million at peak) and military logistics. Expanded cultivation is attested by writers such as Pliny and archaeological evidence. The empireโ€™s grain supply from North Africa, Egypt (Nile- dependent), Sicily, and elsewhere relied on these climatic patterns.

Climate was an enabling factor rather than a deterministic cause of Romeโ€™s rise or fall. Political organization, technology (e.g., aqueducts, villa systems, irrigation), trade, and institutions allowed Romans to buffer variability better than many earlier societies. Later cooling and variability, combined with disease (e.g., Antonine Plague and others coinciding with cooler/drier phases), migrations, and internal stresses, added to difficulties.

Evidence Base

Reconstructions draw on multi- proxy data:

  • Tree rings, speleothems (cave formations), marine sediments (sea-surface temperatures), pollen, glaciers, and ice cores.
  • Historical texts (Pliny, Columella, Ptolemyโ€™s weather notes from Alexandria, literary accounts of floods/freezes).
  • Archaeology (insect remains, crop distributions, villa remains).

Modern Rome retains a similar Mediterranean (Kรถppen Csa) climate, mild winters and hot summers, but the ancient periodโ€™s relative warmth and stability during the empireโ€™s height provided a supportive environmental context for classical civilization.

In summary, ancient Rome experienced a predominantly favorable Mediterranean climate, especially during its imperial peak, that facilitated agricultural surplus and expansion within the broader Roman Warm Period framework.

Cooling and increased climate variability after the Roman Climatic Optimum (roughly ending between the 2nd and 4th centuries AD) are well- documented and are considered contributing stressors (among many others) to challenges faced by the Roman Empire.

These shifts interacted with disease, politics, economics, and migrations rather than acting as a sole cause of decline.

Main Cooling Phases and Transitions

End of the Roman Climatic Optimum / early instability (from ~AD 130- 200 onward): Gradual transition from the warm, relatively stable, and often humid conditions of the Optimum. Proxy records (tree rings, marine sediments, speleothems, ice cores) show increased variability, with cooler and sometimes drier intervals. A high-resolution southern Italian marine record indicates instability and cooling from ~AD 100, more notably after ~130, with pronounced cold phases ~160-180 and ~245-275.

3rd- century cooling and Crisis of the Third Century (~AD 235- 284, peaking around 250- 275): Cooler and more arid conditions in parts of Italy and the Mediterranean overlapped with political fragmentation, military anarchy, economic troubles, and the Plague of Cyprian (~251- 266). Settlement contraction occurred in Italy. Climate stress is viewed as one amplifying factor in this multifaceted crisis.

4th- century partial recovery: A shorter interval of more favorable conditions aligned with imperial recovery and reorganization under emperors such as Constantine and others.

Late Antique Little Ice Age (LALIA, ~AD 536- 660): A sharp, severe, Northern Hemisphere- wide cooling triggered primarily by a cluster of major volcanic eruptions (notably 536, 540, and 547 AD), possibly amplified by ocean/sea- ice feedback and a solar minimum. Summer temperatures dropped substantially (reconstructions show averages ~1.5- 3ยฐC or more below prior peaks in some records; southern Italian data indicate ~3ยฐC colder than Optimum highs in the late 6th century). This was one of the coldest multi-decadal intervals of the last 2,000 years

Key Impacts of Cooling

Agriculture and food supply:

  • Shorter growing seasons, increased frost risk, and shifts in precipitation reduced yields of key crops. Modeling studies estimate substantial declines: e.g., average wheat yields potentially ~50% lower and grape yields ~70% and lower in some Mediterranean/Italian locations during LALIA conditions compared with the Optimum.
  • Harvest failures contributed to famines, higher grain prices or import costs in parts of the empire, and strain on urban food systems (Rome and other cities depended heavily on reliable surpluses from Italy, North Africa, Egypt, Sicily, etc.).
  • Northward or higher- elevation cultivation that had expanded under warmer conditions became less viable.

Disease and demography:

  • Cold/dry periods strongly coincided with major pandemics: Antonine Plague (~165- 180), Plague of Cyprian (~251- 266), and especially the Plague of Justinian (starting 541- 542, first wave of the First Plague Pandemic caused by Yersinia pestis). Cooling likely disrupted ecosystems (affecting rodent hosts and flea vectors), stressed populations via poorer nutrition, and facilitated disease spread amid migration and conflict.
  • Demographic losses compounded economic and military pressures; the Justinianic plague alone caused massive mortality across the Eastern (Byzantine) Empire and beyond.

Society, politics, and migrations:

  • Agricultural shortfalls and economic strain weakened state revenues, military logistics, and urban vitality.
  • Cooler/drier conditions on the empireโ€™s periphery and in steppe regions (linked in some studies to North Atlantic Oscillation shifts) acted as โ€œpushโ€ factors for migrations and invasions (e.g., associated with movements involving Goths, other groups in the Migration Period, and broader Eurasian upheavals).
  • In the East, LALIA cooling overlapped with the transformation of the Eastern Roman/Byzantine Empire, wars, territorial losses, and the eventual rise of new powers; similar stresses affected the Sasanian Empire and other Eurasian societies.
  • Overall, the shift from the supportive Optimum climate to more hostile variability and cold helped erode the environmental foundations that had aided earlier prosperity, interacting with internal weaknesses and external pressures.

Causes of the Cooling

Primarily natural: declining solar irradiance in some intervals, increased volcanic activity (especially the 6th-century cluster that dimmed sunlight for years, โ€œthe sun gave forth its light without brightness, like the moonโ€, as Procopius described in 536), and possible ocean feedback. These were independent of human activity.

Important Caveats

Climate was a contributing environmental stressor, not a deterministic โ€œcauseโ€ of the fall of the Western Empire (476) or later Byzantine challenges.

Historians emphasize multifactorial explanations: political instability, overextension, economic issues, military pressures, institutional changes, and pandemics. Regional differences mattered, the East often adapted differently or recovered better in some periods. Proxy data continue to be refined, and absolute magnitudes/regional expressions vary.

In short, the transition from the relatively benign Roman Climatic Optimum to phases of cooling and instability (especially the severe LALIA) reduced agricultural reliability, amplified disease impacts, and added pressure during already turbulent centuries, forming part of the complex environmental backdrop to late Roman and early medieval transformations.

The Roman Warm Period (RWP, or Roman Climatic Optimum, roughly 250 BC- AD 400) was a multi-century phase of relatively warm conditions mainly in Europe, the Mediterranean, and the North Atlantic. Comparisons to today must distinguish regional vs. global scales, proxy uncertainties, and rates of change.

Temperature Comparison

Regional (Europe/Mediterranean): Some high- resolution proxies, especially Mediterranean Sea- surface temperatures (e.g., Sicily Channel and western Mediterranean records), indicate the RWP was among the warmest intervals of the last ~2,000 years in those areas, often estimated ~1- 2ยฐC warmer than late pre-industrial or mid- 20th- century averages in specific locations. Certain studies describe Roman- period SSTs as the warmest of the past two millennia in parts of the central/western Mediterranean, with peaks roughly 2ยฐC above late- century pre- modern values. Alpine glaciers were relatively small (comparable in some reconstructions to early 21st- century extents), and warmth- loving species or crops expanded northward.

Global scale: multi- proxy syntheses (e.g., PAGES 2k) show that pre-industrial warm intervals like the RWP (and the Medieval Warm Period) were primarily regional, not globally synchronous or coherent. Global mean surface temperatures during the RWP were not higher than the present day. Recent decades (especially post- 2010s, including years through the mid- 2020s) have been warmer globally than any multi-decadal period in the last 2,000 years according to large-scale reconstructions. Global warming since the late 19th century is ~1.1- 1.5ยฐC above 1850- 1900 pre- industrial levels, with the most recent years setting successive records.

Proxy data (tree rings, sediments, speleothems, etc.) have uncertainties of roughly ยฑ0.5-1.5ยฐC or more depending on the record and region, and they often reconstruct seasonal or local signals rather than annual global means. Instrumental records since the mid-19th century provide far higher precision.

Key Differences from Today

AspectRoman Warm PeriodPresent Day (earlyโ€“mid 21st century)
Spatial extentRegional (strongest in Europe/Med/N. Atlantic)Global, nearly all regions warming
Rate of changeGradual, multi- centuryVery rapid (~0.2ยฐC per decade recently; faster than any 50-year period in at least the last 2,000 years)
Primary driversNatural (solar irradiance, low volcanism, ocean dynamics)Dominantly anthropogenic greenhouse gases (COโ‚‚, etc.), with natural factors secondary
COโ‚‚ levels~280 ppm (pre- industrial Holocene range)~420 and more ppm (rising rapidly)
StabilityRelatively stable for centuries in key regionsIncreasing extremes, rapid shifts
ContextWithin natural Holocene variabilityOutside the range of the last ~2,000 years globally; continuing upward trend

Other Factors

Hydrology and extremes: The RWP was often associated with relatively humid/stable conditions favorable to Mediterranean agriculture in many records. Todayโ€™s warming includes changes in precipitation patterns, more intense heat extremes, and other impacts not identical to the RWP.

Sea level and cryosphere: Modern sea- level rise and glacier/ice- sheet responses are driven by the current rapid warming and are ongoing; RWP glacier extents were reduced regionally but without the same global ice- volume implications.

Rate matters: The speed of modern warming is a critical distinction. Natural past changes of similar magnitude typically unfolded over centuries to millennia, allowing more time for ecosystems and societies to adjust. Current change is occurring within a human lifetime and continues.

In summary, parts of the Mediterranean and Europe experienced warmth during the RWP that was comparable to or locally exceeded mid- to- late 20th- century levels and ranked among the warmest of the last two millennia regionally.

However, todayโ€™s climate is warmer globally, the warming is far more rapid and widespread, and it is driven primarily by human greenhouse-gas emissions rather than natural forcings. Large- scale reconstructions indicate that recent global temperatures surpass those of the RWP and other pre- industrial warm intervals of the last 2,000 years.

The Cooling Also Not Our Faultย 2025

Illustration of global ocean currents, showing red and blue arrows representing warm and cold water flows across the world map.

From Science Matters

Byย Ron Clutz

A diagram of ocean currents in the North Atlantic, showing various straits and basins, including the Denmark Strait, Davis Strait, and North Atlantic Current, with arrows indicating the flow direction.

With the lack of global warming and the steep decline of SSTs the last 2 years, climatists are pivoting to the notion invented by the infamous M. Mann, AKA Mr. Hockey Stick (aiming to erase the Medieval warming period).ย  The reasoning is convoluted, as you might expect given the intent to blame cold weather on global warming.ย  The claim is that burning fossil fuels causes the North Atlantic Current to slow down and bring cold temperatures to the Northern Hemisphere.ย  The video below is an excellent PR piece promoting this science fiction as though it were fact.

Science Facts to Counter Science Fiction

Natural variability has dominated Atlantic Meridional Overturning Circulation since 1900
Mojib Latif et al. published April 2022 Nature Climate Change.  Excerpts in italics with my bolds.

Abstract

There is debate about slowing of the Atlantic Meridional Overturning Circulation (AMOC), a key component of the global climate system. Some focus is on the sea surface temperature (SST) slightly cooling in parts of the subpolar North Atlantic despite widespread ocean warming. Atlantic SST is influenced by the AMOC, especially on decadal timescales and beyond. The local cooling could thus reflect AMOC slowing and diminishing heat transport, consistent with climate model responses to rising atmospheric greenhouse gas concentrations.

Here we show from Atlantic SST the prevalence of natural AMOC variability since 1900. This is consistent with historical climate model simulations for 1900โ€“2014 predicting on average AMOC slowing of about 1โ€‰Sv at 30ยฐโ€‰N after 1980, which is within the range of internal multidecadal variability derived from the modelsโ€™ preindustrial control runs. These results highlight the importance of systematic and sustained in-situ monitoring systems that can detect and attribute with high confidence an anthropogenic AMOC signal.

Main

Global surface warming (global warming hereafter) since the beginning of the twentieth century is unequivocal, and humans are the main cause through the emission of vast amounts of greenhouse gases (GHGs), especially carbon dioxide (CO2)1,2,3. The oceans have stored more than 90% of the heat trapped in the climate system caused by the accumulation of GHGs in the atmosphere, thereby contributing to sea-level rise and leading to more frequent and longer lasting marine heat waves4. Moreover, the oceans have taken up about one third of the total anthropogenic CO2 emissions since the start of industrialization, causing ocean acidification5. Both ocean warming and acidification already have adverse consequences for marine ecosystems6. Some of the global warming impacts, however, unfold slowly in the ocean due to its large thermal and dynamical inertia. Examples are sea-level rise and the response of the Atlantic Meridional Overturning Circulation (AMOC), a three-dimensional system of currents in the Atlantic Ocean with global climatic relevance7,8,9,10.

[Comment: The paragraph above is the obligatory statement of fidelity to the Climatist Creed. All the foundational claims are affirmed with references to prove the authors above reproach, and not to be dismissed as denialists.  As further evidence of their embrace of IPCC consensus science, consider the diagrams below.

Graphs depicting sea surface temperature (SST) anomalies from various datasets over time, illustrating trends in the North Atlantic region and their implications for climate study.

a, The NAWH SST index (ยฐC), defined as the annual SST anomalies averaged over the region 46ยฐโ€‰Nโ€“62ยฐโ€‰N and 46ยฐโ€‰Wโ€“20ยฐโ€‰W. Observations for 1900โ€“2019 from ERSSTv.5 (orange) and Kaplan SST v.2 (yellow), and ensemble-mean SST for 1900โ€“2014 (dark blue line) from the historical simulations with the CMIP6 models and the individual historical simulations (thin grey lines) are shown. b, Same as a but for the NA-SST index (ยฐC), defined as the annual SST anomalies averaged over the region 40ยฐโ€‰Nโ€“60ยฐโ€‰N and 80ยฐโ€‰Wโ€“0ยฐโ€‰E. c, Same as a but for the AMO/V (ยฐC) index, defined as the 11-year running mean of the annual SST anomalies averaged over the region 0ยฐโ€‰Nโ€“65ยฐโ€‰N and 80ยฐโ€‰Wโ€“0ยฐโ€‰E. The SST indices in aโ€“c are calculated as area-weighted means. d, NAO index (dimensionless) for 1900โ€“2019 (red), defined as the difference in the normalized winter (Decemberโ€“March) sea-level pressure between Lisbon (Portugal) and Stykkisholmur/Reykjavik (Iceland). The blue curve indicates the equivalent CO2 radiative forcing (Wโ€‰mโˆ’2) for 1900โ€“2019, which is taken from the Representative Concentration Pathway (RCP) SSP5-8.5 after 2014.

Chart d shows the NAO fluxes compared to a CO2 forcing curve based upon the much criticized RCP 8.5 scenario, which is not โ€œbusiness-as-usualโ€ but rather โ€œbusiness-impossible.โ€ Using it shows the authors bending over backwards to give every chance for confirming the alarming slowdown narrative.  The next paragraph gives the entire game away]

Climate models predict substantial AMOC slowing if atmospheric GHG concentrations continue to rise unabatedly1,11,12,13,14. Substantial AMOC slowing would drive major climatic impacts such as shifting rainfall patterns on land15, accelerating regional sea-level rise16,17 and reducing oceanic CO2 uptake. However, it is still unclear as to whether sustained AMOC slowing is underway18,19,20,21,22. Direct ocean-circulation observation in the North Atlantic (NA) is limited9,23,24,25,26,27. Inferences drawn about the AMOCโ€™s history from proxy data28 or indices derived from other variables, which may provide information about the circulationโ€™s variability (for example, sea surface temperature (SST)21,29,30, salinity31 or Labrador Sea convection32), are subject to large uncertainties.

Discussion

Observed SSTs and a large ensemble of historical simulations with state-of-the-art climate models suggest the prevalence of internal AMOC variability since the beginning of the twentieth century. Observations and individual model runs show comparable SST variability in the NAWH region. However, the modelsโ€™ ensemble-mean signal is much smaller, indicative of the prevalence of internal variability. Further, most of the SST cooling in the subpolar NA, which has been attributed to anthropogenic AMOC slowing21, occurred during 1930โ€“1970, when the radiative forcing did not exhibit a major upward trend. We conclude that the anthropogenic signal in the AMOC cannot be reliably estimated from observed SST. A linear and direct relationship between radiative forcing and AMOC may not exist. Further, the relevant physical processes could be shared across EOF modes, or a mode could represent more than one process.

A relatively stable AMOC and associated northward heat transport during the past decades is also supported by ocean syntheses combining ocean general circulation models and data76,77, hindcasts with ocean general circulation models forced by observed atmospheric boundary conditions78 and instrumental measurements of key AMOC components9,22,79,80,81.

Neither of these datasets suggest major AMOC slowing since 1980, and neither of the AMOC indices from Rahmstorf et al.20 or Caesar et al.21 show an overall AMOC decline since 1980.

Contextual Background

From the Energy MIx Changes in Atlantic Current May Fall Within Natural Variability.  

In the February, 2022, edition of the journal Nature Geoscience, researchers at the University of Maryland Center for Environmental Science urged more detailed study of the notoriously complex Atlantic Meridional Overturning Circulation (AMOC). Now, oceanographer Mojib Latif and his team from the GEOMAR Helmholtz Centre for Ocean Research in Kiel, Germany are repeating that call in a paper just published in the journal Nature Climate Change.

The latest study describes the AMOC as a โ€œthree-dimensional system of current in the Atlantic Ocean with global climatic relevance.โ€

The February study responded to an August 2021 warning from the Potsdam Institute
that the AMOC has become wildly unstable and dangerously weak
due to global warming caused by human activity.

The authors of the latest study affirm that the Earthโ€™s oceans have taken up more than 90% of the accumulated heat and roughly a third of all CO2 emissions since the dawn of the industrial age, leading to clearly measurable and devastating impacts like marine heat waves, sea level rise, and ocean acidification.

But it isnโ€™t easy to confirm that the Atlantic circulation is actually slowing, partly because the ocean possesses such โ€œlarge thermal and dynamical inertia.โ€

It is also extremely difficult to directly observe ocean circulation patterns in the North Atlantic, and proxies like sea surface temperature are โ€œsubject to large uncertainties,โ€ the scientists say. Based on the available data, the GEOMAR study attributes localized sea surface cooling in the North Atlantic since 1900 to natural AMOC variabilityโ€”not, as had been hypothesized, to a global heating-induced breakdown in the AMOCโ€™s capacity to transfer heat.

Footnote:

See also from Science Norway Researchers and the media need to stop crying โ€˜wolfโ€™ about the Gulf Stream

Arctic Warming Will Lead To Arctic Cooling, Recent Study Suggests

Aย recent paper explainsย how a weaker Atlantic Meridional Overturning Circulation (AMOC) could actually reduce Arctic warming by the end of the centuryโ€ฆ

From NoTrickZone

Byย P Gosselin

A recent paper explains how a weaker Atlantic Meridional Overturning Circulation (AMOC) could actually reduce Arctic warming by the end of the centuryโ€ฆ

โ€ฆdespite the overall trend of Arctic amplification (โ€œthe disproportionate warming of the Arctic compared to the global average.โ€)

Symbol image. Source: NASA

The study shows that a weakening AMOC can partially counteract Arctic amplification, leading to a less severe warming trend in the Arctic, especially in the cold months and near the North Atlantic.

The authors claim a weaker AMOC leads to less sea ice melting, which means the Arctic surface remains brighter (higher albedo), reflecting more sunlight and causing less warming.

Moreover, a slowdown in AMOC causes the ocean to absorb more heat, leading to cooler surface temperature and can also lead to more cooling from the surface up to the mid-troposphere in the Arctic.

The weaker AMOC also increases low-level clouds over the โ€œNorth Atlantic warming hole,โ€ causing significant localized cooling by reflecting sunlight.

In essence, while Arctic amplification is a major concern, this research suggests that a weakening AMOC could unexpectedly slow down some of that warming through a complex interplay of ice, ocean, and atmospheric changes.

Not warming everywhere

Some areas have been experiencing or are forecast to experience colder than normal temperatures around June 2025:

  • North Atlantic Ocean, south of Greenland (North Atlantic Warming Hole):ย This region has been a persistent โ€œcold spotโ€ defying global warming.
  • Eastern Europe:ย Specifically from eastern Italy and the Balkans to Finland, below-average temperatures were noted in May 2025.
  • India:ย Experienced below-average temperatures in May 2025.
  • Alaska:ย Monthly temperatures are favored to be below-normal for June 2025.
  • Southern Africa:ย Saw below-average temperatures in May 2025.
  • Eastern Antarctica:ย Also experienced negative temperature anomalies in May 2025.
  • Hudson Bay:ย Negative anomalies were recorded in this region in May 2025.
  • Ukraine (Western parts):ย Late spring cold spells impacted rapeseed yields in the west.
  • Parts of the Southern and Central Great Plains (USA):ย this specific area has equal chances for warm, cool, or near-average conditions.
  • Maritimes (Canada):ย Forecast to have cooler-than-normal temperatures for the summer of 2025.

Itโ€™s important to note that global temperatures are generally trending upwards, and even in record-warm years, there can be regional variations and areas experiencing colder-than-normal conditions due to complex atmospheric and oceanic patterns.

New Study Documents Significant Cooling Across Eurasia Since 2004

Cooling trends of up to -2.15ยฐC per decade are not consistent with the โ€œglobal warmingโ€ narrative.

From NoTrickZone

Byย Kenneth Richardย 

Cooling trends of up to -2.15ยฐC per decade are not consistent with the โ€œglobal warmingโ€ narrative.

According to a new study (Li et al., 2025), 98% of the Central Eurasia study area (40-65ยฐN and 50-130ยฐE) experienced significantly declining temperatures from 2004-2020.

Specifically, the region cooled by nearly -2.0ยฐC โ€“ a rate of -1.425ยฐC per decade โ€“ from 2004 to 2018.

The authors attribute the cooling trend to a 5.38% per decade increase in snow cover percentage (SCP) across the study area.

Image Source:ย Li et al., 2025

Antarctic Wilkes Land-Queen Mary Region Sees 100 Billion Tonne Ice Mass Increase

Recent studies shows that the Arctic and Antarctic have cooled over the past 2 decades, and that ice mass has gained in the Antarctic Wilkes Land-Queen Mary Land region.

From NoTrickZone

Byย P Gosselin

Recent studies shows that the Arctic and Antarctic have cooled over the past 2 decades, and that ice mass has gained in the Antarctic Wilkes Land-Queen Mary Land region.

Hat-tip: TKP

The study, โ€œSpatiotemporal mass change rate analysis from 2002 to 2023 over the Antarctic Ice Sheet and four glacier basins in Wilkes-Queen Mary Landโ€ in the journal Science China Earth Sciences authored by Wei Wang et al looked at the AIS mass change series from April 2002 to December 2023 with the focus on four glacier basins in the Wilkes Land-Queen Mary Land (WL-QML) region: Denman, Moscow, Totten, and Vincennes Bay glacier basins.

Chart source:ย TKP

Recent ice mass growth

In the period of 2002-2010, there was moderate ice loss of -73.79 ยฑ 56.27 gigatons per year, which contributed to 0.20 ยฑ 0.16 mm per year to global sea level rise.

From 2011-2020 there was almost twice as much ice loss of -142.06 ยฑ 56.12 gigatons per year, contributing 0.39 ยฑ 0.15 mm per year to global sea level rise.

But in the period of 2021-2023, there was a surprising a mass gain of 107.79 ยฑ 74.90 gigatons per year that offset global sea level rise by 0.30 ยฑ 0.21 mm per year.

 Cooling at rate of 5ยฐC per century since early 1980s 

In a study published in 2023, โ€œSignificant West Antarctic Cooling in the Past Two Decades Driven by Tropical Pacific Forcingโ€, authored by Xueying Zhang et al, analyses showed that the West Antarctic cooled over the past 2 decades: โ€œIn particular, during 1999โ€“2018, the observed annual average surface air temperature had decreased at a statistically significant rate, with the strongest cooling in austral spring.โ€

The results show that most of the Antarctic continent has cooled by 2 ยฐC since the early 1980s. That translates into a rate of 5ยฐC per century.

Ocean Remains Cooler Novemberย 2024

Note that in 2015-2016 the Tropics and SH peaked in between two summer NH spikes.ย  That pattern repeated in 2019-2020 with a lesser Tropics peak and SH bump, but with higher NH spikes. By end of 2020, cooler SSTs in all regions took the Global anomaly well below the mean for this period.ย  A small warming was driven by NH summer peaks in 2021-22, but offset by cooling in SH and the tropics, By January 2023 the global anomaly was again below the mean.

From Science Matters

Byย Ron Clutz

The best context for understanding decadal temperature changes comes from the worldโ€™s sea surface temperatures (SST), for several reasons:

  • The ocean covers 71% of the globe and drives average temperatures.
  • SSTs have a constant water content, (unlike air temperatures), so give a better reading of heat content variations.
  • Major El Ninos have been the dominant climate feature in recent years.

HadSST is generally regarded as the best of the global SST data sets, and so the temperature story here comes from that source. Previously I used HadSST3 for these reports, but Hadley Centre has made HadSST4 the priority, and v.3 will no longer be updated.  HadSST4 is the same as v.3, except that the older data from ship water intake was re-estimated to be generally lower temperatures than shown in v.3.  The effect is that v.4 has lower average anomalies for the baseline period 1961-1990, thereby showing higher current anomalies than v.3. This analysis concerns more recent time periods and depends on very similar differentials as those from v.3 despite higher absolute anomaly values in v.4.  More on what distinguishes HadSST3 and 4 from other SST products at the end. The user guide for HadSST4 is here.

The Current Context

The chart below shows SST monthly anomalies as reported in HadSST4 starting in 2015 through November 2024.ย  A global cooling pattern is seen clearly in the Tropics since its peak in 2016, joined by NH and SH cycling downward since 2016, followed by rising temperatures in 2023 and 2024.

Note that in 2015-2016 the Tropics and SH peaked in between two summer NH spikes.  That pattern repeated in 2019-2020 with a lesser Tropics peak and SH bump, but with higher NH spikes. By end of 2020, cooler SSTs in all regions took the Global anomaly well below the mean for this period.  A small warming was driven by NH summer peaks in 2021-22, but offset by cooling in SH and the tropics, By January 2023 the global anomaly was again below the mean.

Now in 2023-24 came an event resembling 2015-16 with a Tropical spike and two NH spikes alongside, all higher than 2015-16. There was also a coinciding rise in SH, and the Global anomaly was pulled up to 1.1ยฐC last year, ~0.3ยฐ higher than the 2015 peak.  Then NH started down autumn 2023, followed by Tropics and SH descending 2024 to the present. After 10 months of cooling in SH and the Tropics, the Global anomaly was back down, led by NH cooling the last 3 months from its peak in August.

Comment:

The climatists have seized on this unusual warming as proof their Zero Carbon agenda is needed, without addressing how impossible it would be for CO2 warming the air to raise ocean temperatures.  It is the ocean that warms the air, not the other way around.  Recently Steven Koonin had this to say about the phonomenon confirmed in the graph above:

El Nino is a phenomenon in the climate system that happens once every four or five years.  Heat builds up in the equatorial Pacific to the west of Indonesia and so on.  Then when enough of it builds up it surges across the Pacific and changes the currents and the winds.  As it surges toward South America it was discovered and named in the 19th century  It iswell understood at this point that the phenomenon has nothing to do with CO2.

Now people talk about changes in that phenomena as a result of CO2 but itโ€™s there in the climate system already and when it happens it influences weather all over the world.   We feel it when it gets rainier in Southern California for example.  So for the last 3 years we have been in the opposite of an El Nino, a La Nina, part of the reason people think the West Coast has been in drought.

It has now shifted in the last months to an El Nino condition that warms the globe and is thought to contribute to this Spike we have seen. But there are other contributions as well.  One of the most surprising ones is that back in January of 2022 an enormous underwater volcano went off in Tonga and it put up a lot of water vapor into the upper atmosphere. It increased the upper atmosphere of water vapor by about 10 percent, and thatโ€™s a warming effect, and it may be that is contributing to why the spike is so high.

A longer view of SSTs

Open image in new tab to enlarge.

The graph above is noisy, but the density is needed to see the seasonal patterns in the oceanic fluctuations.  Previous posts focused on the rise and fall of the last El Nino starting in 2015.  This post adds a longer view, encompassing the significant 1998 El Nino and since.  The color schemes are retained for Global, Tropics, NH and SH anomalies.  Despite the longer time frame, I have kept the monthly data (rather than yearly averages) because of interesting shifts between January and July. 1995 is a reasonable (ENSO neutral) starting point prior to the first El Nino. 

The sharp Tropical rise peaking in 1998 is dominant in the record, starting Jan. โ€™97 to pull up SSTs uniformly before returning to the same level Jan. โ€™99. There were strong cool periods before and after the 1998 El Nino event. Then SSTs in all regions returned to the mean in 2001-2. 

SSTS fluctuate around the mean until 2007, when another, smaller ENSO event occurs. There is cooling 2007-8,  a lower peak warming in 2009-10, following by cooling in 2011-12.  Again SSTs are average 2013-14.

Now a different pattern appears.  The Tropics cooled sharply to Jan 11, then rise steadily for 4 years to Jan 15, at which point the most recent major El Nino takes off.  But this time in contrast to โ€™97-โ€™99, the Northern Hemisphere produces peaks every summer pulling up the Global average.  In fact, these NH peaks appear every July starting in 2003, growing stronger to produce 3 massive highs in 2014, 15 and 16.  NH July 2017 was only slightly lower, and a fifth NH peak still lower in Sept. 2018.

The highest summer NH peaks came in 2019 and 2020, only this time the Tropics and SH were offsetting rather adding to the warming. (Note: these are high anomalies on top of the highest absolute temps in the NH.)  Since 2014 SH has played a moderating role, offsetting the NH warming pulses. After September 2020 temps dropped off down until February 2021.  In 2021-22 there were again summer NH spikes, but in 2022 moderated first by cooling Tropics and SH SSTs, then in October to January 2023 by deeper cooling in NH and Tropics.  

Then in 2023 the Tropics flipped from below to well above average, while NH produced a summer peak extending into September higher than any previous year.  Despite El Nino driving the Tropics January 2024 anomaly higher than 1998 and 2016 peaks, following months cooled in all regions, and the Tropics continued cooling in April, May and June along with SH dropping.  After July and August NH warming again pulled the global anomaly higher, September and October resumed cooling in all regions.

What to make of all this? The patterns suggest that in addition to El Ninos in the Pacific driving the Tropic SSTs, something else is going on in the NH.  The obvious culprit is the North Atlantic, since I have seen this sort of pulsing before.  After reading some papers by David Dilley, I confirmed his observation of Atlantic pulses into the Arctic every 8 to 10 years.

Contemporary AMO Observations

Through January 2023 I depended on the Kaplan AMO Index (not smoothed, not detrended) for N. Atlantic observations. But it is no longer being updated, and NOAA says they donโ€™t know its future.  So I find that ERSSTv5 AMO dataset has current data.  It differs from Kaplan, which reported average absolute temps measured in N. Atlantic.  โ€œERSST5 AMO  follows Trenberth and Shea (2006) proposal to use the NA region EQ-60ยฐN, 0ยฐ-80ยฐW and subtract the global rise of SST 60ยฐS-60ยฐN to obtain a measure of the internal variability, arguing that the effect of external forcing on the North Atlantic should be similar to the effect on the other oceans.โ€  So the values represent sst anomaly differences between the N. Atlantic and the Global ocean.

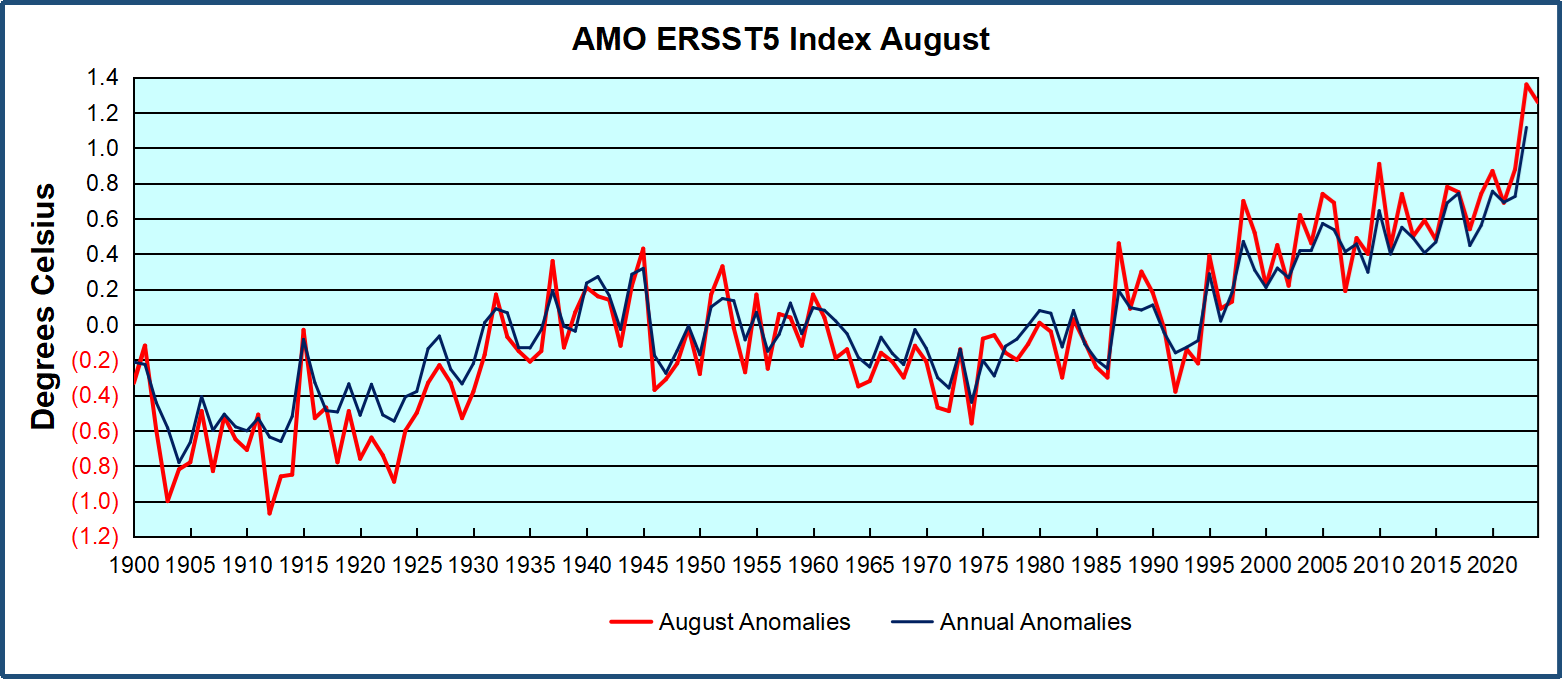
The chart above confirms what Kaplan also showed.ย  As August is the hottest month for the N. Atlantic, its variability, high and low, drives the annual results for this basin.ย  Note also the peaks in 2010, lows after 2014, and a rise in 2021. Then in 2023 the peak was holding at 1.4C before declining.ย  An annual chart below is informative:

Note the difference between blue/green years, beige/brown, and purple/red years.  2010, 2021, 2022 all peaked strongly in August or September.  1998 and 2007 were mildly warm.  2016 and 2018 were matching or cooler than the global average.  2023 started out slightly warm, then rose steadily to an  extraordinary peak in July.  August to October were only slightly lower, but by December cooled by ~0.4C.

Then in 2024 the AMO anomaly started higher than any previous year, then leveled off for two months declining slightly into April.  Remarkably, May showed an upward leap putting this on a higher track than 2023, and rising slightly higher in June.  In July, August and September 2024 the anomaly declined, and despite a small rise in October, is now lower than the peak reached in 2023.

The pattern suggests the ocean may be demonstrating a stairstep pattern like that we have also seen in HadCRUT4.ย 

The purple line is the average anomaly 1980-1996 inclusive, value 0.18.  The orange line the average 1980-202404, value 0.39, also for the period 1997-2012. The red line is 2013-202409, value 0.69. As noted above, these rising stages are driven by the combined warming in the Tropics and NH, including both Pacific and Atlantic basins.

See Also:

Curiosity:  Solar Coincidence?

The news about our current solar cycle 25 is that the solar activity is hitting peak numbers now and higher than expected 1-2 years in the future.ย  As livescience put it:ย ย Solar maximum could hit us harder and sooner than we thought. How dangerous will the sunโ€™s chaotic peak be?ย ย Some charts fromย spaceweatherliveย look familar to these sea surface temperature charts.

Summary

The oceans are driving the warming this century.  SSTs took a step up with the 1998 El Nino and have stayed there with help from the North Atlantic, and more recently the Pacific northern โ€œBlob.โ€  The ocean surfaces are releasing a lot of energy, warming the air, but eventually will have a cooling effect.  The decline after 1937 was rapid by comparison, so one wonders: How long can the oceans keep this up? And is the sun adding forcing to this process?

Space weather impacts the ionosphere in this animation. Credits: NASA/GSFC/CIL/Krystofer Kim

Footnote: Why Rely on HadSST4

HadSST is distinguished from other SST products because HadCRU (Hadley Climatic Research Unit) does not engage in SST interpolation, i.e. infilling estimated anomalies into grid cells lacking sufficient sampling in a given month. From reading the documentation and from queries to Met Office, this is their procedure.

HadSST4 imports data from gridcells containing ocean, excluding land cells. From past records, they have calculated daily and monthly average readings for each grid cell for the period 1961 to 1990. Those temperatures form the baseline from which anomalies are calculated.

In a given month, each gridcell with sufficient sampling is averaged for the month and then the baseline value for that cell and that month is subtracted, resulting in the monthly anomaly for that cell. All cells with monthly anomalies are averaged to produce global, hemispheric and tropical anomalies for the month, based on the cells in those locations. For example, Tropics averages include ocean grid cells lying between latitudes 20N and 20S.

Gridcells lacking sufficient sampling that month are left out of the averaging, and the uncertainty from such missing data is estimated. IMO that is more reasonable than inventing data to infill. And it seems that the Global Drifter Array displayed in the top image is providing more uniform coverage of the oceans than in the past.

USS Pearl Harbor deploys Global Drifter Buoys in Pacific Ocean

New Study: Over The Last 8000 Years Centennial-Scale Megadrought Periods Were Driven by Cooling

Paleoclimate evidence affirms warmth reduces drought frequency and intensity.

Aย new studyย utilizes Asian tree pollen records to affirm that for the last 8000 years centennial-scale warming periods were associated with reductions in drought, famines, crop failures.

From NoTrickZone

Byย Kenneth Richardย 

Paleoclimate evidence affirms warmth reduces drought frequency and intensity.

A new study utilizes Asian tree pollen records to affirm that for the last 8000 years centennial-scale warming periods were associated with reductions in drought, famines, crop failures.

โ€œโ€ฆwarm periods were associated with increased precipitation along with relatively short-lived drought events.โ€

In contrast, centuries of cooling (e.g., the Little Ice Age) induced โ€œextreme drought conditions,โ€ or megadrought, and thus widespread ecological hardship.

โ€œโ€ฆa cooling trend in the Northern Hemisphere may result in persistent extreme drought conditions in arid tropical regions.โ€

Since warming is associated with more rainfall, and cooling induces drought, it is interesting that the modern trends are the opposite of what would be anticipated with a warming climate. Despite lower CO2 levels in the first half of the 20th century there was more precipitation (warmer) from 1900-1960s and less precipitation (cooling) from the 1970s to 1990s.

โ€œโ€ฆrelatively high annual precipitation before 1970 which was linked to relatively high tree pollen percentages. However, from the 1970s to the mid-1990s, both the tree pollen percentages and annual precipitation decreasedโ€

The authors conclude that there should not be an emphasis on the dangers of global warming, but, considering the environmental consequences, โ€œit is also important to address the potential hazards associated with cooling.โ€

Image Source:ย Li et al., 2024

New Study: 21st Century Megadrought In The SW USA Caused By 45 Years Of East/Central Pacific Cooling

Climate models failed to simulate the observed 1970-2014 Pacific Ocean cooling. The 21stย century southwestern US megadrought has been linked to this cooling, which โ€œmay have been caused by a forced response to greenhouse gas emissions.โ€

From NoTricksZone

Byย Kenneth Richard

Climate models failed to simulate the observed 1970-2014 Pacific Ocean cooling. The 21stย century southwestern US megadrought has been linked to this cooling, which โ€œmay have been caused by a forced response to greenhouse gas emissions.โ€

A new study provides a fresh look at the circular, self-contradictory reasoning that proponents of the anthropogenic global warming (AGW) narrative routinely employ.

The authors acknowledge that the Central and East Pacific region has been cooling since 1970, and that climate models failed to simulate this cooling. The modeling failure stems from the assumption that rising greenhouse gas emissions lead to warming, not over four decades of cooling.

โ€œWhile AO-GCMs [climate models] predicted a warming SST trend in the Central and East Pacific, the region instead experienced a cooling SST trend from 1970 to 2014โ€ฆโ€

After insisting that โ€œinternal atmospheric variability has a larger role than SST forcing in explaining SWUS [Southwestern United States] precipitation variance,โ€ and that โ€œmost historical droughts are unrelated to SST [sea surface temperature] forcing,โ€ the authors nonetheless pivot, explaining that only during recent decades is the SWUS megadrought causally linked to SST forcing.

โ€œIn this study, we confirmed the connection between the Equatorial Pacific SST trend pattern and SWUS precipitation trends with Greenโ€™s function approach, which allows us to establish a causal link between SST and precipitation.โ€

But the SST forcing that suddenly explains recent SWUS drought trends (after not explaining these trends historically) is not the sign expected with rising greenhouse gas (GHG) emissions. No, drought has not been caused by warmer SSTs, but cooler SSTs. They say warmer SSTs will lead to a wetter climate, or less drought.

โ€œโ€ฆa cooling SST trend from 1970 to 2014โ€ฆwhich potentially led to the observed megadrought in the SWUS due to a decrease in precipitation.โ€

โ€œIf the Central and East Pacific continue cooling, a prolonged period of drought is more likely to continue in the SWUS.โ€

However, in the future, warmer East and Central Pacific SSTs due to rising GHGs are expected (according to modeling) to cause less precipitation, or more SWUS drought. So over 40 years of cooling explains drought now, but sometime in the future warming will explain droughtโ€ฆeven though neither warming or cooling SSTs explained SWUS drought historically.

โ€œAt least part of the megadrought was related to a lack of precipitation from the cooling Central and East Pacific, rather than due to a significant increase in evapotranspiration from global warming, which will likely cause droughts in the future as anthropogenic climate change worsens.โ€

But itโ€™s worse than we thought. The authors assert the cooling SSTs causally linked to the 1970s-to-present SWUS megadrought โ€“ but that may not be the cause of drought in the future โ€“ may be explained by โ€“ yes, indeed โ€“ rising GHG concentrations. GHG forcing leads to warming SSTs โ€“ which, again, may not cause drought now, but may in the future. And yet the recent decades of cooling SSTs may be a response to the rising GHGs too. Rising GHG concentrations may simultaneously cause warming SSTs and cooling SSTs.

โ€œThe cooling of the Central and East Pacific not simulated by AO-GCMs [climate models] may have been caused by a forced response to greenhouse gas emissions.โ€

So letโ€™s review what the authors found with a โ€œPlain Language Summaryโ€ of own.

Until recent decades, internal atmospheric variability explained historical trends in drought. Warming or cooling SST trends did not. Then, in recent decades, a cooling SST trend (1970-2014) has been โ€œconfirmedโ€ as the causal link to the SWUS megadrought. In the future, however, warming SSTs may cause SWUS megadrought. And both the warming and cooling trends in the SWUS are (and have been) caused by the same mechanism: rising GHGs.

It would appear the modern version of what constitutes peer-reviewed โ€œclimate scienceโ€ has devolved into something resembling more of a creative writing exercise than actual science.

Image Source:ย Alessi and Rugenstein, 2024

………………………………………………………………………………………………………………………………………………………………….

The Atlantic Is Cooling at a Mysteriously Fast Rate After Recordย Warmth

So they do not have a clue why the Atlantic has suddenly got colder, but they think they know that global warming made it hotter in the first place, even though there is no physical for the claim that a slightly warmer atmosphere can make any measurable difference to ocean temperatures!

From NOT A LOT OF PEOPLE KNOW THAT

By Paul Homewood

For over a year, surface temperatures in the Atlantic Ocean hit new highs, but that trend has reversed at record speed over the past few months, and nobody knows why.

In June, temperatures in the Atlantic were 2 to 5 degrees Fahrenheit (1 to 3 degrees Celsius) hotter than normal in much of the ocean, with some areas getting as much as 9 degrees F (5 degrees C) warmer than average. Those temperatures werenโ€™t a one-off, as the Atlantic had regularly seen record-breaking levels since March 2023. That year marked the fourth in a row that the worldโ€™s oceans set new heat records.

The hot water was partially a result of human-caused climate change, but it was also due to a particularly strong El Niรฑo in 2023 and 2024. But that system appears to have passed, according to the National Oceanic and Atmospheric Administration.

NOAA data shows Atlantic sea surface temperatures have cooled at a surprising rate since May. Since June began, temperatures have been a degree or two Fahrenheit colder than normal for this time of year. That means El Niรฑo will likely be replaced by its counterpart, La Niรฑa, a weather system that allows cold water to rise to the surface of the Atlantic, some time between September and November. Both El Niรฑo and La Niรฑa are complex systems driven by trade winds, solar heating, and rainfall in the tropic regions, and can be difficult to predict. Still, the sudden shift in Atlantic temperatures has been puzzling, and nobody seems to know why itโ€™s happened so quickly.

โ€œWeโ€™ve gone through the list of possible mechanisms, and nothing checks the box so far,โ€ Frans Philip Tuchen, a postdoctoral student at the University of Miami, told New Scientist.

https://gizmodo.com/the-atlantic-is-cooling-at-a-mysteriously-fast-rate-after-record-warmth-2000488967

So they do not have a clue why the Atlantic has suddenly got colder, but they think they know that global warming made it hotter in the first place, even though there is no physical for the claim that a slightly warmer atmosphere can make any measurable difference to ocean temperatures!

They also get their knickers in a complete twist stating that El Ninos in the Pacific raise SSTs in the Atlantic!

The inability to explain what has happened underlines how little scientists really do know about the way our oceans work. And it is these oceanic cycles which are at the heart of long term global climate cycles, because of the immense thermal capacity they store.

We know little, but we do know that large and sudden temperature shifts have occurred in the Atlantic in the past, as seen in the AMO:

https://climexp.knmi.nl/getindices.cgi?WMO=UKMOData/amo_hadsst&STATION=AMO_hadsst&TYPE=i&id=someone@somewhere

This latest cooling episode, along with the preceding warming one, is merely just a part of that long term pattern.

New Study: 1979-2013 Southern Ocean And Southeast Pacific Cooling Driven Byโ€ฆWarming?

Scientists attempt to explain why approximately one-third of the global oceanโ€™s sea surface temperatures cooled since the late 1970s.

From NoTricksZone

Byย Kenneth Richard

Scientists attempt to explain why approximately one-third of the global oceanโ€™s sea surface temperatures cooled since the late 1970s.

The 50-70ยฐS Southern Ocean and 160ยฐW to 80ยฐW southeastern Pacific cooled by about -0.35ยฐC (-0.117ยฐC per decade) from 1979-2013 (Yao et al., 2024). (The cooling also continued to 2019, but the authors chose to use 2013 as their end point.)

In the paper the scientists expend a great deal of effort to โ€œargueโ€ that warming in the North Atlantic forced 35+ years of cooling from 50 to 70ยฐS and 160ยฐW to 80ยฐW.

โ€œWe argue that North Atlantic warming is decisive for driving the observed multidecadal SST cooling of the southeastern Pacific sector.โ€

However, they simultaneously acknowledge both (a) internal variability and (b) increases in cloud cover leading to reductions in downwelling shortwave radiation can explain the cooling in this region. These would appear to be much more plausible explanations for multi-decadal cooling than the warming-forces-cooling mechanism they propose.

Image Source:ย Yao et al., 2024