Global warming, climate change, all these things are just a dream come true for politicians. I deal with evidence and not with frightening computer models because the seeker after truth does not put his faith in any consensus. The road to the truth is long and hard, but this is the road we must follow. People who describe the unprecedented comfort and ease of modern life as a climate disaster, in my opinion have no idea what a real problem is.
After three months of apocalyptic media stories, flood warnings and amber alerts, you would be excused for thinking we have just had the wettest winter in the UK since Noah slipped anchor! Even now the Met Office are describing it as “among the wettest on record”.
But the Met Office numbers tell a different story. In reality, it turns out to have been no different to many other winters in the past.
After three months of apocalyptic media stories, flood warnings and amber alerts, you would be excused for thinking we have just had the wettest winter in the UK since Noah slipped anchor! Even now the Met Office are describing it as “among the wettest on record”.
But the Met Office numbers tell a different story. In reality, it turns out to have been no different to many other winters in the past.
Over the country as a whole, it was only the 20th wettest on record since 1836. As always, some parts have been wetter than others.
Weeks on end of bitter, polar air over much of the US pushed the jetstream far south of its usual track, while at the same time firing it up. As a result, storms have homed in on the southern half of Britain rather than further north. But even then, no region broke any rainfall records, nor even came close.
Desperate to keep up the alarm however, the Met Office have decided that the West Midlands, Cornwall and Leicestershire all experienced their wettest winter since records began in 1837. There’s only one problem here – there are no current stations in any of these regions which have data as far back as 1837, or even the 19th century for that matter. In Leicestershire, for example, they have just one official weather station – Market Bosworth, which has only been open since 2002! There is no data at all to support their assertions, which only originate from their dodgy computer models.
We do however have a long-term record at Radcliffe College, Oxford, which has been keeping meticulous records every day since 1767. The Met Office database, which begins in 1853, confirms that there was nothing at all unusual about this winter’s rainfall there.
This totally contradicts their claim that this particular area of the country had one of its wettest winters on record.
There are in fact very few long running weather stations in the UK. Four others have data going back to the 1800s, and none back up the Met Office claims that the winter was one of the wettest on record – Armagh, Durham, Sheffield and Cambridge ranked 14th, 35th, 19th and 24th wettest respectively.
The Met Office continue to claim that climate change is making rainfall more extreme:
While this winter’s weather has been heavily influenced by natural variability and atmospheric patterns, climate change provides important context.
A warmer atmosphere can hold more moisture, approximately 7% more for every degree Celsius of warming. This means that when it does rain, downpours can be heavier and more intense.
But their own data fails to bear this out. For instance, if we look at the wettest months in England & Wales, those with more than 170mm of rain, they are not occurring more often than they used. Nor are they becoming wetter.
The wettest month this winter was January, with 144.3mm, not an unusually high monthly total at all. In fact, it is more than two years since we had a month with more than 170mm.
Paul Homewood criticizes a BBC Weather article from February 2, 2026, headlined “January rainfall in parts of UK breaks more than century- long record.” The BBC report stated that regions like Northern Ireland, south- west and southern England, and east of Scotland had one of their wettest Januarys on record, with Northern Ireland seeing its wettest in 149 years and some local stations (e.g., in Cornwall and Aberdeenshire) recording exceptionally high totals, often 70-300% above average in spots.
Paul Homewood criticizes a BBC Weather article from February 2, 2026, headlined “January rainfall in parts of UK breaks more than century- long record.”
The BBC report stated that regions like Northern Ireland, south- west and southern England, and east of Scotland had one of their wettest Januarys on record, with Northern Ireland seeing its wettest in 149 years and some local stations (e.g., in Cornwall and Aberdeenshire) recording exceptionally high totals, often 70-300% above average in spots.
The BBC’s reporting aligns with Met Office provisional data released around that time, which confirmed unusually wet conditions in many areas, some setting local records, others ranking among the top few historically, but not universally the absolute wettest ever in the named regions.
The Met Office and BBC often note that while individual years vary due to natural factors (like a southerly jet stream in this case), the trend toward wetter UK winters matches climate model expectations.
GIVEN the media hype, you might think our weather had never been as wet as it was last month.
The BBC, true to form, came up with the headline ‘January rainfall in parts of UK breaks more than century-long record’. Their report went on to state: ‘Northern Ireland, South West and Southern England, and the east of Scotland all had one of their wettest Januarys on record.’
True to form, they were lying. In none of the regions mentioned were any records set. January 1877 remains the wettest January on record in Northern Ireland, while in the South West and Southern England, January 2026 ranked 12th and 6th wettest respectively. It was also very wet in East Scotland last month, but it still ranked only 9th.
Across the UK as a whole, it was not exceptionally wet at all – January 1928 still tops the list:
January is, of course, only one month of the year. When all months are taken into account, we can see that even in Northern Ireland it was not unusually wet last month. Indeed, it was only the wettest month since 2020. But that does not make for scary headlines.
One of the worst affected areas this year was Devon and Cornwall, with totals of more than ten inches in places including Torbay. That is certainly a rare event, but again not unprecedented.
In November 1929, for example, there were higher totals, and not just in Devon and Cornwall. Rainfall across most of Wales was even greater and the English Midlands and North West were also exceptionally wet:
Over the UK as a whole, rainfall in November 1929 was 30 per cent higher than last month. Moreover, believe it or not, the following month, December, was even wetter. The four-month period from October 1929 to January 1930 is the wettest period on record in the UK.
It is a fact that parts of Devon and Cornwall have always been prone to serious flooding in autumn and winter. History is littered with examples as far back as the Tiverton floods in 1625 and major floods in 1877, some of the worst on record. The Black Thursday floods in October 1960 were the worst on record in Exeter and more recently we had floods in 2000 and 2009.
• In the UK as a whole, it was not particularly wet – 197 other months on record that have been wetter.
• Worst affected was the South West, but no worse than many other years.
Why was it so wet?
There have been the usual attempts to blame the wet weather on climate change. But as the Met Office’s own meteorologist, Alex Deakin, explained after Storm Chandra, the root causes are much more mundane.
For the last few weeks, the polar vortex has brought extremely cold, polar air down across most of North America. This has pushed the jet stream a long way south of its usual track and at the same time powered it up. As a consequence, a succession of storms, which generally build to the north side of the jet stream, has brought a lot of wet weather to the south of the British Isles and Western Europe.
To make matters worse, a dome of persistent cold polar air has built up over Scandinavia, trapping the low pressure systems over Britain.
It is merely weather and has nothing to do with climate change at all. Watch Deakin’s excellent report below:
There’s plenty more rain to come in the next few days and probably next week too, but could there be a sign of a change on the horizon
There’s plenty more rain to come in the next few days and probably next week too, but could there be a sign of a change on the horizon
Good news (unless you are a climate doomster) from the University of Illinois Chicago Climate Research Lab. Of course, it’s another climate model, so take it with a grain of salt – Anthony
But by the second half of the 21st century, rising global temperatures could make the Sahara much wetter, according to UIC researchers. By that time, the North African desert could see 75% more precipitation than its historical norm, as reported in Npj Climate and Atmospheric Science. Under extreme climate conditions, rainfall is expected to increase in southeastern and south-central Africa, too, the researchers said.
“Changing rainfall patterns will affect billions of people, both in and outside Africa,” said lead author Thierry Ndetatsin Taguela, a postdoctoral climate researcher in the College of Liberal Arts and Sciences. “We have to start planning to face these changes, from flood management to drought-resistant crops.”
Taguela said understanding how rising temperatures affect rainfall can help in the development of adaptation strategies. In the study, he used an ensemble of 40 climate models to simulate summer precipitation in Africa in the second half of the 21st century (2050-2099) compared with the historical period (1965-2014). Taguela analyzed models’ outputs under two climate scenarios: one that simulated moderate greenhouse gas emissions and one that simulated very high greenhouse gas emissions.
Both scenarios predicted that precipitation over Africa will generally increase by the end of the 21st century, with some regional variation. Notably, rainfall in the Sahara Desert is expected to increase by 75%, followed by a 25% increase in southeastern Africa and a 17% increase in south-central Africa. In contrast, researchers expect the southwestern region to be drier, with an anticipated 5% decline in precipitation.
“The Sahara is projected to almost double its historical precipitation levels, which is surprising for such a climatologically dry region,” Taguela said. “But while most models agree on the overall trend of wetter conditions, there’s still considerable uncertainty in how much rainfall they project. Improving these models is critical for building confidence in regional projections.”
For the most part, these projected changes are associated with the effects of climate change, as higher temperatures help the atmosphere hold more moisture, which in turn enhances rainfall. Changes in atmospheric circulation also played a part in reducing rainfall.
“Understanding the physical mechanisms driving precipitation is essential for developing adaptation strategies that can withstand both wetter and drier futures,” Taguela said.
The UK Met Office has just published its annual State of the UK Climate report for last year. It reads more like a political pamphlet than a scientific one.
The UK Met Office has just published its annual State of the UK Climate report for last year. It reads more like a political pamphlet than a scientific one.
The Press Release sets the tone at the very start:
“Record breaking and extreme weather has become increasingly commonplace in the UK as our climate has changed over the last few decades.
The latest assessment of the UK’s climate shows how baselines are shifting, records are becoming more frequent, and that temperature and rainfall extremes are becoming the norm.”
Most people think of extreme weather as events like the winter of 1963, the Great North Sea Flood, the 1987 Storm or the heavy snowfalls and floods in 1948, not a mild February or sunny day in April.
They say the most noticeable change has been the rise in temperatures, which amounts to about a degree in the last 100 years. There are many possible reasons for this:
a) Natural recovery from Little Ice Age lows
b) Urbanisation
c) Poor siting
d) Cleaner air, resulting from Clean Air Acts
e) Greenhouse gases
But taking the Met Office data at face value, a rise of one degree is much less than the official Met Office projection of a five degree rise by 2100.
It is the latter that is the basis for the whole Net Zero agenda. Who would be prepared to spend a trillion and wreck the economy just to avoid a half a degree temperature rise in the next 50 years?
To put it into perspective, Oxford is about one degree warmer than Birmingham on average. Does that make Oxford’s climate more extreme? Of course not, the whole idea is as absurd as it is unscientific.
The Met Office claims that there has been an increasing frequency and intensity of daily temperature extremes. This is nonsense – while extremely hot days may be more common, these are offset by fewer extremely cold ones. Overall, the frequency of temperature extremes has not changed.
Rainfall
The Met Office also claim that “the UK’s climate has become steadily wetter since the 1980”. However, the 1970s and 80s were unusually dry decades.
Although the UK is currently in a run of wet years, there have been similarly wet periods in the past – the 1870s, 1910s and 1920s, for example.
Similarly, the Met Office claim that rainfall has become more extreme since the 1960s. But the full datasets show no such long-term trends.
Sea Levels
According to the Met Office report, sea level rise around the UK is accelerating, though no actual data is provided to support this claim.
The UK has three long running tidal gauge records – Aberdeen, North Shields and Newlyn. All three show the same pattern – sea levels have been rising no faster in recent years than in the first half of the 20th century.
A period followed where sea level rise slowed, before returning back to earlier rates. For instance, North Shields:
Storms
Despite the hyping of winter storms by giving them all names, the Met Office report admits:
For the UK overall there are no storms in recent years which compare in severity with exceptional storms in the observations such as the ‘Burns’ Day Storm’ of 25 January 1990, the ‘Boxing Day Storm’ of 26 December 1998 and the ‘Great Storm’ of 16th October 1987.
Weather v Climate
Throughout the report, the Met Office confuse WEATHER and CLIMATE. Individual weather events are presented as evidence of a changing climate.
A good example is winter rainfall, which is said to have been increasing in the last decade or two.
The report includes a section on the North Atlantic Oscillation index (NAO), which is explained as follows:
This index is a measure of the large-scale surface pressure gradient in the North Atlantic between Gibraltar and Iceland, which determines the strength of westerly winds across the Atlantic, and is the principal mode of spatial variability of atmospheric patterns in this region. When the pressure difference is large, the WNAO is positive and westerly winds dominate with stronger and more frequent storms. When the pressure difference is small, the WNAO is negative with an increased tendency for blocked weather patterns, reducing the influence of Atlantic weather systems. The WNAO index is therefore associated with winters which are either mild and wet or cold and dry.
In recent years, the NAO has been strongly positive, just as it was in those equally wet years in the 19th and early 20th centuries.
The NAO is a natural meteorological phenomenon, and clearly its switching to positive mode in the last decade must explain much of the recent increase in winter rainfall. Yet the Met Office ignore this fact and instead put the blame on climate change.
The whole report is 68 pages long, which I doubt anybody will bother to read.
The real intention was to publish a Press Release with scary, apocalyptic soundbites for the media to propagate.
The Coal Plant God is at it again — causing the oceans to swallow South Africa on the one hand and lifting up the land by 2mm a year with the other. (A lucky coincidence that disguises the horrors of rising seas, eh?). Apparently, we used to think the land was rising due to hot plumes of magma far below, but now researchers say it’s because a drought has made the crustal plate lighter.
The Coal Plant God is at it again — causing the oceans to swallow South Africa on the one hand and lifting up the land by 2mm a year with the other. (A lucky coincidence that disguises the horrors of rising seas, eh?). Apparently, we used to think the land was rising due to hot plumes of magma far below, but now researchers say it’s because a drought has made the crustal plate lighter.
Even though no model can predict rainfall, everyone reading the tea leaves, and editing newspapers, can see that climate change caused the drought.
Instead of heat from below, the Earth’s crust in parts of South Africa appears to be lifting due to water loss above. When surface and underground water vanish, the weight on the land decreases. That loss of pressure lets the land subtly spring upward, like a sponge expanding after being squeezed.
The precambrian crust under South Africa is some of the oldest in the world, and the research team proudly tells us they “analyzed satellite and climate data spanning nearly a decade.” That much?
This groundbreaking conclusion comes from researchers at the University of Bonn…
The researchers used GPS measurements, satellite data, and hydrological models to study the correlation between areas experiencing severe droughts and significant land uplift.
Not to knock the detailed and creative work of said researchers but this is typical of Big Government strangled science. It must have cost a lot of money, involved many salaries and much high-tech equipment, but in the end all conclusions are tortured to blame “climate change”.
The paper itself only mentions anthropogenic climate change once, but the press release and news stories turn it into a horror show, and none of the experts at universities around the world will be able to say a damn thing about how absurd that is.
In March 2025, much of Queensland was lashed, drenched and then drown by torrential rains with downpours of 180 mm in a single day, breaking records for March, swelling rivers and flooding plains. From Burketown to Winton to Adavale to Thargomindah, graziers have been isolation and suffered tremendous losses, yet their resilience shines through. The water is now moving slowly to Lake Eyre, there will also be renewal.
In March 2025, much of Queensland was lashed, drenched and then drown by torrential rains with downpours of 180 mm in a single day, breaking records for March, swelling rivers and flooding plains. From Burketown to Winton to Adavale to Thargomindah, graziers have been isolation and suffered tremendous losses, yet their resilience shines through. The water is now moving slowly to Lake Eyre, there will also be renewal.
As I comment on the deluge and the Bureau’s failure to forecast it—from the equatorial Pacific Ocean to Lake Ayre overland—I hold those still affected close, wishing them strength amid the heartache.
Where did this water come from? It began as water vapor over the western Pacific’s equatorial zone, a warm ocean expanse near Indonesia where sea temperatures above 28°C fuel intense evaporation. Think tropical convection and hot towers—cumulonimbus clouds with tremendous updrafts—drawing columns of water from the warm ocean’s surface to the very top of the troposphere.
The monsoon trough lingered at the wet season’s tail, moving this moisture inland, dumping it across Queensland’s Channel Country. Some, like Simon Turton, argue this wasn’t just La Niña but a warming world amplifying the water cycle, delivering what fell in Winton and Adavale. More likely the Bureau needs not only better tools for forecasting drought and flood cycles, but also to be monitoring volcanic eruptions in Indonesia that can seed the atmosphere with condensation nuclei.
The Bureau of Meteorology’s autumn forecast, released February 27, 2025, painted a misleading picture: warmer-than-average temperatures across Australia, with rainfall “likely to be in the typical range” and “drier than usual for most of Queensland” outside southern and southeast areas. Tropical lows and monsoon bursts were noted as possibilities, but few expected the scale of what unfolded. Western Queensland, pegged for below-average rain, instead saw its third-wettest March since 1900, with 207 mm statewide—124% above the 1961–1990 average. Winton recorded daily falls of 120–180 mm, breaking records from 1910, while Adavale’s Bulloo River surged, evacuating its 30 residents. The Bureau’s models missed the mark, underscoring a need for them to move to better tools.
In August 2011, John Abbot and I visited the Bureau of Meteorology keen to share output from our rainfall forecasting model built using commercially available AI on a laptop computer to forecast monthly rainfall. Meanwhile the Bureau are still producing hopeless forecasts using an expense to run, and expense, super computer costing hundreds of millions of dollars. We wanted to work with the BOM suggesting artificial intelligence (AI) had great capacity for more skilful seasonal forecasts.
Oscar Alves, then the head of their long-range forecasting unit, did not dispute that our AI-based model was generating more reliable monthly forecast for 17 Queensland locations, up to 3 months in advance, but that because the climate, he claimed, was on a new trajectory, our method would not work for many more years.
Oscar Alves’s boss, Andrew Johnson, the current head of the Australian Bureau of Meteorology, also seems to understand very little about natural climate cycles and the application of AI. Johnson is a Malcolm Turnbull appointee. Back in 2011, John Abbot and I were affiliated with Central Queensland University and funded by the B. Macfie Family Foundation.
There are now many studies in applied mathematics and AI, already published in the scientific literature including by myself and John Abbot showing the potential application of AI for rainfall forecasting. Some of this technology is beginning to be adopted in Asia, including in Indonesia where I was part of a program with the Indonesian Bureau of Meteorology (BMKG). The first paper that Abbot and I got published was by the Chinese Academy of Science. They are leaving Australia behind, for sure.
Can you see me, bottom left corner? I was in Bandung with Indonesian meteorologists, some now working with the Chinese on better methods for seasonal rainfall forecasting using AI.
Since 2018, our work on monthly rainfall forecasting has been continued mostly by John Abbot, click here.
I quit mostly because of the extraordinary backlash when John Abbot and I began extending our rainfall forecasting work to climate change. Gavin Schmidt at NASA and others ran a campaign against us, not by way of coherent criticisms in the scientific literature, but as attacks on Twitter wanting the retraction of an article we had just got published. You can read my comprehensive defence of that article at climatelab.com.au, click here.
Oscar Alves and Andrew Johnson continue to fail to recognise that the world’s climate is always changing; there are cycles of different frequencies some spanning hundreds, others span thousands, even millions of years. Most importantly they can be described mathematically and forecast using AI, but it requires a new way of thinking. Even think tank employees often fail to understand that the climate has been changing, even before woolly mammoths, which are, I am told, the third-most depicted animal in ice age art, after horses and bison. Some of these people, running the institutions, would prefer to discuss ice age art than the application of AI to rainfall forecasting. Consequently, because those in charge mostly don’t seem to care, the little people, Australians attempting to earn an income independently of government suffer. When was it that Johnson before a Senate Committee claims surprise that anyone took the Bureau’s forecasts seriously.
A friend recently emailed me, awed by how this water vapour, unseen in the sky, became a flood of such magnitude. “A few days before,” he wrote, “it was just floating around until temperature and saturation made it fall to earth.” His point captures the wonder: the atmosphere holds vast reservoirs—billions of tonnes of vapour yet we only notice when it falls.
In western Queensland this last March, that falling was relentless, driven by low-pressure systems likely nudged by Rossby waves and volcanic eruptions, soaking already saturated soils. Rivers including the Georgina, Diamantina, and Cooper Creek have overflowed, submerging roads and homes drowning livestock, much of this flooding now continuing in slow-motion.
The water is on the move, heading west to Lake Eyre, Australia’s lowest point at 17 meters below sea level. The Diamantina River’s waters are already trickles into Lake Eyre North’s Warburton Groove. The main flood pulse, from Winton and Adavale, crawls through the Channel Country at 1 km/h, spreading over an area five times the size of the United Kingdom.
The prediction is the waters will reach Lake Eyre by late April, peaking from June to August, potentially rivalling fills from 2009–2011, though not 1974’s full basin flood. Evaporation and floodplains will claim much, but enough may linger to draw pelicans and tourists by winter.
For western Queensland, these rains were a paradox—life-giving yet also heartbreaking for many. Graziers welcomed dam refills, but not drown livestock and supplies. Adavale’s evacuation and Winton’s record-breaking deluge test endurance. To those still cut off, checking livestock through mud and awaiting road repairs, we see your struggle. Your stories—of neighbours helping neighbours, of facing this flooding cycle with grit—inspire us.
We care deeply and hope for brighter days as waters recede.
For individuals and communities rebuilding, the challenge is immense, yet the same water promises renewal at Lake Eyre—a rare spectacle of this land’s natural climate cycles.
May those affected by the flooding rains find strength to match the rivers’ flow and may we all carry more respect for the forces shaping our world the endless cycles of destruction and rebirth.
*******
Key technical papers detailing my method for monthly rainfall forecasting are listed at the Climatelab.com.au website, click here.
For Lake Eyre updates, to watch the water flow in, click in.
Bureau of Meteorology’s 2025 Autumn Long-Range Forecast 27/02/2025
The Bureau of Meteorology has released its long-range forecast for autumn 2025.
While autumn is often a time for cooler weather to begin, this season is very likely to be warmer than average across Australia and summer heat may persist into early autumn.
Rainfall is likely to be in the typical range for the season for most of Australia…
It’s also likely to be drier than usual for most of Queensland except for southern and south-east areas.
Tropical cyclones, tropical lows, storms and active monsoon bursts are still possible in the north over the coming months, which can bring particularly heavy rain.
Land use changes (LUC) and global warming (GW) significantly impact the Maritime Continent’s (MC) hydroclimate, but their effects on extreme precipitation events are underexplored. … We find that LUC-induced deforestation increases surface warming, enhancing atmospheric instability and favoring local convection, leading to more frequent heavy precipitation. Meanwhile, GW amplifies the atmosphere’s water-holding capacity, further intensifying wet extremes. Our findings reveal a “wet-get-wetter, dry-get-drier” pattern driven by different mechanisms: dynamic processes primarily influence wet extremes under LUC, while changes in evapotranspiration control dry extremes. In contrast, under GW, wet extremes are driven by dynamic processes, while dry extremes are influenced by reduced moisture availability and weakened atmospheric circulation. This highlights the need for land management to address rising extreme risks.
And what is the “Maritime Continent” when it’s at home, sez I? Good question, never heard of it. Foolish me, I thought there were only seven continents. Here’s what I found out.
Figure 1. The “Maritime Continent”.
Not sure why the Solomon Islands (in gray at the lower right) isn’t included in the “Maritime Continent”. The Solos are always kind of the overlooked country in the region. I lived and worked in the Solomons for eight years, so I have some familiarity with the weather patterns. It has the same weather as the others.
In any case, the area being studied is about a third of one percent of the earth’s surface. In addition, it’s in the midst of an unusual part of the planet called the Pacific Warm Pool, with some of the highest rainfalls amounts found anywhere.
Figure 2. Average rainfall, 1979-2021. Atlantic and Pacific centered views. The red boxes mark the general area of the Maritime Continent discussed above.
Note the blue line of heavy rainfall above the equator. This is the rainfall from the semi-permanent band of thunderstorms at what’s called the “Inter Tropical Convergence Zone” (ITCZ). The ITCZ marks the boundary between the separate circulations of the northern and southern halves of the atmosphere.
Of particular interest is the large blue area in the western Pacific Ocean and the eastern Indian Ocean. This is the area of the “Pacific Warm Pool”. It’s the warmest area of the open ocean, as well as the wettest. It’s also the area chosen by the researchers for their study. For a discussion of the nature of the Pacific Warm Pool, see the post below.
The conclusion of their study is that in the Maritime Continent (which they don’t mention is only a third of a percent of the surface and is in the middle of the Pacific Warm Pool), the wet is getting wetter and the dry is getting dryer.
And how do they know this? Intensive study of the rainfall records? Analysis of patterns of rainfall? Correlation of rainfall amounts with El Nino/La Nina alterations?
Nah. That “observations” and “evidence” stuff is soooo 20th Century.
They just ran a couple of climate models, performed modern haruspicy on the entrails of the model results, and the answer popped out … modern science at its finest.
Sadly, despite the study only covering a tiny area in the middle of a unique climate region, the authors couldn’t resist declaring that we are faced with “rising extreme risks“.
Be still, my beating heart.
Part 2. The Hype
So that’s the study. Then there are the popular reports of the study, wherein it has grown markedly in the telling. There’s a typical one below. Following the unbreakable rules for such articles, the headline claims that some scientists somewhere are worried. And not just ordinary worried. Existentially worried. Ringing the bells worried. The headline says:
The article, basically quoting the study’s abstract without attribution, says:
Researchers say their findings have revealed a “wet-get-wetter, dry-get-drier” pattern driven by different mechanisms. Dynamic processes largely control wet extremes under land use changes, while changes in evapotranspiration control dry extremes. However, in a warming world, dynamic processes amplify wet extremes, while a reduction in moisture and weakened atmospheric circulation influence dry extremes.
So, are they right that the wet is getting wetter and the dry is getting dryer, either in the Maritime Continent or globally? We actually have the data to determine that. A 1° latitude by 1° longitude satellite-based rainfall record since 1979 is available from Copernicus here.
Upon reflection I realized that this is actually two different questions.
• Are wet areas getting wetter and dry areas getting drier?
• Are wet times of year getting wetter and dry times of year getting drier?
Since we are considering the question of trends, let me take a slight digression. My hypothesis is that a main one of the emergent phenomena that thermoregulate the planet are the tropical thunderstorms. Thunderstorms cool the surface in a variety of ways. They keep the temperature in the Pacific Warm Pool from ever exceeding around 30° – 31°C. So, per my hypothesis, the recent global warming should have been accompanied by an increase in cooling rainfall in the tropics and particularly in the area of very frequent thunderstorms, the intertropical convergence zone (ITCZ) just above the equator. Here is a look at where it’s been getting wetter and where it’s getting drier since 1979.
Figure 3. Rainfall trend. The two panels are the Pacific and Atlantic views of the same data. Red lines enclose areas which are drying at the rate of -3 mm/decade or faster. White lines enclose areas getting wetter at the rate of 3 mm/decade or more.
Note that this bears out my hypothesis, in that there is increasing thunderstorm-driven cooling in the Pacific Warm Pool and the ITCZ. But I digress into theory. Let me return to observations.
There are some fascinating and surprising things about Figure 3. The overall trend is zero. Land is drying slightly, while the ocean is growing slightly wetter. Tropical land is drying the fastest, tropical ocean is getting wetter the fastest.
Rainfall in New Zealand is decreasing. Around the equator, the largest area of decreasing rain is in between two of the largest areas of increasing rain. North America is mostly unchanged, except for some drying in the Northwest Coast. The Southern Ocean has two areas getting drier and two areas getting wetter. Most of the world’s landmass is pretty neutral, neither getting much wetter nor much dryer, except for the southern Amazon which is getting drier.
Not seeing much pattern in all of that. Well, except for the fact that the actual observations agree with my hypothesis that global warming is opposed by increasing numbers, earlier daily emergence, and greater duration (lifespans) of cooling tropical thunderstorms.
Moving on, regarding the first question about wet and dry areas, here’s a scatterplot of the decadal trend in rainfall (vertical axis) versus the average annual rainfall (horizontal axis) for each 1° latitude by 1° longitude gridcell (n = 64,800).
Figure 4. Scatterplot, rainfall trend versus average rainfall in individual 1°latitude by 1°longitude surface gridcells. Global average rainfall is ~ one meter, so “wet” and “dry” areas are based on that threshold.
As you can see in Fig. 4 above, in areas where the rainfall is less than about two meters per year, there’s no “wet gets wetter, dry gets dryer” at all. It’s only in areas of very heavy rain, more than about two meters per year, that the wet is getting wetter. Here are the areas we’re talking about.
Figure 5. The only areas of the world that are getting wetter overall are the areas where the average rainfall is over 2 meters per year..
Note that, while most of this “wet gets wetter” area is over the ocean, by a peculiar coincidence, the Maritime Continent area in the study above is also in that area.
This would tend to indicate that no matter what they discovered by aiming their models at the 0.3% of the planet that is the Maritime Continent, their conclusions are not widely applicable to the rest of the planet.
Next question is, on the Maritime Continent are the wet times of year getting wetter and the dry times of year getting drier? To investigate that, we can look at the standard deviation of the rainfall dataset. If wet gets wetter and dry gets drier, the standard deviation will increase.
So, let’s start with the actual monthly rainfall on the Maritime Continent.
Figure 6. Monthly average rainfall on the Maritime Continent.
When people ask what the weather In the Solomon Islands is Iike, I say “There’s the hot wet season, followed by the hotter wetter season”. The Copernicus dataset says that is true in the Maritime Continent as well, no surprise. Note that even the driest months in the Maritime Continent record are wetter than the global average monthly rainfall of 82 mm or so.
Using my Mark I eyeball, I’m not seeing any “wet gets wetter, dry gets drier” going on. Looks like the biggest swings are in the middle of the record. But let’s look to the measurements. Here is the 10-year trailing standard deviation of the rainfall on the Maritime Continent. Each monthly data point in Figure 7 below shows the standard deviation of the previous ten years (120 months) of rainfall.
Figure 7. Ten-year trailing standard deviation of the Maritime Continent rainfall data shown in Figure 6. Each point on the yellow line shows the standard deviation of the 120 months of rainfall data prior to that time.
Again, I’m not seeing any indication of “wet gets wetter, dry gets drier”. There are changes, but no overall trend.
Finally, what’s happening with the rainfall overall? Well … nothing. Here’s the global rainfall record.
Figure 8. Monthly global average rainfall, 1979-2024. The trend of the data is 0.05 mm of increasing rainfall per decade, basically zero.
A final oddity highlighting the curious stability of the climate system is that rainfall in the northern and southern hemispheres are in opposition — even after removing the seasonal variations, when one hemisphere is wetter, the other tends to be drier, and vice versa.
Figure 9. Monthly global average rainfall (black), along with northern hemisphere rainfall (blue) and southern hemisphere rainfall (red).
And that’s what I learned about the rainfall this week. Plus now I know what the Maritime Continent is. And here in the generally dry Northern California coast, it’s raining outside my window as I write this.
What an astounding planet!
w.
It Bears Repeating: When you comment, please quote the exact words you are discussing. I choose my words with care, and I’m happy to explain and defend them. But I can’t explain or defend your restatement of what you think I meant.
A major storm system will pound the western states during the next couple of days and it will then trek across the nation and wreak havoc in the eastern states this weekend. In California, the rainfall in coming days will be heavy all along low-lying coastal sections from Oregon to the Mexican border, and snowfall will be measured by the foot in the Sierra Nevada Mountains.
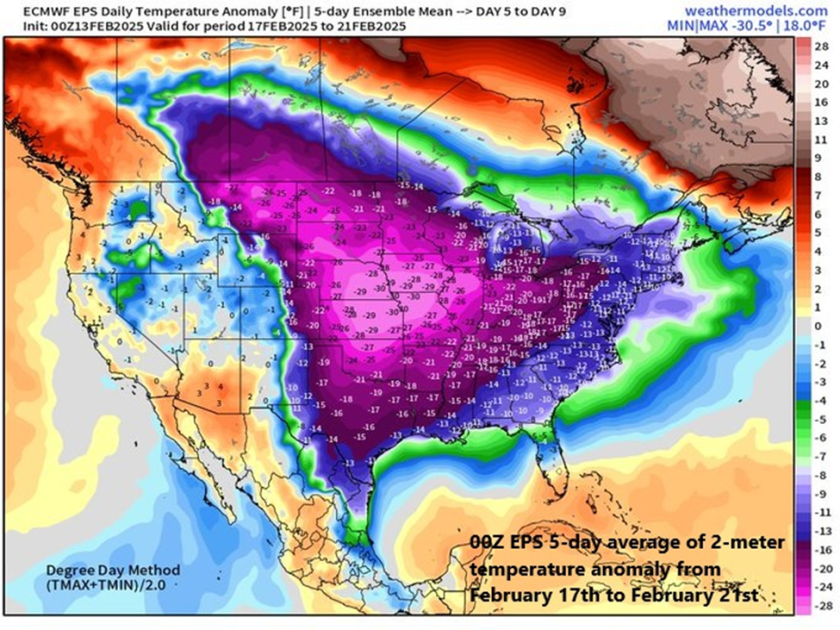
A very cold air mass will flood the northeastern states at the end of the upcoming weekend and next week looks very cold on average across the eastern 2/3rds of the nation. Map courtesy ECMWF, weathermodels.com (Dr. Ryan Maue, X)
Overview
A major storm system will pound the western states during the next couple of days and it will then trek across the nation and wreak havoc in the eastern states this weekend. In California, the rainfall in coming days will be heavy all along low-lying coastal sections from Oregon to the Mexican border, and snowfall will be measured by the foot in the Sierra Nevada Mountains. By the early part of the upcoming weekend, this same storm system will bring flooding rainfall to the Ohio and Tennessee Valleys and then significant snow is likely on Sunday across interior New York State and New England.
In the Mid-Atlantic region, there will be plenty of rainfall this weekend; however, it is likely to be preceded on the front-end by snow and accumulations are possible; especially, to the north of the PA/MD border. Cold air will pour into the eastern states following this weekend storm system and next week is indeed looking very cold across the eastern two-thirds of the nation. Low pressure is likely to gather strength in the southern states by the middle of next week aided by an influx of Gulf moisture and it could become a significant east coast storm threat by later Wednesday or Thursday.
A major storm will impact the western US during the next couple of days with significant rainfall in low-lying coastal sections and substantial snowfall in higher elevation locations. In fact, the snow will be measured by the foot in coming days across the Sierra Nevada Mountains of eastern California and substantial snow will fall in many of the Rocky Mountain States. Map courtesy NOAA, tropicaltidbits.com
Major storm crosses the country next few days
A strong storm system will pound California during the next couple of days with significant rainfall along low-lying coastal sections from Crescent City in the north to San Diego in the south. Substantial snow will fall across the higher elevations of the Sierra Nevada Mountains during this event with several feet in some spots by the latter part of the weekend. This same storm system will then cross the nation and reach the eastern states this weekend bringing flooding rainfall on Saturday to some areas such as the Ohio and Tennessee Valleys and significant accumulating snow to others on Sunday including interior New York State and New England.
The weekend will feature plenty of rainfall in the DC-to-Philly-to-NYC corridor; however, there can also be a quick thumping of snow on the front-end with accumulations on the table; especially, to the north of the PA/MD border. Any snow or sleet that does fall at the onset of the weekend event will change to rain by Saturday night and continue Sunday and some of the rain may be heavy at times. Map courtesy NOAA, tropicaltidbits.com
In the Mid-Atlantic region, the weekend weather event will range from cold and possible accumulating snow on the front-end to mild with plenty of rainfall in the middle and back-end. All of this will be followed by an influx of very cold air on Sunday night and Monday and the first half of next week will be very cold across much of the nation including the Mid-Atlantic region. On Saturday, precipitation may begin as a quick thumping of snow; especially, to the north of PA/MD border. Accumulations of a couple to a few inches are possible across eastern PA, central and northern New Jersey, and in the New York City metro area likely from the late morning to early afternoon hours. Even the DC metro region can experience some snow and/or sleet at the onset of the weekend event around mid-morning on Saturday and a coating or so is on the table. Later in the day, the precipitation will mix with and then changeover to rain and the rain will continue Saturday night and Sunday morning. Some of the rain that falls on Saturday night and Sunday morning can be heavy at times and a rumble of thunder cannot be ruled out. By later Sunday, strong low pressure to the north will drag a cold front through the region and temperatures are likely to plunge late Sunday/Sunday night from the mild levels achieved earlier in the day.
The Madden-Julian Oscillation or MJO is predicted to push through phase 8 and into phase 1 during the next couple of weeks (indicated by arrows, left plot) and these particular phases are typically correlated with colder-than-normal conditions across the central and eastern states (boxed regions in temperature composite maps, right). The colder-than-normal weather pattern that begins in earnest next week could last all the way into the month of March. Plot courtesy ECMWF, NOAA
Very cold next week…possible east coast storm threat mid-to-late week
The first half of next week looks to be very cold across much of the central and eastern US with particularly cold air centered over the central states. This outlook for colder-than-normal weather next week in the eastern half of the nation is supported by the movement of a tropical disturbance that is tracked by meteorologists using a teleconnection index known as the Madden-Julian Oscillation or MJO. Depending on its location (or “phase”) for the given time of year, it can provide clues as to the temperature patterns across the nation.
Next week is destined to be very cold across much of the nation and this colder-than-normal pattern could take us all the way into the month of March. The 2-meter temperature anomaly forecast map shown here for the 7-day period of February 20 – February 27 depicts much below-normal temperatures across the eastern half of the nation with a focus on the Midwest/Ohio Valley. Map courtesy ECMWF, Weather Bell Analytics
At this stage of the winter season, when the MJO moves into phases 8 and 1, temperatures are typically below normal across the central and eastern states. Indeed, it appears the MJO will push into phase 8 during the next day or so and then into phase 1 around February 22nd or so…this colder-than-normal pattern may even last right into the month of March.
The overall active weather pattern across the nation in recent weeks will continue through at least much of next week and one of the supporting factors has been powerful “jet streak” activity in the upper part of the atmosphere. This forecast map of 250 millibar winds for next Wednesday evening, February 19th, suggests strong surface low pressure may develop somewhere near the Mid-Atlantic coastline. Map courtesy NOAA, tropicaltidbits.com
By later Tuesday of next week, moisture will push northward into the Mississippi Valley resulting in snow to the north and rain down south. Low pressure over the northern Gulf region will then make a move to the northeast and head towards the Atlantic seaboard and it will encounter plenty of cold air across the Mid-Atlantic region. Exactly how far this system moves up along the east coast remains to be seen, but the threat is there for a significant impact in the Mid-Atlantic region by the middle or latter parts of next week…stay tuned.
It does not need me to tell you that it was quite wet last year. It was in fact ninth wettest in England & Wales since 1766, though nowhere near the two wettest years in 1872 and 1768.
It does not need me to tell you that it was quite wet last year. It was in fact ninth wettest in England & Wales since 1766, though nowhere near the two wettest years in 1872 and 1768.
For the last decade or so, we have been going through the same sort of weather as in the 1870s and 80s, as well as the 1920s.
But averages and trends are not particularly meaningful – nature does not do averages and straight lines! You could have ten years all with the same rainfall, or you could have five years with high rainfall and five years of drought, and you could get the same average.
If you just look at the distribution of wet years, there is no obvious pattern:
But the chart of driest years strongly suggests that these are both much less frequent and severe now. The most recent inclusion in the list is 2011:
It would be accurate to say that England & Wales are not getting wetter, but are not as dry as they often used to be.
Despite the year as a whole being wetter than average, no month was particularly so, with none appearing in the list of >170mm:
The wettest day was Feb 8th, with 21.89mm. Most years see this sort of level or more.
The data shows that rainfall is not getting more extreme in England & Wales.
As an amateur scientist, I am all in favor of one aspect of the emergence of artificial intelligence (AI). I employ it as the world’s fastest librarian, able to gather and summarize an amazing amount of data in a few moments.
As an amateur scientist, I am all in favor of one aspect of the emergence of artificial intelligence (AI). I employ it as the world’s fastest librarian, able to gather and summarize an amazing amount of data in a few moments.
Recently I thought I might use AI to educate me on the science of autism and vaccines. Note that I came into this question knowing almost nothing about any underlying scientific studies of the possible connection between autism and vaccines, other than numerous passionate claims from both sides of the question on the web.
Here’s how I went about gathering and checking the information. Thanks to a heads-up from Charles the Moderator, I use an AI called perplexity.ai. I’ve stuck with it for a curious reason—perplexity once told me it was reluctant to answer a question I asked about rainfall in a remote part of the Sahara desert because there was so little data available that it might be hallucinating an answer … I took that as a good sign that it recognizes that it has limitations.
Me: List major studies showing that autism either is or is not associated with vaccination.
Note the construction. I’ve found that in doing scientific research it is important to specifically ask for evidence for both sides of the question. You want to avoid general questions like “What is known about autism and vaccines”. With that kind of phrasing, often an AI will not fully explore the question space, leaving out important evidence for one side or the other.
Here’s perplexity’s answer to my question above:
Several major studies have investigated the potential link between vaccines and autism. Here’s a list of key studies showing no association between vaccines and autism:
Taylor et al. (1999):
Examined 498 children with autism in North Thames, England
Found no difference in autism rates between vaccinated and unvaccinated children
No clustering of autism diagnoses after MMR introduction
Madsen et al. (2002):
Studied 537,303 children in Denmark
No increased risk of autism in MMR-vaccinated children
No association between age at vaccination, time since vaccination, or date of vaccination and autism development
Jain et al. (2015):
Evaluated about 100,000 children with older siblings with or without autism
No increased risk of autism spectrum disorder (ASD) associated with MMR vaccination
Danish study (1991-1998):
Included over 500,000 children
No link found between MMR vaccine and autism or autism spectrum disorders
Meta-analysis by Taylor et al. (2014):
Analyzed 10 studies involving over 1.2 million children
Reaffirmed no association between vaccines and autism
Suggested MMR vaccine may actually decrease autism risk
Hmmm, sez I …
Now, as I mentioned above, AIs do hallucinate. So my next directive to perplexity is:
Verify that each of those is a real study, not a hallucination.
I‘ll verify the studies mentioned in the search results:
Brent Taylor et al. (1999): This is a real study examining 498 children with autism in North Thames, England.
Madsen et al. (2002): This is a genuine study published in the New England Journal of Medicine, involving 537,303 children in Denmark.
Taylor et al. (1999) reanalysis: This appears to be a real reanalysis of the original Taylor study, though I don’t have enough information to confirm its exact publication details.
Hviid et al. (2019): This is a real nationwide cohort study in Denmark, published in the Annals of Internal Medicine, involving 657,461 children.
Time-trend analysis using the UK General Practice Research Database: This is a real study, though specific authors aren’t mentioned in the provided information.
Noticing that one study was left out, I asked:
Verify that 3. Jain et al. (2015) is a real study, not a hallucination.
Yes, Jain et al. (2015) is a real study, not a hallucination. This study is mentioned multiple times in the search results:
It’s listed in the Children’s Hospital of Philadelphia vaccine education center information
The full citation is provided: “Jain A, Marshall J, Buikema A, et al. Autism occurrence by MMR vaccine status among US children with older siblings with and without autism. JAMA 2015;313(15):1534-1540.”
The JAMA (Journal of the American Medical Association) article details are given, including the publication date of April 21, 2015
The study’s methodology and findings are summarized, noting it evaluated about 100,000 younger siblings and found no association between MMR vaccination and increased risk of autism spectrum disorder
It’s referenced in a Science Daily article about MMR vaccine and autism
The study is also cited in an Immunize.org document listing evidence that MMR vaccine does not cause autism
These multiple, consistent references across different sources confirm that Jain et al. (2015) is indeed a real study examining the relationship between MMR vaccination and autism risk.
All of these studies appear to be real based on the information provided. However, for some studies, I don’t have enough details to fully verify their publication information or authorship.
Upon request, Perplexity also provided details for all of the other studies it found in its research, viz:
Quebec study of 27,749 children from 55 schools: This is likely a real study, but I don’t have enough information to confirm specific authors or publication details.
Danish national registry study of 537,303 children (1991-1998): This is likely referring to the Madsen et al. (2002) study mentioned earlier.
Atlanta study comparing 624 autistic children with 1824 matched controls: This appears to be a real study, though I don’t have enough information to confirm specific authors or publication details.
English study of 12,810 children born 1991-1992: This is likely a real study, but I don’t have enough information to confirm specific authors or publication details.
UK study of 100,572 children born 1988-1997 using the General Practice Research Database: This appears to be a real study, though I don’t have enough information to confirm specific authors or publication details
I found it fascinating to see its judgment of the validity of the information it is examining.
Moving on, I asked:
Provide a list of key studies claiming some association between vaccines and autism
Based on the search results provided, there are no credible studies claiming an association between vaccines and autism. The search results consistently report that extensive research has found no link between vaccines and autism. However, one flawed study is mentioned that initially sparked the controversy:
Wakefield et al. (1998):
Published in The Lancet (later retracted)
Suggested a potential link between MMR vaccine and autism
The research was later found to be fraudulent
The lead author lost his medical license
The medical journal retracted the paper
It’s important to note that this study has been thoroughly discredited and numerous subsequent studies have found no link between vaccines and autism.
————-
Look, friends, I know that there are real reasons to be cautious about vaccines. These include the steep increase in the number of recommended childhood vaccines as well as the increase in the number of adjuvants, preservatives, and other components in modern vaccines.
However, from this examination of solid scientific evidence about the question, it is clear that autism is not among the reasons to be cautious. Well-designed studies have repeatedly failed to find any link between vaccines and autism, and no studies have demonstrated such a link. Pick another objection, that one’s done and dusted.
Finally, some folks say that vaccinations don’t really protect us against diseases. While this may well be true about the COVID-19 vaccine, here are the observed rates of cases and deaths before and after the introduction of vaccines for a variety of illnesses.
Zooming in close reveals interesting pre- and post-vaccine morbidity and mortality statistics. Cause of the most deaths before vaccines? Whooping cough aka pertussis aka croup, 30 deaths per million. Followed by flu/pneumococcal disease (24/million), polio (22/m), diphtheria (14/m), and tetanus (3/m).
And here is what Jonas Salk did with his polio vaccine.
So that’s the end of the evidence and the beginning of the discussion. First, I know that folks are passionate about this question. So please, don’t shoot the messenger.
What I’ve presented above is how to use perplexity or any AI to unearth scientific evidence about very specific questions of a) autism and vaccines and b) the overall efficiency of each vaccine. I take no further position other than advising caution on everything.
Next, the myriad of questions about vaccines will not be solved on this web page. So let me ask folks to not take sides in the comments. It won’t help. As I said above, other than those two questions of autism and efficiencies, other reasons for caution remain. Exactly what is in each vaccine? What concentration? When, where, and how was it tested?
So in lieu of taking sides, let me invite people instead to use AI to dig out answers to those particular questions that remain in your mind about some particular vaccine, to search for solid scientific evidence, and to set aside the impassioned web-based claims and position-taking in favor of an actual search for current scientific knowledge.
Finally, one thing to emphasize. As the first graphic above shows, there is no one vaccine question just as there is no one vaccine. There’s no overall good/bad, black/white issue.
Instead, every vaccine and every component of every vaccine has its own story, its own effects, and its own unanswered questions. For example, in the US, in what may be an excess of caution, childhood vaccines contain no mercury, while the adult versions of the vaccines contain millionths of a gram. Different issues, different relevant questions. Another example. I lived through the time of polio and Jonas Salk’s miraculous vaccine. And I even worked for several months as the night attendant of an adult polio victim spending the rest of his entire life in an iron lung, paralyzed from the neck down … he was married with one child and had just finished his medical residency when he was struck down. I would read to him, and play chess with him … dear friends, you don’t ever want to see that happen to anyone, much less your child.
The Salk vaccine brought a huge benefit. I can guarantee we don’t want to go back to those days. Different vaccines, different benefits, different questions, different issues, there’s no one overarching “Are vaccines good or bad?” question.
My best regards to each of you, stay well out there in this lovely but deadly world,
w.
PS—I’m still persona non-grata on X, with my account improperly suspended as I explain in my blog post below:
I ask anyone on X to use any leverage you have to get the X censorship gods to unsuspend my account, @WEschenbach. If you could do me the honor of linking to my blog post above, it will allow my voice to be heard.
As Usual: I ask when you comment that you quote the exact words you are discussing, so we can all be clear about your subject.




You must be logged in to post a comment.