An early look at winter

The threat of a cold winter looms.
Plenty of blocking is expected over the Arctic.
A prominent Alaskan ridge should lead to plenty of cold air.
Another Thanksgiving-to-Christmas cold period is on the table, but this time it may not break.
The heart of the winter looks coldest relative to average, but there are questions as to how it starts and ends.

Two deer grazing near a snow-covered lake surrounded by pine trees and mountains in the background.

From CFACT

By Joe Bastardi

A tabby cat wearing a purple scarf looks up as snowflakes fall in a winter setting.

This was first issued Aug 29 to clients. 

  • The threat of a cold winter looms.
  • Plenty of blocking is expected over the Arctic.
  • A prominent Alaskan ridge should lead to plenty of cold air.
  • Another Thanksgiving-to-Christmas cold period is on the table, but this time it may not break.
  • The heart of the winter looks coldest relative to average, but there are questions as to how it starts and ends.
Map showing the November 2025 to March 2026 temperature anomaly forecast across the United States, with varying color-coded temperature ranges.

Analog:

Map depicting NOAA/NCEI climate division composite temperature anomalies in Fahrenheit from November to March, comparing values against the long-term average from 1991 to 2020.

Snowfall:

Map showing the Winter 2025-26 snowfall forecast as a percentage of normal across the United States, highlighting areas with increased snowfall potential.

Temperatures for the heart of winter:

Map showing the temperature anomaly forecast for December 2025 to February 2026 across the United States, highlighting varying temperature ranges with color-coded keys.

The Euro loves to forecast an Alaskan ridge from December into January. Given it canโ€™t see cold, what it is seeing is impressive at 500 mb:

ECMWF seasonal forecast map showing 500 mb height and anomaly for December 2025, with contour lines and color shading indicating different pressure levels across North America and the Arctic.

The Canadian Seasonalโ€™s winter forecast last year did the best. Itโ€™s banging the drum for a cold one (as much as it can for now):

Temperature anomaly map for December 2025 to February 2026, showing colder temperatures in the northern U.S. and warmer temperatures in the southern U.S.

The last 10 days of runs from the CFSv2 Control echo the Canadian Seasonal to some extent:

Temperature anomaly map for the United States, highlighting expected temperatures for December 2025 to February 2026.

What is standing out to me is the CFSv2 SST forecast off the East Coast:

Temperature anomaly map showing cooler areas in blue and warmer areas in orange along the East Coast.

The warm ring is also getting closer to the West Coast than we have seen since the winters of 2013-14 and 2014-15:

Map showing CFSv2 seasonal sea surface temperature anomalies from December 2025 to February 2026, highlighting temperature variations across the Pacific and Atlantic Oceans.

That has a weak La Niรฑa signature, but last year, the ONI did not even make the required period for an official La Niรฑa event. It always seems to be too cold. I think a weak-to-nonexistent cool signal is on the way, and with more warm water close to the West Coast and cool water off the Northeast coast, it should allow for a lot of cold air to come into the country.

While I have no proof of this, the falling global temperatures might be something models are not handling well, as we have seen them too warm. This is the opposite of what the usual error has been over the last 10 years.

The question that is still in my mind is, what do we do with the start and end of the season (November and March)? Last year was a classic example of what can happen.

January and February looked like this:

Map showing climate division temperature anomalies in degrees Fahrenheit across the United States for January to February 2025, compared to the long-term average from 1991 to 2020.

December โ€“ February was not as cold:

Map displaying NOAA/NCEI climate division temperature anomalies in Fahrenheit for December to February 2024-25 compared to the long-term average from 1991 to 2020.

November to March, because of warming at the start and end, turned out warm:

Map of the United States displaying climate division temperature anomalies for Nov to Mar 2024-25 compared to the 1991-2020 long-term average.

Links to 13-14, 14-15

Interesting parallels to 2013 and 2014 are going on.

Both years had warmth in the Northeast Pacific.

Map showing sea surface temperature anomalies worldwide, with warmer areas in red and cooler areas in blue.
Map showing global sea surface temperature anomalies, highlighting warm and cold areas, with color gradient representing temperature variations.

Both years had well-below-normal ACE index (so did 2015, but there was a Super Nino.)

This year is similar, though on weather roids in part due to a high input of geothermal sources from southwest of Japan to east of Kamchatka.

Global sea surface temperature anomalies map for September 2025, depicting varying temperature patterns across the world's oceans.

One might wonder, if this tropical dog stays down as we are seeing, will there be a link to winter? I guess the ultimate endgame would be a surge for a time, but a below normal average ace, and then we can test Thanksgiving to Christmas, but the bigger linkage is the DJF period of winter

Map showing composite temperature anomalies across the United States from December to February for the winters of 2013-14 and 2014-15 compared to the long-term average from 1991 to 2020, illustrating temperature variations with a color gradient.

Southern Hemispheric Stratospheric warming in September

Please read this first of all:

https://www.severe-weather.eu/global-weather/south-polar-vortex-stratospheric-warming-event-weather-winter-impact-usa-canada-fa

On a personal note, I love things like this. I see the love of the weather in the writing. But when I read it, I decided to look at September 2013 and 2014 to see if there was a stratwarm event over the S Pole then.

Bingo Front row:

A weather forecast image showing temperature anomalies over Antarctica for September 2013-2014, featuring a color gradient from purple and blue to red and yellow, indicating varying temperature levels.

So, this is really interesting, as itโ€™s going on again.

Weather forecast map showing temperature anomalies and patterns, with a prominent low-pressure system illustrated in dark red, surrounded by varying shades of green and blue to indicate temperature changes across regions.

We have the NPAC link, the stratwarm link that they outline nicely, and the low ace for the hurricane season, along with the NE Pacific being so warm.

Globally, the ACE in 13,14 was below normal.

The Verdict

It appears another back-weighted hurricane season is shaping up, and I have used that to predict pre-Christmas cold shots in both 2022 and last year. The ante is upped this year because SSTs in the Pacific are suggestive of the kind of pattern that can pump an Alaskan and Western ridge. This means that once the cold comes, it may hang around, barring any MJO rotation into the โ€œkiss of deathโ€ for cold phases (Phases 4, 5, and 6). My hand-drawn map is more ambitious than the analogs, but after getting burned on being too warm on several forecasts this year (most distinctly, summer), I think the trend of models not seeing enough cold air may continue.

The 5-month period could be colder, as we have seen models overwarmed overall since last winter.

Snowfall last year was weird, with streaks of heavy snow and a lack of snow in between. I would assume that a more normal distribution will show up this year relative to temperature, and the forecast map reflects that.

I would be surprised if it turns out warmer than what I have but not surprised if it turns out colder.

Major Storm Pounds Western USโ€ฆReaches Northeastern States This Weekendโ€ฆVery Cold Next Weekโ€ฆMid-Week East Coast Storm Threat

A major storm system will pound the western states during the next couple of days and it will then trek across the nation and wreak havoc in the eastern states this weekend. In California, the rainfall in coming days will be heavy all along low-lying coastal sections from Oregon to the Mexican border, and snowfall will be measured by the foot in the Sierra Nevada Mountains.

From Watts Up With That?

Paul Dorian

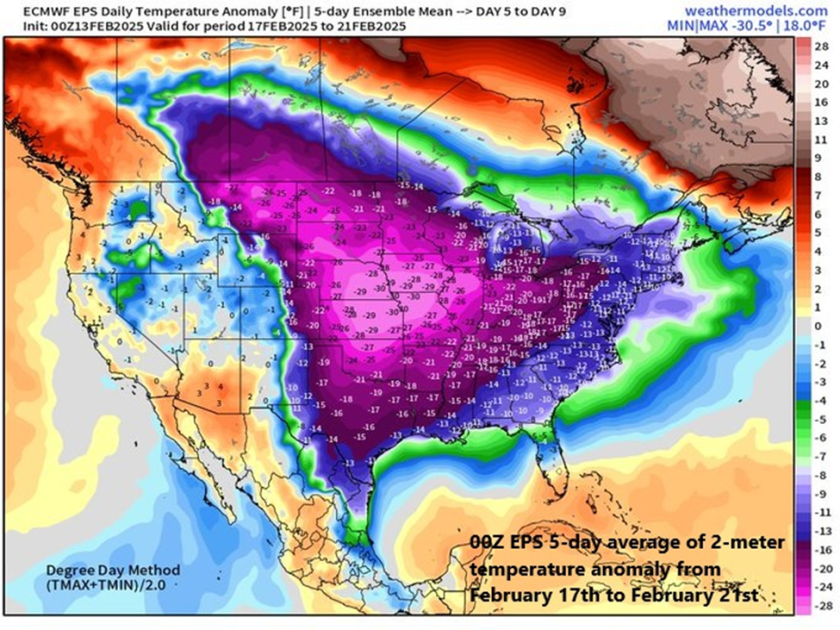
A very cold air mass will flood the northeastern states at the end of the upcoming weekend and next week looks very cold on average across the eastern 2/3rds of the nation. Map courtesy ECMWF, weathermodels.com (Dr. Ryan Maue, X)

Overview

A major storm system will pound the western states during the next couple of days and it will then trek across the nation and wreak havoc in the eastern states this weekend. In California, the rainfall in coming days will be heavy all along low-lying coastal sections from Oregon to the Mexican border, and snowfall will be measured by the foot in the Sierra Nevada Mountains. By the early part of the upcoming weekend, this same storm system will bring flooding rainfall to the Ohio and Tennessee Valleys and then significant snow is likely on Sunday across interior New York State and New England.

In the Mid-Atlantic region, there will be plenty of rainfall this weekend; however, it is likely to be preceded on the front-end by snow and accumulations are possible; especially, to the north of the PA/MD border. Cold air will pour into the eastern states following this weekend storm system and next week is indeed looking very cold across the eastern two-thirds of the nation. Low pressure is likely to gather strength in the southern states by the middle of next week aided by an influx of Gulf moisture and it could become a significant east coast storm threat by later Wednesday or Thursday.

A major storm will impact the western US during the next couple of days with significant rainfall in low-lying coastal sections and substantial snowfall in higher elevation locations. In fact, the snow will be measured by the foot in coming days across the Sierra Nevada Mountains of eastern California and substantial snow will fall in many of the Rocky Mountain States. Map courtesy NOAA, tropicaltidbits.com

Major storm crosses the country next few days

A strong storm system will pound California during the next couple of days with significant rainfall along low-lying coastal sections from Crescent City in the north to San Diego in the south. Substantial snow will fall across the higher elevations of the Sierra Nevada Mountains during this event with several feet in some spots by the latter part of the weekend. This same storm system will then cross the nation and reach the eastern states this weekend bringing flooding rainfall on Saturday to some areas such as the Ohio and Tennessee Valleys and significant accumulating snow to others on Sunday including interior New York State and New England.

The weekend will feature plenty of rainfall in the DC-to-Philly-to-NYC corridor; however, there can also be a quick thumping of snow on the front-end with accumulations on the table; especially, to the north of the PA/MD border. Any snow or sleet that does fall at the onset of the weekend event will change to rain by Saturday night and continue Sunday and some of the rain may be heavy at times. Map courtesy NOAA, tropicaltidbits.com

In the Mid-Atlantic region, the weekend weather event will range from cold and possible accumulating snow on the front-end to mild with plenty of rainfall in the middle and back-end. All of this will be followed by an influx of very cold air on Sunday night and Monday and the first half of next week will be very cold across much of the nation including the Mid-Atlantic region. On Saturday, precipitation may begin as a quick thumping of snow; especially, to the north of PA/MD border. Accumulations of a couple to a few inches are possible across eastern PA, central and northern New Jersey, and in the New York City metro area likely from the late morning to early afternoon hours. Even the DC metro region can experience some snow and/or sleet at the onset of the weekend event around mid-morning on Saturday and a coating or so is on the table. Later in the day, the precipitation will mix with and then changeover to rain and the rain will continue Saturday night and Sunday morning. Some of the rain that falls on Saturday night and Sunday morning can be heavy at times and a rumble of thunder cannot be ruled out. By later Sunday, strong low pressure to the north will drag a cold front through the region and temperatures are likely to plunge late Sunday/Sunday night from the mild levels achieved earlier in the day. 

The Madden-Julian Oscillation or MJO is predicted to push through phase 8 and into phase 1 during the next couple of weeks (indicated by arrows, left plot) and these particular phases are typically correlated with colder-than-normal conditions across the central and eastern states (boxed regions in temperature composite maps, right). The colder-than-normal weather pattern that begins in earnest next week could last all the way into the month of March. Plot courtesy ECMWF, NOAA

Very cold next weekโ€ฆpossible east coast storm threat mid-to-late week

The first half of next week looks to be very cold across much of the central and eastern US with particularly cold air centered over the central states. This outlook for colder-than-normal weather next week in the eastern half of the nation is supported by the movement of a tropical disturbance that is tracked by meteorologists using a teleconnection index known as the Madden-Julian Oscillation or MJO. Depending on its location (or โ€œphaseโ€) for the given time of year, it can provide clues as to the temperature patterns across the nation.

Next week is destined to be very cold across much of the nation and this colder-than-normal pattern could take us all the way into the month of March. The 2-meter temperature anomaly forecast map shown here for the 7-day period of February 20 โ€“ February 27 depicts much below-normal temperatures across the eastern half of the nation with a focus on the Midwest/Ohio Valley. Map courtesy ECMWF, Weather Bell Analytics

At this stage of the winter season, when the MJO moves into phases 8 and 1, temperatures are typically below normal across the central and eastern states. Indeed, it appears the MJO will push into phase 8 during the next day or so and then into phase 1 around February 22nd or soโ€ฆthis colder-than-normal pattern may even last right into the month of March.

The overall active weather pattern across the nation in recent weeks will continue through at least much of next week and one of the supporting factors has been powerful โ€œjet streakโ€ activity in the upper part of the atmosphere. This forecast map of 250 millibar winds for next Wednesday evening, February 19th, suggests strong surface low pressure may develop somewhere near the Mid-Atlantic coastline. Map courtesy NOAA, tropicaltidbits.com

By later Tuesday of next week, moisture will push northward into the Mississippi Valley resulting in snow to the north and rain down south.  Low pressure over the northern Gulf region will then make a move to the northeast and head towards the Atlantic seaboard and it will encounter plenty of cold air across the Mid-Atlantic region. Exactly how far this system moves up along the east coast remains to be seen, but the threat is there for a significant impact in the Mid-Atlantic region by the middle or latter parts of next weekโ€ฆstay tuned.

Meteorologist Paul Dorian
Arcfield
arcfieldweather.com

Follow us on Facebook, Twitter, YouTube

Video discussion (YouTube)

Study investigates influence of Arctic cold air on carbon dioxide uptake of the East Sea

The research team investigated the correlation between the East Sea’s surface-deep circulation and its carbon dioxide absorption capacity, drawing insights from 1992, 1999, 2007, and 2019 observations. During the initial period (1992-1999), the ocean absorbed 20 million tons of carbon dioxide annually.

From Phys.org

byย Pohang University of Science and Technology

Study investigates influence of Arctic cold air on carbon dioxide uptake of the East Sea

The recent cold spell has plunged South Korean into a deep freeze, resulting in the closure of 247 national parks, the cancellation of 14 domestic flights, and the scrapping of 107 cruise ship voyages. While the cold snap brought relief by significantly reducing the prevalence of particulate matter obscuring our surroundings, a recent study indicates that, besides diminishing particulate matter, it significantly contributes to the heightened uptake of carbon dioxide by the East Sea.

According to research conducted by a team of researchers, including Professor Kitack Lee from the Division of Environmental Science & Engineering at Pohang University of Science and Technology (POSTECH) and Professor Tongsup Lee and So-Yun Kim from the Department of Oceanography at Pusan National University, the cold atmosphere in the Arctic is influencing the absorption of carbon dioxide by the East Sea.

The research findings were published inย Geophysical Research Letters.

The research team investigated the correlation between the East Sea’s surface-deep circulation and its carbon dioxide absorption capacity, drawing insights from 1992, 1999, 2007, and 2019 observations. During the initial period (1992-1999), the ocean absorbed 20 million tons of carbon dioxide annually.

In the subsequent period (1999-2007), this amount decreased to under 10 million tons per year. However, in the final period (2007-2019), the carbon dioxide uptake surged to 30 million tons annually.

The team observed that the internal circulation along the East Coast within the East Sea was influenced by the Arctic cold wave. Cold air from the Arctic infiltrates the East Sea, causing the surface water, laden with carbon dioxide, to become denser. This process induces vertical ventilation as the water descends into the middle and deep ocean layers.

Consequently, the intensified descent of cold air from the Arctic strengthens the internal circulation, leading to a heightened uptake of carbon dioxide in the East Sea.

Professor Kitack Lee, who led the research, said, “The oceans represent an immense reservoir of carbon dioxide and offer a secure and sustainable avenue for mitigating atmospheric carbon dioxide levels. It is crucial to anticipate the global ocean’s capacity for carbon removal as we navigate future climate changes and identify suitable methods to leverage this potential.”

In a related development, the team’s earlier research uncovered how theย oceanย absorbs carbon dioxide. Approximately half of the carbon dioxide generated by human activities remains in the atmosphere, with the other half entering marine and terrestrial ecosystems. With aย carbon contentย 400,000 times greater than that of the atmosphere, the oceans present vast and promising potential for storing carbon dioxide.

More information: Soโ€Yun Kim et al, Climateโ€Driven Fluctuations in Anthropogenic CO2 Uptake by the East Sea in the North Pacific Ocean, Geophysical Research Letters (2023). DOI: 10.1029/2023GL105819

Journal information: Geophysical Research Letters