Global warming, climate change, all these things are just a dream come true for politicians. I deal with evidence and not with frightening computer models because the seeker after truth does not put his faith in any consensus. The road to the truth is long and hard, but this is the road we must follow. People who describe the unprecedented comfort and ease of modern life as a climate disaster, in my opinion have no idea what a real problem is.
We are told cyclones and extreme storms will be more intense in a warmer world, will have stronger wind speeds, may retain their strength longer and do more damage, our homes will be uninsurable, and this is the new normal. But the evidence continues to grow that warm times are wonderful, and the last thing we want is a colder climate.
Cyclone Yasa, Fiji | Photo from Copernicus Sentinel-3 imagery
The worst 53 cyclones that hit Fiji in the last 2,000 years were more common in the coldest times, not the warmest ones.
We are told cyclones and extreme storms will be more intense in a warmer world, will have stronger wind speeds, may retain their strength longer and do more damage, our homes will be uninsurable, and this is the new normal. But the evidence continues to grow that warm times are wonderful, and the last thing we want is a colder climate.
There aren’t many long records of cyclones in the South Pacific, which hasn’t stopped climate experts blaming cars and burgers for horrible storms. But even though life on Earth depends upon understanding our climate, it’s only now, after 40 years of panic, that finally that researchers have studied things like pebble layers, shell fragments, and coral rubble in Fiji to find out what has happened there in the past. Yanan Li and others drilled cores to find debris pushed 120m into the mangroves by the worst of the worst tropical cyclones. Handily, they also had two bad storms recorded in the last century to calibrate what they found.
Awkwardly, the big storms were more common in the Little Ice Age. Basically, if we want fewer storms, we should pay people to burn oil and gas or at least give them a taxable discount for saving the world. *
All those layers of rocks and shells and whatnot have been sitting there in the mud flats the whole time that the UN has been trying to save the world from “climate change”:
Fig 3: The course anomaly (%) means the percentage of coarse particles in that layer that are > 63 micrometer. The sediment core they dug is in protected mudflats in mangroves that are 120m above the current high tide line. Storms surges rarely go that far. “Events” means only major Cat 4-5 strength cyclones/hurricanes per century. Obviously only the biggest storms (and presumably near direct hits) would leave sediments there. Some of the particles they found were > 1cm. Fiji gets a few named cyclones every year. But these won’t have the energy to overtop the reef, break through mangroves, and carry sand and shells 120m inland.
Instead of cyclones being driven by one kindergarten variable like sea-surface temperatures (or more stupidly, global temperatures), it turns out that wind shear, humidity, local weather patterns, and things like La Nina conditions are probably a lot more important. If climate modelers had even the faintest clue of what drives the Pacific Decadal Oscillation, we could pretend to reduce storms by reducing La Nina conditions.
Until then, any journalist claiming that extreme storms are the new-normal should be roasted for promoting misinformation, or just being a gormless mouthpiece for bankers, bureaucrats and The Blob.
In this paper, we present a sedimentary record from a coastal karst basin in Bay of Islands, Vanua Balavu, Fiji to provide insight into the regional intense TC activity over the past two millennia. A total of 53 intense storm events captured by this site are identified using coarse fraction (>63 μm) anomalies in sediment core retrieved from the basin, yielding an overall average event frequency of 2.6 events/century. Multiple centennial-scale quiescent periods (from 200 to 300 CE and 1000 to 1150 CE) and active periods (namely from 350 to 750 CE, 900 to 1000 CE, 1150 to 1250 CE, 1400 to 1500 CE, and 1650 to 2017 CE) are found in the reconstruction, and the most active interval spans from 1650 to 1800 CE at 4.5 events/century.
Big storms appear to be less frequent in the medieval warm period too.
A comparison between existing paleostorm records and climate forcing indices suggests that the southward displacement of the South Pacific Convergence Zone (SPCZ) during the Little Ice Age with more La Niña events is responsible for the basin-wide increasing of tropical cyclone activity in the South Pacific. Decline of TC occurrence in the western SP during the Medieval Climate Anomaly is attributed to the northward movement of SPCZ.
*Obviously, we wouldn’t pay people much to emit CO2 because it wouldn’t save us from the next Little Ice Age anyhow, but it will make plants grow, and that’s worth something.
REFERENCES
Yanan Li et al (2025) Intense tropical cyclone activity over the past 2000 years at Bay of Islands, Fiji, Palaeogeography, Palaeoclimatology, Palaeoecology, Volume 675, 1 October 2025, 113090, https://doi.org/10.1016/j.palaeo.2025.113090
Haig, J., Nott, J. and Reichart, G. (2014) Australian tropical cyclone activity lower than at any time over the past 550–1,500 years, Nature 505, 667–671 doi:10.1038/nature12882 [Abstract]
So that’s the idea. Of course, I wasn’t interested in camping, but in climate. In particular, I wanted to find out more about my theory that emergent thermoregulatory climate phenomena are central to the surprising stability of global temperatures.
I’ve been exploring the abilities of Artificial Intelligence, which I described in a previous post as “The World’s Dumbest Genius Librarian“. I read a curious suggestion as to how to use AI, which was what they called the “blank line” technique. This is where you give the AI (in my case perplexity.ai) a list of things with a blank line “______” at the end, and it fills in the blank. The example they gave in the suggestion I read was something like “I’m going camping, and I’m taking a tent, a sleeping bag, a hatchet, and ___”. So, I tried it. Here, let me try it again right now so you can see what I mean. Hang on … OK, here’s what I got:
Me:
“I’m going camping, and I’m taking a tent, a sleeping bag, a hatchet, and ___”
Perplexity:
“Based on your camping list—tent, sleeping bag, hatchet—the next logical and essential item to bring would be a flashlight. A flashlight is crucial for safety and convenience in the outdoors, especially after dark, making it a natural addition to your camping essentials.”
So that’s the idea. Of course, I wasn’t interested in camping, but in climate. In particular, I wanted to find out more about my theory that emergent thermoregulatory climate phenomena are central to the surprising stability of global temperatures.
And what is an emergent phenomenon when it is at home? Here are the characteristics that differentiate emergent climate phenomena from other kinds of critters:
They are flow systems far from equilibrium that arise spontaneously, often upon crossing a critical threshold that is temperature-based.
Their properties are not predictable from the properties of the condition they emerge from. There’s nothing in the nature of atoms of water and air that would predict that they could spontaneously create lightning.
They move and act unpredictably.
They are often associated with phase changes.
They often exhibit “overshoot” (hysteresis).
They have a lifespan from their initiation to their dissolution.
Their patterns arise from many small interactions of their component parts.
So I used that blank line technique to find out more about emergent climate phenomena.
Me:
Among the emergent weather phenomena that help thermoregulate the temperature are thunderstorms, cirrus cloud fields, the Rayleigh-Benard overturning of the lower atmosphere and the upper ocean, cyclones, the Nino/Nina phenomena, tornadoes, dust devils, and _____
The first answer I got was:
Perplexity:
Among the emergent weather phenomena that help thermoregulate the temperature—such as thunderstorms, cirrus cloud fields, Rayleigh-Bénard overturning in the lower atmosphere and upper ocean, cyclones, the Niño/Niña phenomena, tornadoes, and dust devils—another significant process is volcanic eruptions.
BZZZT! Wrong, sez I! So I followed that with:
Nope. Volcanoes are 1) not an emergent phenomenon, and 2) not thermoregulatory in nature in that they act regardless of the temperature. Try again.
Perplexity:
Based on the context of emergent, temperature-triggered weather phenomena that actively help thermoregulate Earth’s climate, the most fitting completion for your list is cumulus cloud fields or cumulus convection.
Cumulus clouds, like thunderstorms, form when surface heating reaches a critical threshold, leading to vigorous upward convection. This process increases cloud cover and enhances the reflection of incoming solar radiation, thereby cooling the surface and stabilizing temperatures. This mechanism is described as a classic emergent thermoregulatory process—appearing spontaneously when local temperatures rise above a certain point, and acting to limit further warming
That showed me that perplexity had gotten the underlying idea. So I said that was a good answer, find me another example. It gave me another. I only asked perplexity for one at a time, because AI does better with single questions.
I repeated that a whole bunch of times, getting answers I’d thought of before, and answers it had given me upthread in a different form, and answers that were a total surprise to me.
I then asked perplexity to read through the whole thread, select the unique, distinct answers, and say why they are emergent phenomena rather than some other kind of phenomena, what their thermoregulatory action is, and how they are distinct from the other phenomena on the list. Below is what I got, unedited. And while I might quibble about some parts of the descriptions, overall it was a fascinating list.
Comprehensive Synopsis of Emergent Thermoregulatory Weather Phenomena
Thunderstorms
Emergence: These form spontaneously when surface heating creates convective instability that crosses critical temperature and humidity thresholds. The process is nonlinear, with small changes in conditions triggering explosive growth beyond predictable models.
Thermoregulatory Function: They vertically transport heat through updrafts and downdrafts while increasing planetary albedo via anvil clouds. Additionally, rainfall induces evaporative cooling at the surface, disrupting localized heat buildup.
Distinctiveness: Unlike planetary-scale oscillations, thunderstorms are short-lived, highly localized convective events driven by surface heating rather than large-scale wind patterns.
Cirrus Cloud Fields
Emergence: Self-organizing ice crystal structures arise from wave-induced humidity fluctuations in the upper troposphere. Their formation depends on nonlinear ice-nucleation dynamics that defy simple prediction.
Thermoregulatory Function: These clouds trap outgoing longwave radiation (warming) while reflecting sunlight (cooling), creating a context-dependent net effect. They modulate radiative balance across regional scales without producing precipitation.
Distinctiveness: Their wispy, high-altitude structure contrasts sharply with low marine stratocumulus decks, functioning more as radiative modulators than convective triggers.
Rayleigh-Bénard Overturning
Emergence: Convection cells emerge spontaneously when surface heating exceeds critical buoyancy thresholds in fluid layers. This self-organization stems from nonlinear feedback between temperature gradients and fluid viscosity.
Thermoregulatory Function: Cells vertically mix heat in atmospheric/oceanic boundary layers, preventing extreme surface temperatures. They maintain stability by continuously redistributing energy from heated surfaces to cooler layers.
Distinctiveness: As a universal fluid dynamic process, it operates in both oceans and atmosphere, unlike event-driven phenomena like haboobs or derechos.
Cyclones
Emergence: These large-scale vortices self-organize when wind shear, humidity, and sea-surface temperatures cross instability thresholds. Their structure emerges from nonlinear ocean-atmosphere coupling.
Thermoregulatory Function: Cyclones redistribute equatorial heat poleward via winds and induce evaporative cooling through heavy rainfall. They act as planetary-scale heat engines, balancing latitudinal temperature gradients.
Distinctiveness: Their synoptic scale and multi-day lifespan differ from mesoscale phenomena like bow echoes or gust fronts.
El Niño-Southern Oscillation (ENSO)
Emergence: This pattern arises nonlinearly from coupled ocean-atmosphere feedbacks in the tropical Pacific. Threshold-crossing events trigger phase transitions between warm and cold states.
Thermoregulatory Function: ENSO modulates global heat distribution by altering ocean currents, upwelling, and atmospheric circulation. It regulates equatorial Pacific temperatures over multi-year timescales.
Distinctiveness: Its interannual pacing contrasts sharply with diurnal processes like sea breezes or nocturnal boundary layer mixing.
Tornadoes
Emergence: These form spontaneously when supercell thunderstorms interact with wind shear and convective instability. Their rotation emerges from nonlinear vorticity dynamics.
Thermoregulatory Function: Tornadoes rapidly mix warm surface air with cooler upper-level air, disrupting heat buildup. Their intense updrafts/downdrafts enhance local heat redistribution.
Distinctiveness: Their small-scale, violently rotating structure differs from non-rotational density currents like gust fronts.
Dust Devils
Emergence: Self-organizing vortices arise when intense surface heating creates localized thermal instability. Their formation depends on nonlinear interactions between hot surface layers and cooler air.
Thermoregulatory Function: They lift hot surface air upward, replacing it with cooler air and enhancing vertical mixing. This process disrupts near-surface heat accumulation in arid regions.
Distinctiveness: As dry, warm-core vortices, they lack the moisture-driven dynamics of thunderstorms or monsoons.
Cumulus Convection
Emergence: Fluffy clouds self-assemble when surface heating exceeds convective initiation thresholds. Their growth is a nonlinear response to boundary layer instability.
Thermoregulatory Function: Cumulus clouds increase albedo to limit surface heating and promote cooling through shade and latent heat release. They act as precursors to deeper convective systems.
Distinctiveness: This represents an early convective phase distinct from mature mesoscale complexes or anvil-topped thunderstorms.
Madden-Julian Oscillation (MJO)
Emergence: Spontaneous convection clusters propagate eastward via wind-moisture feedbacks in the tropics. Its emergence stems from collective atmospheric interactions crossing organizational thresholds.
Thermoregulatory Function: The MJO modulates tropical heat buildup through cyclic cloud/rain development. It redistributes moisture and energy across ocean basins over 30–60 day periods.
Distinctiveness: As a planetary-scale traveling system, it differs from stationary monsoons or localized convective events.
Monsoon Circulation
Emergence: This system self-organizes when land-sea thermal contrasts exceed seasonal thresholds. Its onset involves nonlinear feedback between precipitation and atmospheric heating.
Thermoregulatory Function: Monsoons cool land surfaces via cloud cover and rainfall while exporting heat to the upper troposphere. They reset regional energy imbalances annually.
Distinctiveness: Their seasonally reversing winds contrast with diurnal coastal breezes or persistent trade winds.
Sea Breeze Circulation
Emergence: Forms spontaneously when land-sea temperature gradients overcome atmospheric resistance. The circulation emerges from nonlinear pressure adjustments.
Thermoregulatory Function: It transports cool marine air inland to moderate coastal temperatures and triggers convective clouds for additional cooling. The nightly reversal prevents excessive cooling.
Distinctiveness: This diurnal, coastal-scale process differs from continental-scale cyclones or monsoons.
Stratocumulus Cloud Decks
Emergence: Self-organizing cloud blankets form under stable marine boundary layers with strong inversions. Their persistence arises from turbulence-radiation feedback loops.
Thermoregulatory Function: These decks dramatically increase albedo to cool subtropical oceans. They suppress surface warming through persistent solar reflection.
Distinctiveness: Their uniform, low-altitude structure contrasts with transient cumulus or deep convective clouds.
Reflective Tropical Cloud Shields
Emergence: Spontaneously form when sea-surface temperatures exceed critical convection thresholds. Their development is a nonlinear response to oceanic heating.
Thermoregulatory Function: These shields limit solar heating via high albedo and often precede thunderstorm development. They act as a tropical thermostat constraining maximum temperatures.
Distinctiveness: Their thermodynamic triggering differs from dynamically driven systems like the ITCZ.
Intertropical Convergence Zone (ITCZ)
Emergence: Self-organizing convection bands arise from trade-wind convergence and SST gradients. Position emerges from hemisphere-scale energy imbalances.
Thermoregulatory Function: The ITCZ cools tropics through cloud albedo and latent heat export. Its seasonal migration balances interhemispheric energy.
Distinctiveness: As an equatorial migratory belt, it differs from off-equatorial systems like the MJO.
Mesoscale Convective Systems (MCSs)
Emergence: Thunderstorms self-aggregate into complexes via cold-pool interactions. Their structure emerges from nonlinear storm-scale feedbacks.
Thermoregulatory Function: MCSs increase albedo with expansive cloud shields and induce evaporative cooling via rainfall. They redistribute heat over regions spanning hundreds of kilometers.
Distinctiveness: Their organized cluster structure differs from isolated thunderstorms or synoptic-scale cyclones.
Hadley Cell Expansion
Emergence: Intensifies nonlinearly from tropical heating and eddy feedbacks. Poleward expansion emerges when thermal gradients cross critical thresholds.
Thermoregulatory Function: The cell exports heat poleward and modulates subtropical aridity. Its widening redistributes energy across hemispheres.
Distinctiveness: As a zonal-mean circulation, it contrasts with longitudinal phenomena like the MJO.
Polar Vortex Dynamics
Emergence: Self-amplifies from temperature/pressure gradients at high latitudes. Disruptions emerge from stratosphere-troposphere coupling.
Thermoregulatory Function: Contains frigid air; breakdowns export cold to mid-latitudes. This stabilizes polar temperatures while balancing hemispheric extremes.
Distinctiveness: Its stratospheric coupling differs from surface-driven phenomena like dust devils.
Cumulus-to-Cumulonimbus Transition
Emergence: Explosive vertical growth triggers when convective instability thresholds are crossed. This phase shift is a nonlinear atmospheric response.
Thermoregulatory Function: Rapid downdrafts and rain evaporation cool surfaces immediately. The process resets local instability by exporting heat vertically.
Emergence: Spontaneous cloud suppression occurs when temperatures fall below convection thresholds. Emergence depends on humidity-temperature hysteresis.
Thermoregulatory Function: Clearing allows solar heating to counterbalance cool conditions. This negative feedback prevents prolonged cooling periods.
Distinctiveness: Functions as the inverse of cloud-forming systems like MCSs or ITCZ convection.
Atmospheric Blocking
Emergence: Self-sustaining highs form from Rossby wave resonance. Persistence emerges from nonlinear energy trapping.
Thermoregulatory Function: Blocks redistribute heat/cold via meridional flow and prolong temperature extremes regionally. They modulate zonal heat transport efficiency.
Distinctiveness: Their quasi-stationary synoptic scale differs from traveling cyclones.
Open/Closed-Cell Stratocumulus
Emergence: Cellular patterns form spontaneously from turbulence-radiation feedbacks. Transitions exhibit hysteresis and critical thresholds.
Thermoregulatory Function: Open cells enhance infrared cooling; closed cells increase solar reflection. This dynamic optimizes local energy balance.
Distinctiveness: Pattern transitions differ from uniform decks or cumulus evolution.
Synoptic-Scale Air Advection
Emergence: Warm/cold surges arise from jet stream meanders. Their onset depends on pressure-anomaly interactions crossing instability thresholds.
Thermoregulatory Function: Advection rapidly redistributes air masses across continents. It prevents persistent regional temperature anomalies.
Distinctiveness: Driven by continental-scale dynamics unlike local convection.
Heat Bursts
Emergence: Downdrafts compress and warm adiabatically during thunderstorm collapse. Emergence requires specific vertical humidity/temperature profiles.
Thermoregulatory Function: Bursts mix elevated warm air downward, disrupting cold pools. They abruptly reset nocturnal surface temperatures.
Distinctiveness: Nocturnal, hyper-localized spikes differ from diurnal sea breezes.
Haboobs
Emergence: Thunderstorm outflow self-organizes into dust-laden density currents. Dust integration amplifies through particle-fluid feedbacks.
Thermoregulatory Function: Dust clouds increase albedo while cold pools enhance surface cooling. They rapidly export heat via dry convection.
Distinctiveness: Dust-integrated structure differs from precipitation-driven outflows.
Chinook/Foehn Winds
Emergence: Self-amplifying downslope winds form from mountain-wave dynamics. Warming emerges via nonlinear compressional heating.
Thermoregulatory Function: Winds rapidly warm leeward slopes, reducing cold extremes and melting snow. They ventilate valleys by exporting stagnant air.
Distinctiveness: Orographic triggering differs from flat-terrain wind systems.
Quasi-Resonant Amplification (QRA)
Emergence: Rossby waves resonate from jet stream instabilities and topography. Persistence emerges from atmospheric wave trapping.
Thermoregulatory Function: QRA locks heat/cold into semi-permanent regional patterns. This prolongs temperature redistribution during extremes.
Distinctiveness: Resonance-driven persistence differs from transient easterly waves.
Tropical Easterly Waves
Emergence: Self-generate from trade-wind shear and convective feedbacks. Wave organization crosses critical moisture convergence thresholds.
Thermoregulatory Function: Waves organize cloud clusters to modulate tropical heating. They propagate moisture imbalances westward.
Distinctiveness: Westward propagation contrasts with eastward-moving MJO systems.
Atmospheric Rivers
Emergence: Filamentary moisture plumes self-focus from wind convergence. Narrowing emerges via vapor-condensation feedbacks.
Thermoregulatory Function: Rivers redistribute latent heat globally and induce cooling via orographic precipitation. They prevent continental overheating during droughts.
Distinctiveness: Filamentary structure differs from broad monsoonal flows.
Derechos
Emergence: Squall lines self-organize into bows via cold pool-wind shear interactions. Bow echoes emerge from nonlinear storm-scale dynamics.
Thermoregulatory Function: Straight-line winds drive large-scale mixing and surface cooling. Their cold pools disrupt regional heat domes.
Distinctiveness: Non-rotational windstorms differ from tornadoes or cyclones.
Virga
Emergence: Precipitation evaporates spontaneously in dry subcloud layers. Phase-change thresholds govern fallstreak formation.
Thermoregulatory Function: Evaporative cooling lowers surface temperatures without rainfall. This provides “dry” heat redistribution in arid zones.
Distinctiveness: Evaporation-dominated process differs from rain-cooling in thunderstorms.
Cold-Air Pool Formation
Emergence: Cold air self-traps in topography when radiative cooling exceeds mixing thresholds. Pooling emerges from nonlinear density stratification.
Thermoregulatory Function: Pools insulate valleys from extreme cold and delay daytime warming. Their eventual mixing exports cold air regionally.
Distinctiveness: Topographic confinement differs from open-terrain radiative cooling.
Bow Echoes
Emergence: Spontaneous bowing develops from rear-inflow jet dynamics. Acceleration emerges via pressure-perturbation feedbacks.
Distinctiveness: Mesoscale bow geometry differs from linear squall lines.
Gust Fronts
Emergence: Density currents self-propagate from thunderstorm downdraft spreading. Frontogenesis depends on outflow-environment density contrasts.
Thermoregulatory Function: Gust fronts induce rapid cold-air advection to disrupt heat buildups. They often trigger secondary convection for additional cooling.
Distinctiveness: Leading-edge dynamics differ from parent storm mechanisms.
Fair-Weather Gale (California)
Emergence: Intense inland heating draws marine air through coastal gaps nonlinearly. Gale strength emerges from terrain-channeled acceleration.
Thermoregulatory Function: Persistently cools interior valleys via onshore flow. Prevents extreme heat buildup in Mediterranean climates.
Distinctiveness: Non-storm coastal wind differs from synoptic systems.
Diablo Winds
Emergence: Downslope warming self-accelerates from pressure-topography feedbacks. Wind intensity emerges via dry adiabatic compression.
Thermoregulatory Function: Rapidly warms coastal zones by breaking cold pools and fog. Exports interior heat seaward during autumn.
Distinctiveness: Northern California variant differs from Southern California’s Santa Anas.
Oceanic Bénard Cells
Emergence: Hexagonal convection forms spontaneously during surface cooling events. Cell geometry emerges from salt-fingering instabilities.
Thermoregulatory Function: Upwells warmer water to limit sea-ice formation. Enhances ocean-atmosphere heat exchange during cold outbreaks.
Distinctiveness: Salinity-driven convection differs from atmospheric overturning.
Synthesis of Thermoregulatory Networks
Earth’s climate stability arises from interconnected emergent phenomena operating across scales. Each process exhibits nonlinear threshold behavior, where small forcings trigger disproportional responses that redistribute heat. This network—from microscale dust devils to planetary-scale ENSO—forms a self-regulating system where local interactions constrain global temperature extremes through complementary cooling/warming feedbacks. The diversity of mechanisms (radiative, convective, advective) ensures resilience, as the suppression of one process activates compensatory phenomena elsewhere in the system.
Dang, sez I, who knew? Certainly not me … most fascinating. I hadn’t realized that a number of those were emergent thermoregulatory phenomena, but yes, they are. And while I had not asked for a synthesis of thermoregulatory networks at the end, that’s a pretty good one.
I’m gonna leave it at that for people to ponder, with just one last thought.
Many of those important thermoregulatory phenomena either do not emerge spontaneously in climate models or are not even considered because they are sub-grid-scale in size.
My best regards to all,
w.
As usual … when you comment QUOTE THE EXACT WORDS YOU ARE DISCUSSING. It avoids heaps of problems.
PS—I won’t be around for about six hours, starting about half an hour after this goes live. I’m going to the Russian River Rodeo with the kids and grandkids. Hey, I grew up on a cattle ranch, the local rodeo was the highlight of the year in my youth, what can I say? So play nice, no eye gouging, don’t go all Tyson on your opponent’s ear, and I’ll get back to you when I return.
In a recent editorial published by Phys.org, researchers claim that climate change is driving more powerful and frequent hurricanes, which in turn are causing widespread school closures labeling it an “overlooked consequence” of our supposedly worsening climate. This narrative is false. The available data shows no trend of increasing hurricane frequency or intensity due to human-induced climate change, and if the storms themselves aren’t worsening, the claim that they are causing more missed school days due to climate change collapses under its own weight.
In a recent editorial published by Phys.org, researchers claim that climate change is driving more powerful and frequent hurricanes, which in turn are causing widespread school closures labeling it an “overlooked consequence” of our supposedly worsening climate. This narrative is false. The available data shows no trend of increasing hurricane frequency or intensity due to human-induced climate change, and if the storms themselves aren’t worsening, the claim that they are causing more missed school days due to climate change collapses under its own weight.
The central claim that hurricanes are becoming more destructive and frequent due to climate change is contradicted by both long-term observational data and the official position of major scientific institutions.
According to the National Oceanic and Atmospheric Administration’s (NOAA) Geophysical Fluid Dynamics Laboratory (GFDL), there is no strong evidence of an increase in either the number or intensity of hurricanes globally due to human-caused climate change. In fact, NOAA writes:
“It is premature to conclude with high confidence that increasing atmospheric greenhouse gas concentrations have had a detectable impact on Atlantic basin hurricane activity.”
NOAA, while careful to attribute a “possible” increase in storm intensity in some basins, is consistent in stating that natural variability plays a dominant role in hurricane behavior, particularly in the Atlantic, where multidecadal oscillations—like the Atlantic Multidecadal Oscillation (AMO)—are primary drivers of activity.
Moreover, NOAA’s Historical Hurricane Tracks database reveals that the frequency of U.S. landfalling hurricanes has not increased over the past century. What’s more telling is that major hurricane (Category 3 and above) landfalls have remained steady or even declined slightly when viewed across long-term records. (See the figure, below)
Figure 1. This figure shows that global hurricane and tropical cyclone activity is not increasing. Even with the slight uptick in the number of tropical storms in 2021, it is still below the peak recorded in 1971. Source: Ryan N. Maue, “Global Tropical Cyclone Activity,” Climate Atlas, accessed May 4, 2025.
In fact, as Climate at a Glance: Hurricanes notes, 2005 to 2016 marked the longest stretch in U.S. history without a major hurricane making landfall, a record-shattering 11-year hiatus. If climate change were fueling more severe hurricanes impacting the USA, where were they hiding for over a decade?
Even the often-cited Intergovernmental Panel on Climate Change (IPCC) agrees. Their AR6 Working Group I report states there is “low confidence” in long-term (centennial-scale) increases in the frequency or intensity of hurricanes. That’s not a skeptical website talking—it’s the IPCC itself admitting the data doesn’t justify alarmism.
The authors of the Phys.org piece make the speculative leap from “climate-driven hurricanes” to “missed school days.” But their logic runs off the rails here. There’s no credible evidence that links climate change to educational disruptions. Even if storm-related school closures are increasing in some areas, the cause is due to shifts in administrative policy, liability concerns, and enhanced emergency response protocols, rather than more intense weather.
Schools today have better warning systems in place for inclement weather and are quicker to close as a precaution than they were 20 or 30 years ago. In decades past, a Category 1 hurricane approaching the coast would maybe result in a weather warning; today it often leads to multi-day shutdowns, even in regions that escape the brunt of the storm. That change reflects institutional behavior—not climatological shifts.
Hurricanes have always disrupted coastal life, but because there is no evidence hurricane numbers or intensity have increased during the recent period of slight warming, it is impossible to attribute any increase in school closures to climate change induced hurricanes.
This article is a textbook example of shoddy research dressed up as urgent policy insight. By stretching an already weak climate claim—about worsening cyclones—into an even more tenuous social consequence—missed school days—it commits the cardinal sin of science: drawing sweeping conclusions from flimsy, cherry-picked evidence. There is no measurable increase in hurricane strength or frequency. Therefore, there is no climate change driven crisis of school disruption. The authors of this editorial should get an “F” in climate literacy— for failing the scientific smell test. Readers deserve better than this kind of unsupported alarmism.
A recent article posted at German news site Deutsche Welle (DW) titled “Heat waves, floods, and cyclones disrupt school for millions,” discusses a report from the United Nations International Children’s Emergency Fund (UNICEF) which claims that poorer countries are the hardest hit by the so-called climate crisis in the form of extreme weather in 2024, leading to disruptions in the education of underprivileged children. This is false. While it is true that extreme weather events can do greater harm to people in poorer countries, it is not true that extreme weather events are becoming more frequent or severe there.
A recent article posted at German news site Deutsche Welle (DW) titled “Heat waves, floods, and cyclones disrupt school for millions,” discusses a report from the United Nations International Children’s Emergency Fund (UNICEF) which claims that poorer countries are the hardest hit by the so-called climate crisis in the form of extreme weather in 2024, leading to disruptions in the education of underprivileged children. This is false. While it is true that extreme weather events can do greater harm to people in poorer countries, it is not true that extreme weather events are becoming more frequent or severe there. Therefore, climate change can’t be an “overlooked” cause of disrupted education as they claim. The reason people in poorer countries suffer more when natural disasters strike is precisely because they are poor and lack the technologies, infrastructure, and institutions that have arisen in developed countries, in part a result of fossil fuel dependent economic progress, to anticipate, face, respond to and recover from extreme weather events.
The DW post explained that extreme weather caused disruptions in school for “approximately 242 million children across 85 countries in 2024,” according to UNICEF, and goes on to say that “[o]ne in seven students could not attend school due to heat waves, floods, cyclones, and other extreme weather conditions.” Most of the children affected were from poorer countries, and UNICEF reported that the worst hit areas were in Southeast Asia.
It is a fact that extreme weather hits the poor worse, a fact commonly but falsely linked to climate change. Regardless of climate change’s alleged effects on weather, people who live in underdeveloped areas with limited access to stable utilities like electricity, and modern structures and infrastructure, suffer greater harm when natural disasters strike than people in relatively wealthier countries.
That being said, extreme weather is not getting worse. DW mentions heat waves, floods, and cyclones as examples, and it is common enough in the media to claim these events are becoming more frequent or extreme, but available data refutes such claims.
Globally, looking at the region UNICEF highlights as the worst hit by weather events, let us first take a look at heat waves. India is frequently pointed at in the media as suffering from erratic weather patterns, and last year the city of Delhi supposedly hitting all-time high temperatures, which turned out to be the result of an urban sensor error. The fact that it was urban is very important, because the commonality between many places in developing countries as well as developed countries is that urban locations are already consistently hotter than the surrounding regions. In India in particular, climatologist Roy Spencer showed how the Urban Heat Island (UHI) effect is strongest in places with high populations and urban sprawl, which can be seen in maps tracing the most populous parts of India and air temperature. (See image below)
If heat is disruptive to schooling in Southeast Asia, the solution is to promote more widespread availability of air conditioning and better building construction, not blaming climate change and suppressing the cheap energy required to make that development possible.
The Intergovernmental Panel on Climate Change (IPCC) has not found that flooding has not become more severe or frequent as a result of the modest warming of the past hundred-plus years. Climate at a Glance: Floods points out that the IPCC gives only “low confidence” in any sign of change, meaning it is as likely climate change would decrease floods as it would increase them. Studies looking at flood frequency support the IPCC’s finding. For example, one study in the Journal of Hydrology reports that the number of major floods in recent decades have been “about the number expected due to chance alone,” and that evidence for changes to flood patterns globally is lacking.
Cyclones are likewise not getting worse, this is the easiest record to pull, and Climate Realism has produced that data extensively in other posts, including ones focusing on the Pacific and South Asia, here, and here. The latter post discusses a recent study published in Nature which examines hurricane/cyclone storm severity in various ocean regions. That study notes for the South Pacific and South Indian Ocean region data show declining trends in tropical cyclone destructive potential. (See figure below)
Figure 2: Graphic from Tu, S., Hu, Z., Liang, M. et al. Decreasing trend in destructive potential of tropical cyclones in the South Indian Ocean since the mid-1990s. Commun Earth Environ 5, 543 (2024). https://doi.org/10.1038/s43247-024-01683-2
Again, as with heatwaves, logically one must understand countries with limited resources, slow or non-existent economic growth, underdeveloped infrastructure, often disorganized or corrupt governments, or experiencing civil strife,—are going to be worse off when disaster strikes. This does not mean that climate change targets the poor, nor does it indicate that there is an increasing urgency (or any need at all) to somehow address it, usually by abandoning fossil fuel use.
The idea that we should stop using the cheap energy supplied by oil, gas, and coal is almost always the underlying message in stories claiming that climate change is hurting people. By contrast, since fossil fuel development and use, combined with strong property rights, and sound institutions, have been critical to wealth creation in developed countries, the same factors should be encouraged in developing countries to help their people rise out of poverty, with one result that they would be better prepared to face extreme weather regardless of the type or cause.
The UNICEF report itself seemed like it was primarily interested in justifying funding from climate coffers going towards its programs, in this case, for education for third-world residents. While providing education and school buildings to kids in poor countries is a noble goal, trying to tie funding to causes that would damage the advancement of infrastructure in those same places is foolish at best. Extreme weather is not getting worse, and trying to prevent or hinder the use of fossil fuels will not help poor countries modernize or improve the educational prospects for their children.
When it comes to extreme weather, cyclones are top of my list. The most extreme cyclone to hit Queensland, Tropical Cyclone Mahina, was arguably the world’s most intense with a central pressure recorded at 880 hectopascals, a 12-metre storm surge, and 300 kilometre per hour winds. It was named, by Queensland government meteorologist, Clement Wragge. That was in 1899 – 126 years ago.
When it comes to extreme weather, cyclones are top of my list. The most extreme cyclone to hit Queensland, Tropical Cyclone Mahina, was arguably the world’s most intense with a central pressure recorded at 880 hectopascals, a 12-metre storm surge, and 300 kilometre per hour winds. It was named, by Queensland government meteorologist, Clement Wragge. That was in 1899 – 126 years ago.
Contrary to popular narratives cyclones are not becoming more intense, and their frequency is waning. CSIRO research has confirmed a statistically significant downward trend in the annual number of tropical cyclones in the Australian region over the period extending from 1981/82 to 2017/18 that is during the satellite period. The intensity of these cyclones is also in decline.
The number and intensity of cyclones crossing the Australian mainland is in decline but only considering the last 50 years.
This is perhaps some comfort to those watching the approach of Tropical Cyclone Alfred in southeast Queensland and northeast New South Wales. TC Alfred has a central pressure of 978 hectopascals (1316 UTC 6th March 2025) and is sustaining winds near its centre of 95 kilometres per hour with wind gusts to 130 kilometres per hour already being experienced along the coast to Lennox Heads.
TC Alfred will pack a bad punch. But southeast Queensland and northern New South Wales have sustained such low pressure and strong winds before. The best idea is to make sure you have a stash of water, and also a gas cylinder. There is nothing quite like being able to make a cup of tea on the camping stove when the mains electricity and water is not working.
In fact, during the period 1935 to 1974 every other year there was a cyclone making landfall as far south as Brisbane and into New South Wales. There were two cyclones making landfall as far south as New South Wales in 1934: on January 30th and then again on February 19th. Two cyclones also made landfall in New South Wales in 1959: TC Beatrice and TC Connie. These four cyclones are listed in a journal article by J.L. Gray et al. entitled ‘On the Recent Hiatus of Tropical Cyclones Landfalling in NSW, Australia’ published in the Journal of Southern Hemisphere Earth Systems Science in 2020.
The climate follows cycles, and it is the case that there has been a hiatus of tropical cyclones making landfall near Brisbane.
There was a period of some decades during the first half of the twentieth century when cyclones were given numbers rather than names. That was immediately following the formation of the Australian Bureau of Meteorology and the appointment of Henry A. Hunt as its founding director on 1 January 1907.
Headquartered in Melbourne, the first thing Hunt did was focus on consolidating ‘the disparate’ state services. In fact, he immediately sacked Clement Wragge and some other first-class meteorologists with attitudes and also discontinued Wragge’s naming of cyclones.
Wragge was ahead of his time. Hunt did recognise the value of the white louvred boxes, now known as Stevenson screens, that Wragge began using in some parts of Queensland a good two decades before they were later installed, under Hunt’s directives in New South Wales and Victoria beginning only in 1908. So, a reliable temperature record exists back to the late 1880s for parts of Queensland, a good twenty years before the southern states.
We know from the work of Clement Wragge, still denied by many particularly in Melbourne, that not only were the cyclones severe back in the 1890s it was also very hot sometimes.
It is a large system, a large cyclone, right now sitting just off shore from Brisbane.
It is definitely time to put the surf boards and paddle boards away.
It’s a slow moving category 2 storm, that won’t set any wind speed records, but will cross paths with 3 or 4 million people. Current wind speeds at 20 locations are available here. Let’s just hope it doesn’t rain for too long. The latest BOM report says sustained winds are 95km / hour with gusts to 130 km/hr. (Roughly 60 to 80 mph).
If “Climate Change” has any effect on Australian cyclones, it’s to reduce them:
With the usual logic and reason of top climate experts, this suggests that car engines, burgers, cows and coal can prevent cyclones. Anyone driving an EV, or eating vegeburgers clearly doesn’t care about koalas (or delicate solar panels):
Last month a small but powerful cyclone named Chido made landfall in Mayotte before sweeping into Mozambique, causing considerable damage and leading to the loss of around 100 lives. Days after the tragedy, the Green Blob-funded Carbon Brief noted that scientists have “long suggested” that climate change is making cyclones worse in the region, while Blob-funded World Weather Attribution (WWA) at Imperial College London made a near-instant and curiously precise estimate that a Chido-like cyclone was about 40% more likely to happen in 2024 than during the pre-industrial age.
Last month a small but powerful cyclone named Chido made landfall in Mayotte before sweeping into Mozambique, causing considerable damage and leading to the loss of around 100 lives. Days after the tragedy, the Green Blob-funded Carbon Brief noted that scientists have “long suggested” that climate change is making cyclones worse in the region, while Blob-funded World Weather Attribution (WWA) at Imperial College London made a near-instant and curiously precise estimate that a Chido-like cyclone was about 40% more likely to happen in 2024 than during the pre-industrial age. Not to be outdone, Green Blob-funded cheerleader the Guardian chipped in with the obligatory “cyclones are getting worse because of the climate emergency”. Almost unnoticed, it seems, among all the Net Zero dooming and grooming was a science paper published during December by Nature that found no increase in the destructive power of cyclones – the generic term for typhoons and hurricanes – in any ocean basin over the last 30 years. In the South Indian basin, the location of cyclone Chido, there was a dramatic decrease in both frequency and duration in recent times.
Reality rarely gets much of a look-in these days when fanatical Net Zero activism is afoot, but the paper, written by a group of Chinese meteorologists, makes its case by considering the facts and the data. The scientists apply a “power dissipation index” (PDI) which they consider superior to single measure indicators since it combines storm intensity, duration and frequency. The graphs below show the cumulative index for tropical cyclones across all ocean basins along with a global indication.
Downward trends in the cumulative PDI can be seen in a number of Pacific regions, while the trend holds steady in the North Atlantic. The southern Indian ocean downward trend is particularly pronounced while the overall global line is also heading in a similar direction.
So why does all this scientific twaddle get written by the green activists in mainstream media? Much of it arises from the new pseudoscience that claims it can tie individual weather events to human-caused climate change. Press releases peddling climate Armageddon are issued days after a natural disaster and are eagerly reprinted by activist journalists promoting the Net Zero fantasy. The distinguished science writer Roger Pielke Jr. is a fierce critic of this new pseudoscience, which he calls weather attribution alchemy. In a recent Substack post in the aftermath of Chido, he noted that the WWA at Imperial College simply assumes the conclusion that it seeks to prove by accepting that every storm is made stronger because of warmer oceans. Using this explanation, continues Pielke, it is straightforward to conclude that the storm was made more likely due to climate change. Or as Imperial states: “The difference in the storm intensity and likelihood of this storm intensity between the counterfactual climate and today’s climate can be attributed to climate change.”
As the new Chinese paper shows, the matter is not quite so simple. Pielke notes that tropical storms encounter numerous environmental influences such as vertical wind shear and storm-induced ocean surface cooling, even when they remain over warmer waters. “Such complexities mean that simple storyline attribution – warmer oceans predictably mean stronger storms – is inappropriate when used to characterise the behaviour of individual storms,” he argues. Pielke also comes down hard on the statistical evidence backing the WWA claims. Even if storms such as Chido were more likely in the future, it would take a very long time to detect a significant change using the threshold 90% confidence set down by the Intergovernmental Panel on Climate Change (IPCC). And by very long time, he means thousands of years.
“Perhaps that is why assumptions are favoured over evidence,” suggests Pielke.
There were plenty of assumptions on display in a now routine end-of-year weather report from the BBC headed: ‘A year of extreme weather that challenged billions.‘ Written by Esme Stallard, it claims that record-breaking heat brought extreme weather including hurricanes and month-long droughts. Pride of place is given to Dr. Friederike Otto, lead of WWA and Senior Lecturer in Climate Science at Imperial, who claimed: “We are living in a dangerous new era – extreme weather caused unrelenting suffering.” “The impacts of fossil fuel warming has never been clear or more devastating than in 2024,” she added.
The redoubtable Paul Homewood is unimpressed with Stallard’s opening line about increasing extreme weather and has filed a complaint with the BBC. Stallard goes on to list a handful of random events, “but fails to provide any evidence that these are anything other than natural events which happen all the time”, states Homewood. “Nor is any evidence provided that such events have been getting more frequent or extreme over time,” he adds.
The BBC story highlighted typhoons in the Philippines as well as hurricane Beryl and stated that such events may be increasing in intensity due to climate change. Official data do not show any evidence of them becoming more powerful over time, notes Homewood. Much play was made of a recent drought in the Amazon, but Homewood points out that the World Bank Climate Portal reveals that rainfall has increased in the area by 5% over the last 30 years. Throughout the report, observes Homewood, the BBC bases its claims on weather attribution computer models. “However, computer models are not evidence, and can be manipulated to provide whatever results are desired. That is why they are widely derided by the wider scientific community,” he states.
For Roger Pielke, extreme weather attributions are “puzzling”. The most charitable explanation for their proliferation is that there is a demand for them, including from many in the media. The demand will be filled by someone, he concludes. “A less charitable explanation is that there is a systematic effort underway to contest and undermine actual climate science, including the assessments of the IPCC, in order to present a picture of reality that is simply false in support of climate advocacy. We might call that pseudo-scientific gaslighting,” he suggests.
Chris Morrison is the Daily Sceptic’sEnvironment Editor.
The New York Times is attempting to stoke climate alarm this week with an article claiming the world’s favorite scent – vanilla – is about to disappear because climate change is eradicating vanilla plants. In reality, objective data show vanilla production has doubled since the year 2000 and the current market is saturated with oversupply.
The New York Times is attempting to stoke climate alarm this week with an article claiming the world’s favorite scent – vanilla – is about to disappear because climate change is eradicating vanilla plants. In reality, objective data show vanilla production has doubled since the year 2000 and the current market is saturated with oversupply.
The Times article, “This Is How the World’s Favorite Scent Disappears,” notes vanilla is the world’s favorite scent and is used in a wide variety of perfumes and other products. Citing anecdotal events like a cyclone that hit Madagascar several years ago during its annual cyclone season, the Times claims supersized cyclones are putting vanilla on the verge of extinction.
Interestingly, although the Times published its article just yesterday, the best anecdotal “evidence” for the asserted vanilla extinction was a cyclone that his Madagascar way back in 2017 during its cyclone season. According to the Times, Madagascar produces 80 percent of the world’s vanilla – actually, it produces significantly less than 80 percent – and “As a result [of the 2017 cyclone], the price of vanilla bean pods surged to nearly $300 a pound. The increasingly erratic weather, along with pressure to cut the forests that harbor the orchids, is particularly worrisome for farmers….”
So, why does the Times provide just anecdotal ‘evidence’ of climate change ravaging vanilla crops, and why does the Times have to go all the way back to 2017 to find any such anecdotal evidence? The answer is because objective facts expose the Times’ claim as false.
The United Nations Food and Agriculture Organization provides detailed information on global crop production, including vanilla. According to the UN data, global vanilla production has doubled from 3.9 million kg of vanilla in 2000 to 7.7 million kg in 2022.
There is so much vanilla being produced that farmers are complaining about low vanilla prices caused by overproduction.
“The 2023 vanilla crop is expected to be one of the best harvests in the last two decades, forecasted at 2500 tons with exceptionally high quality,” observes the Nielsen-Massey 2023 Crop Report.
The Crop Report observes that recent strong production has created market oversupply. “The oversupply has led to aggressive price reductions, posing economic challenges for vanilla farmers as they sell their 2022 crop at low prices to meet their daily living needs,” the Crop Report adds.
Wow, talk about the New York Times getting the story completely backwards and wrong!
The New York Times points to a cyclone that hit Madagascar seven years ago during its cyclone season and caused a very short-term spike in vanilla prices. That is its sole “evidence” of climate change making vanilla go extinct. In reality, vanilla production is so strong that the market is saturated with vanilla, with such market saturation making farmers complain about low prices.
The New York Times and other “mainstream” media outlets have a long history of identifying popular foods, beverages, and luxury items that climate change is allegedly destroying. As is the case with all other such items that have come to Climate Realism’s attention, vanilla is becoming more abundant rather than less abundant as the planet modestly warms.
If you believe Bjorn Lomborg, we have record high coral cover and we can fix climate change. Both are nonsense propositions. In fact, this last year has been devastating for many reef ecosystems because of weather events that are part of natural climate cycles.
If you believe Bjorn Lomborg, we have record high coral cover and we can fix climate change. Both are nonsense propositions. In fact, this last year has been devastating for many reef ecosystems because of weather events that are part of natural climate cycles.
In the central Great Barrier Reef, we had the double whammy of coral bleaching and Tropical Cyclone Kirrily. Three reefs (Davis, Chicken and John Brewer) that were included in the recent AIMS’ Long-Term Monitoring Program surveys bore the brunt of Kirrily’s fury that hit as a severe category three before making landfall as a category one.
The basis of most Great Barrier Reef statistics is the survey. Get that wrong and add in an extraordinary amount of hubris – the type often found amongst academics who concern themselves with climate change – and we end-up with more lying headlines.
There are some major problems with the AIMS’ LTMP as a measure of total coral cover at the Great Barrier Reef:
It does not consider how the distribution and abundance of corals varies with different reef habitats,
It is a perimeter survey unlikely to include habitats with higher percentage coral cover,
In not surveying shallower reef habitats, including the reef crest, it cannot measure the true impacts of cyclones or bleaching.
Meanwhile, Peter Ridd has gone to some effort over the last few years to suggest that the health of the Great Barrier Reef can be reduced to a single number representing coral cover based on these LTMP perimeter surveys.
And his political interest is not actually in this number but in the trend.
The latest number for total coral cover at the Great Barrier Reef, as extracted and calculated first by Ridd, and following his lead by Lomborg, include recent surveys of three large reefs in the central regions of the Great Barrier Reef – Chicken, Davies and John Brewer.
Until TC Kirrily these were exceptionally beautiful reefs in warm crystal-clear waters, with the most magnificent corals – reaching their climax as ecosystems with more than 100 percent coral cover in some places.
I write more than 100 percent, because these reef crests can be of densely packed corals, competing for space and especially light; corals growing over each other with so many fishes – crowded, colourful and bustling like little metropolises on top of platforms rising from the sea floor.
Then these bustling metropolises were obliterated – by Tropical Cyclone Kirrily. And they came to look more like Gaza.
When I visited these reefs soon after that cyclone, I found that many of the very largest of the plate and branching corals had been picked-up, turned-over and dropped-off the edge of sections of these reefs that rise from the sea floor, sometimes as platforms. There was coral strewn about their perimeters.
Indeed, the entire wall of coral that featured in the short film I made last November about the ‘Café Latte Coral’ at John Brewer Reef that entire wall of coral has collapsed. It has broken off from the reef crest proper and has fallen seven meters to the perimeter.
As absurd as it might seem, only now is their opportunity for these broken corals to be part of the AIMS’ surveys used by Lomborg and Ridd to claim record cover coral at the Great Barrier Reef.
The LTMP data that these academics rely on is from surveys that are only ever of the perimeter and at a depth of between 6-9 meters – where so much broken coral landed after TC Kirrily.
A spot audit of NIWA’s 2023 flagship Annual Climate Summary report and some of its predecessors over the past five years has uncovered multiple major errors that cumulatively exaggerate the impact of climate change and drive public fear.
A spot audit of NIWA’s 2023 flagship Annual Climate Summary report and some of its predecessors over the past five years has uncovered multiple major errors that cumulatively exaggerate the impact of climate change and drive public fear.
Based on a detailed analysis of historic newspaper reports containing temperature, rainfall and other weather data and comparing them to NIWA’s published climate summaries, the audit has found
Claimed temperature records that were never real records
Claimed rainfall records that were never real records
NIWA published false information on New Zealand’s biggest historic cyclone, creating a false narrative that Cyclone Gabrielle was bigger and driven by climate change
Cherrypicked data is being used to exaggerate the apparent frequency of climate records being broken
The practice of reporting records by month is giving NIWA twelve times more opportunities to claim records in any given location, creating media and public confusion and a sense of relentless overwhelming climate change
NIWA is unaware of New Zealand’s highest temperatures
NIWA’s claim that only three days in our history have experienced temperatures higher than 40C is wrong: the real figure is nearly triple that
That there’s little evidence of climate change increasing extreme maximum temperatures in New Zealand, absolute records from a century ago are still intact
A year ago, the original Climate of Fear study on New Zealand historic storms found huge gaps in NIWA’s knowledge of our pre-industrial climate.
Now, nearly 11 months later, a new study finds NIWA continuing to ignore the past at a time when the rest of the world are rapidly expanding their climate change research to include weather data from digitised old newspapers.
NIWA’s continued reliance on its own limited climate records is a systemic research failure, resulting in false or misleading information being provided to government, clients, climate researchers and the public.
The NIWA reports in the spotlight are its annual climate summaries, published every year to provide a comprehensive breakdown of trends in New Zealand’s climate. The documents themselves use varying shades of orange and reddish brown to create the graphic impression of heat and climate urgency, but the data inside has huge holes.
The most obvious example of manipulation is the “records began” column. NIWA would have you believe that Rotorua has no temperature records earlier than 1972, or that Wellington, founded in 1839, has no records before 1931. Although Queenstown records began in 1871, the 1860s goldmining towns Alexandra and Clyde have no temperature records earlier than 1992 and 1978 respectively. Whangarei has no temperatures before 1967, but its rainfall records date back to 1943. Why the difference? Who knows. Town after town, most of their records since settlement are not in the database.
Confused? You should be. NIWA’s climate records are like swiss cheese, continually compromised by decades – even a century – of missing data. With a budget of more than $160 million a year, you’d expect to be seeing more bang for the taxpayer buck.
Against that background, this audit shows NIWA has made almost zero effort in its 32 years of existence to backfill the missing data from other historical documents. That systemic failure has allowed this report to wipe the floor with NIWA, just as the storm report did last year.
NIWA doesn’t know what it doesn’t know. But you are about to find out just how bad their climate research database is.
TOO HOT TO HANDLE: MAIN ARTICLE
“The year was remarkable for the frequency of floods in the Auckland and, especially, the Hawke’s Bay provinces. In the latter they were very severe, and the damage was of disastrous proportions.”
That quote might describe our weather in 2023, but you may be surprised to learn that it came from the 1938 Met Service report to parliament.
Eighty-five years later, lessons from history loom large as major new errors and omissions have emerged in NIWA’s 2023 Climate Summary report, just days after its release, making it the second flawed report in as many years.
The government’s self-proclaimed leading climate research agency, which burns through about $160 million in revenue and funding each year, continues to produce research summaries that – because the errors are systemic, not accidental – its clients like local council planners can’t trust as they’re little better than fiction.
The systemic problem at the heart of NIWA research failings is that the agency has made little to no effort, in three decades of existence, to fill massive gaps in its databases. This leaves NIWA flying blind, not knowing what it doesn’t know.
What it doesn’t know is serious.
CYCLONES: FALSE INFORMATION PUBLISHED BY NIWA
Take Ex-Cyclone Gabrielle. The Niwa Summary says:
“On 12 February, Gabrielle began impacting Northland and Auckland. In central Auckland, the air pressure fell to 971.5 hPa, surpassing that which was observed during the Cyclone of 1936 (973.5 hPa). On 14 February, Gabrielle’s centre of circulation drifted eastward toward East Cape, passing just kilometres offshore during the evening. A MetService analysis indicated a central pressure of 965 hPa. Gabrielle then moved away from the mainland.”
As identified in the original Climate of Fear report last year, NIWA research is incredibly weak on historical storms. The reference to the 1936 Cyclone by NIWA is simply wrong – they don’t have the data.
“The recovery of meteorological data from old documentary sources is of great significance for meteorological and weather research”– Royal Met. Society UK
Thankfully, old newspaper records do, and climate scientists in Australia, the USA and Europe are furiously cross-checking their traditional databases against what they now regard as “the treasure trove” of newly digitised old newspapers.
“Historical records from the 18th and 19th centuries provide a detailed picture of Australia’s pre-industrial climate before instrumental observations become influenced by global warming. This provides a unique opportunity to examine weather extremes produced purely by natural variability for comparison with recently observed variability and extremes,” writes Aussie climate scientist Joelle Gergis.
Gergis and her team are using crowdsourced volunteers on “citizen science platform Zooniverse” to scan through thousands of old reports recovering historic weather data.
“Once complete, these records will be continuous sub-daily datasets, providing a treasure trove for the study of Southern Hemisphere climate variability and extremes. Importantly, they will fill crucial data gaps in global datasets, improving the reliability of historical climate analysis.”
In Britain, the Royal Meteorological Society is crowing about recovering vital climate data from 5000 Spanish newspaper articles.
“The recovery of meteorological data from old documentary sources is of great significance for meteorological and weather research. We describe our recovery of a meteorological series from the late nineteenth and early twentieth century from the pioneering A Guarda Observatory in Galicia (Spain). Data series were obtained from meteorological notes appearing in the newspaper La Integridad as published at the time. In total, we recovered data from over 5000 newspapers using more than 60 000 individual measurements.”
A group of UK scientists have even been using New Zealand’s old newspapers to research historic floods.
Even NIWA has been known to crow when it has discovered information, not in its database, from old newspapers – such as finding out New Zealand’s coldest temperature was -25.6C at Ranfurly in 1903:
“I was quite excited to find the record. It’s like detective work,” NIWA climate scientist Georgina Griffiths remarked in 2017.
Quite.
Interestingly, the agency verified the newspaper record by comparing it to other historic news reports and data to check for consistency. The NIWA article doesn’t mention it but they almost certainly stumbled on this report from the Central Otago town of Gladbrook, which reached a low of -25C on the same day. That’s how corroboration works.
Thus, NIWA, set up in 1992, only discovered in 2017 New Zealand’s coldest recorded temperature, from an old newspaper not their master database.
So, now that you know why trawling through old newspapers is valid climate science, let’s find out how NIWA’s 2023 report claiming Gabrielle was bigger than the 1936 Cyclone is wrong, and how these systematic errors are wasting taxpayer money, possibly endangering lives and property through their flawed analysis, and making NIWA a laughing stock.
Storm research 101: the lower the hPa number, the lower the atmospheric pressure in the eye of the storm and therefore the stronger and faster the winds will be (racing in to fill the vacuum) and the higher the storm surge – king tides caused because of the lower air pressure allowing the sea level to rapidly rise. In plain English, high pressure systems essentially weigh more heavily on the ocean, forcing the sea level down, while low pressure storms are lighter, and the sea rises accordingly.
It’s the storm surge that causes the ocean to rise high enough to flood roads and wash away buildings and cars.
NIWA says Gabrielle was 965 hPa. A century ago they measured barometric pressure in inches of mercury, and 965 hPa is equivalent to 28.5 inches of mercury.
NIWA also says the 1936 Cyclone was only 973.5 hPa (28.75 inches), not as low and therefore not as powerful as Gabrielle.
They are wrong. Three barometers near the tip of the North Island recorded what appears to be the deepest cyclonic low measured in NZ. One, at Cape Maria van Diemen, dropped to 28.5 inches of mercury (965 hPa), identical to Gabrielle’s deepest low. The second unit, a calibrated device at Kaitaia, went even lower to 28.00 inches of mercury (948.2 hPa) as the cyclone passed overhead.
The third device, at Doubtless Bay and just six metres above sea level, plunged to 27.91 inches of mercury (945 hPa), the deepest low known in NZ.
The 1936 storm, like Gabrielle, devastated the North Island and had our modern infrastructure been in the firing line back then the damage may well have been more extensive than Gabrielle. But that’s not the point of this story – the take home message is that NIWA doesn’t know that 1936 was far more powerful than Gabrielle. It simply doesn’t have the data and its failure to factcheck against publicly available records is embarrassing.
The 1936 news reports even join the dots to show how lazy NIWA’s research was, noting that the 973 hPa low that Cyclone 36 reached in Auckland probably wasn’t the full story:
“The pressure at Auckland yesterday morning was 28.76 inches (973.9 hPa), and at the centre it must have been lower.”
As you’ve now seen, it was much lower, 945 hPa. If it was obvious to news reporters in the 1930s that there was a deeper low to be found, it should have been far more obvious to 21st century climate scientists. If NIWA scientists had bothered to read the historical reports they would have found that caveat and discovered the far north readings. But they didn’t.
Instead, their flagship report, the 2023 Annual Climate Summary, contains major errors that could have been avoided.
Adding insult to injury, NIWA in 2023 had weather satellites and a vast network of automated sensors, so it had the advantage of being able to track and measure Gabrielle every second. Last century, that technology didn’t exist. It’s possible a satellite or remote electronic weather station back in 1936 would have found an even deeper low. It’s just blind luck that three barometers in far north homes were able to measure and corroborate.
RAINFALL RECORDS THAT DON’T REALLY EXIST
Then there’s rainfall extremes. In February 1936, Whangarei was swamped.
“The rainfall at Whangarei for the 24 hours ending at 9 o’clock this morning was 11.41 inches (290mm),” reported the Press Association, the morning after Cyclone 36 had swept through.
“Whangarei recorded 11.41 in (29.0 cm) of rain in 24 hours (Return Period over 150 years).”
So, knowing that, why on earth did NIWA sign off on its 2023 Annual Climate Summary Report containing the false statement: “Whāngarei recorded 216 mm between 9:00 am 12 February – 9:00 a.m. 13 February, its wettest February day on record.”
Really? Is 216mm in 2023 a bigger deluge than 290mm in February 1936? Does NIWA have no Year 3 maths graduates on staff?
“Claimed record after claimed record, there’s evidence that NIWA’s cherrypicked data is being used (and coloured in dark red for the most extreme bits) to bolster the narrative that extreme climate records are being broken more frequently now”-Ian Wishart
The reason for this incredible own goal from New Zealand’s premiere climate research agency can be sheeted home to hubris. Despite admitting the HWE data is verified before uploading, NIWA says it doesn’t use it, preferring to rely on its other database, CliFlo:
“The website Ian Wishart has based his opinions on is not New Zealand’s national climate database,” the agency said, sniffily, in a statement published after the Climate of Fear report.
“Wishart has conflated the Historic Weather Events website with the New Zealand National Climate Database [CliFlo] that is used by NIWA and climate scientists nationally and internationally to analyse weather events and trends in the climate. NIWA’s New Zealand National Climate Database includes official observations back to the 1850s, including some descriptions of significant weather events of the time.
“The Historic Weather Events website that Wishart has based his study on is a catalogue that was created to collate descriptive details on impacts and hazards from weather events. It is not an official type of meteorological record. It has gaps because it contains information gathered from newspaper articles, journals, books and reports that periodically come to light. Gathering these sources and validating them takes significant time and is an ongoing process.”
The take-home from the arrogant news release is, ‘trust us, we know what we’re doing, our real database has all the official data covered’.
Yet clearly it doesn’t. If CliFlo was fit for purpose Cyclone 36 would correctly be listed as a 945 hPa record-breaking storm, not 973 hPa, and NIWA would not have published the claim – contradicted by its own secondary database – that Whangarei suffered its wettest day ever during Cyclone Gabrielle with a 216mm rainfall, when the real record was 290mm in 1936.
But that’s not the worst of it by a longshot. Claimed record after claimed record, there’s evidence that NIWA’s cherrypicked data is being used (and coloured in dark red for the most extreme bits) to bolster the narrative that extreme climate records are being broken more frequently now.
Akaroa, on Banks Peninsula, is listed in 2023 as having its highest 24 hour rainfall – 199mm or 7.8 inches – since records began in 1977. That may be true, but there are records of a 212mm (8.36 inches) downpour in 1941. NIWA’s records are incomplete.
If you didn’t know the real historic record, you’d come away from reading the NIWA Summary convinced that we are getting record rainfall because climate change has turbocharged it beyond anything that happened before. Instead, the truth is that Akaroa didn’t break the 1941 record.
Waipawa, in the North Island, is claimed to have suffered its most extreme 24 hour rainfall since records began in 1945, with a 117mm (4.6 inch) sluicing during Cyclone Gabrielle. Again, the implication from these lists is that the modern climate is more extreme. Yet, earlier records, evidently lost to NIWA, show downpours of 148mm (5.83 inches).
The 2023 Summary says Gabrielle also delivered record rainfall to the Chateau station on Mt Ruapehu, with 154mm (6.06 inches) in 24 hours. However historical records that NIWA clearly doesn’t have, show a 7.5 inch (191mm) washout over just five hours in March 1933. The storm washed out bridges, derailed an overnight passenger train in an eerie foreshadowing of Tangiwai two decades later, caused a plane crash and widespread flooding.
NIWA says the Anniversary Day floods last year delivered Auckland’s biggest ever rainfall since “records began” as early as 1853, with a peak of 265mm (10.4 inches) in 24 hours at Mangere. In April 1924, though, a storm lashed the Auckland region delivering a peak intensity of 356mm (14 inches) over the north of the city in only five hours!
Although the event is listed in the NIWA Historical database, the agency does not mention the massive rainfall tallies recorded in two locations, the second being an unofficial reading of 15 inches near Silverdale, but clearly corroborating the first gauge. The distance between both gauges was 30 km, meaning the catchment was larger than most of urban Auckland (Mangere is 17km south of the CBD, Albany is 22km north). If all of Auckland had been hit with that much water on Anniversary Day it would have been devastating.
MYSTERIOUS SUDDEN DISCOVERY OF RECORD GABRIELLE RAINFALL
The number one rainfall record in the latest Climate Summary naturally goes to Cyclone Gabrielle, but the circumstances are mysterious.
NIWA reported in a major analysis of Gabrielle last year, after checking all its data, including a 565mm fall at the Glengarry station near the Esk River which turned out to be over two days, that: “The highest 1-day rainfall was 316 mm, recorded at Tūtira (Hawke’s Bay) on 13 February.”
This was NIWA’s official position in every public report in 2023 including the February Monthly Climate Summary and the Summer Seasonal Summary. It was still the official position in a Hawke’s Bay Regional Council Report at the end of October.
Yet, when the nation’s highly trained climate change reporters opened their advance copies of NIWA’s 2023 Climate Summary in early January 2024, they were greeted with a hitherto unseen claim:
“The top three daily rainfall totals from regularly reporting gauges in 2023 excluding high elevation stations were: 561 mm at Tareha (near the Esk River in Hawke’s Bay) on 13 February, 336 mm at Whakamārama (near Tauranga) on 17 June, and 316 mm at Tūtira (Hurford Rd) on 13 February.”
Yes, you picked it where dozens of highly trained climate journo’s didn’t even bat an eyelid: how did the one-day record of 316mm at Tūtira suddenly morph into 561mm at Tareha?
There’s a big difference between those two figures with no explanation how NIWA has magicked up the extra rain data, but you can bet 561mm/24hrs will now be the money quote future climate research on Gabrielle is anchored to.
“NIWA have some explaining to do. As indicated, no mainstream media climate reporters have picked up the discrepancy, it’s just been blindly accepted like a daily dose of Mogadon, and repeated. We are literally seeing history being rewritten.”-Ian Wishart
The 2023 Climate Summary, incidentally, released 11 January 2024, is the first time NIWA has ever mentioned Tareha in connection with Cyclone Gabrielle. Make of that what you will. It didn’t appear in the updated cyclone data from late-reporting field stations released in March last year. Curiously, although it tops the list of 2023 extreme rainfalls of the year, Tareha’s 561mm is nowhere to be found in the top ten rainfalls of the month, February. Instead, top spot goes to Tutira with its 316mm.
A cynic would say NIWA threw in Tareha at the last minute based on questionable data (eg, did they erroneously code total Gabrielle rainfall over two days, as just a one day fall?), so NIWA have some explaining to do. As indicated, no mainstream media climate reporters have picked up the discrepancy, it’s just been blindly accepted like a daily dose of Mogadon, and repeated. We are literally seeing history being rewritten.
Regardless, even in the unlikely event that the mystery Tareha reading is real, a century ago in March 1924, another storm drowned Hawkes Bay with 512mm (20.14 inches) of rain – not in 24 hours, but within only ten hours! That’s almost the same deluge as Gabrielle, but in less than half the time.
Embarrassingly for NIWA, just like the old Whangarei rain record that turned out to be hiding in plain sight on HWE, the ‘bridesmaid’ database NIWA boasts it doesn’t use, the 1924 genuine rain record is there as well.
NIWA, of course, should know all this. The fact that they don’t is a scandal in my view, and can be directly blamed on their failure to crosscheck raw data points in their CliFlo database against actual historical reports or, in fact, their own website.
MISLEADING
The 2023 Summary, relied on by the news media and climate researchers, is arguably misleading in other ways, such as the omission of key facts necessary for context.
Example? It implies the Auckland Anniversary floods delivered the most extreme rainfall ever recorded at Whenuapai.
I say “implies” because there’s a list of extreme rainfall records by month, and Whenuapai, which NIWA boasts has official records dating back to 1943, suffered a 190mm drowning (7.5 inches of rain) on 27 January 2023, the “highest” one-day event.
Ordinary readers will assume that is an overall record-breaker that happened in January, because there’s no context. The impression of how important that 190mm record is, would have been different if NIWA had also published the actual all-time record alongside, the details come from this newspaper report from 1966:
“At Whenuapai, 10.23 inches of rain (260mm) was recorded for the 24 hours up to 9 am yesterday. The previous record in the area was 3.75 inches. Between 9pm and 11:00 p.m. on Wednesday 5 inches fell at Whenuapai.
“The weather office at Whenuapai was not equipped to handle the deluge as its gauge stops measuring at 9 inches. To measure rainfall up to this morning staff dug up the protecting canister for the gauge, tested it for leakage, found there was none and poured the 1.23 inches overflow into the measuring cylinder.”
The report is gobsmacking, and clearly puts the Anniversary Day downpour in the context of scale. When compared to the rest of the 2023 Auckland Anniversary rain records, this 260mm 1966 event eclipses all but one of the gauges (Mangere on 265mm) which proves that Auckland does get tropical downpours naturally.
NIWA’s failure to include relevant facts is glaring, especially as their own disused Historical database confirms the event:
“Whenuapai recorded 260 mm (26.0 cm) of rain in 24 hours (Return Period over 150 years). Whenuapai recorded 107 mm (10.7 cm) of rain in one hour (Return Period well over 150 years). The one-hour downpour broke a 35-year record.”
If you’ve got visions of Star Trek: Next Generation Captain Jean-Luc Picard facepalming right now, you’re not alone.
Essentially, NIWA appears to be grooming the media with meaningless out-of-context ‘geek stats’, like the hottest temperature on a given date, in the hope that something sticks.
Even worse, the exercise of breaking down your extremes by month, week or day is even more meaningless when you aren’t including historic extremes to show the true long term trend.
Weather is chaotic, big storms even more so. There’s enough variance in each storm for us to know that it’s mostly blind chance whether the biggest deluge is over Silverdale, Whenuapai, Auckland CBD or somewhere out to sea. The same exercise can be applied to any other region. Sure, weather systems follow rough trajectories, but knowing precisely where they are going to hit hardest – that’s beyond our power to control, making NIWA’s excitement about rain or temperature records at individual sites within a defined region largely artificial. Last year Mangere scored the highest rainfall in Auckland. A century ago it was Helensville through to Silverdale. Unless there are major topographical features creating distinct microclimates capable of holding their own against a cyclone, there’s usually nothing in the difference, it’s random luck for the most part not a predictable pattern.
What matters is not the difference between Mangere and Whenuapai, for the purposes of proclaiming a record. What we should be looking at is the size of the storm system in the region and how much rain it was able to dump within the region.
TEMPERATURE RECORDS THAT WERE NEVER REAL
More dodgy claims emerge in the section on record temperatures. Greymouth, for example, is singled out for special mention in the new report:
“A particularly notable event occurred during early January, when Greymouth registered a temperature of over 30°C, the first time this has happened since records began in 1947.”
Let’s look at that “records began” phrase. The overarching impression is that we’ve never seen Greymouth this hot – it must be proof of climate change.
Believe it or not, those ornery old timers who actually invented thermometers, barometers and navigation equipment and figured out how to travel 18,000km to get here in leaky sailboats, actually knew how to use the equipment.
Even more inconveniently, in 1967, 20 years after NIWA says records began, a government thermometer in a Stevenson screen outside the government radio station in Greymouth notched up 30.6C (87F) on January 15.
Now, before anyone squawks about different sites possibly being involved, NIWA itself has been happy to claim hottest days from different sites (more on this later) when it suits.
Meteorologists had been aware since the 1860s of the need to screen thermometers from direct sunlight or reflected heat. Rainfall, barometer, wind and temperature data was collected by port authorities for fairly obvious reasons. The lives of mariners depended on accurate data. By 1911 Greymouth had an official meteorologist.
Unfortunately many west coast old weather records were washed away in floods so they don’t “officially” exist anymore. Unless of course you add them back in from the daily newspaper weather columns, which NIWA have never done.
Give a couple of interns endless coffee and donuts for a month and the gaps could easily be filled and a more realistic picture of climate trends would emerge.
But it’s not just Greymouth.
NIWA lists Westport Airport reaching a record high of 29.1C (84.4F) for the first time since “records began” in 1937.
Which is all well and good, except that in 1967 Westport reported a 30.6C (87F) temperature.
Only four towns had record maximum temperatures in NIWA’s 2023 Annual Climate Summary, and of those four you’ve just seen two of the record temperatures debunked – half of them are wrong.
But let’s take an even deeper dive into the integrity of NIWA’s CliFlo temperature records.
SEVEN STATION SERIES
The donkey work of NIWA’s temperature record trend is done by a network of seven locations with continuous data records dating back more than 110 years. If there are discrepancies in the Seven Station Series, that has implications for the integrity of NZ climate research, as it feeds into peer-reviewed studies published around the world.
One of the core seven stations is Masterton.
On its website, NIWA confirms “these locations were chosen because they provide broad geographical coverage and long records (with measurements started at all sites by 1908).”
Yet on 2 February 2013, the Herald reported on Masterton setting a new record:
“The official high recorded in Masterton on Thursday of 33.3C [91.9F] was the highest recorded by NIWA in the past 20 years – as long as records exist.
“A NIWA spokeswoman said yesterday that Masterton’s temperature was the highest recorded since records started being collated in 1992.”
You may be thinking, “1992? What happened to all the records since 1908?”. Great question. Let’s look at some of the inconvenient facts that would have torpedoed the Masterton heat record good story, if NIWA’s database had thrown them up. It may be a material fact that NIWA just happened to also have been established in 1992.
Was 33.3C in 2013 a record for Masterton? Not even close.
There may be higher temperatures listed in old newspapers, but only the Christchurch Press has digitised issues after 1950 and they don’t cover Masterton so for now the temperature data after 1950 is scarce.
In January 2009, the Herald reported a new NIWA record at Masterton of 34.6C (94.3F). Note the date: it is four years before the supposed record of 33.3C, but it’s higher!
How can the media run a story about a record temperature in 2013 that is 1.3C lower than the “new record” set in 2009 and reported by exactly the same newspaper?
It turns out NIWA is releasing random city temperature readings from different sites, all called Masterton.
If different sites are all fair game to hang a climate change record story on, it raises questions about whether the Masterton temps are cherrypicked depending on whichever site is highest on a given day. It’s not like the media are ringing NIWA asking for the different temps at each site, they’re simply asking how hot was it in Masterton today? It appears NIWA is not restraining itself to one site but picking whichever suburb is hottest to answer the question.
The city reached its current record of 35.4C in January 2018, during what NIWA was calling NZ’s “hottest summer”. As you can see, it’s a ‘massive’ 0.3C higher than the 1930 record. But here’s the kicker: when NIWA was telling the Herald in 2013 about the new 33.3C “record” being the highest since records began in 1992, it knew it was lying to the paper. Buried in a NIWA file dated 13 years earlier in 2000 is a reference to Masterton’s all time high of 35.2C, presumably either an adjusted 1930 reference or a similar warm day at some time over the following 70 years.
The media, it seems, are being played like a Stradivarius. It wouldn’t surprise me if CCTV footage eventually surfaces of NIWA climate scientists jumping on desks and high-fiving each other – Wolf of Wall Street-style – every time a media outlet falls for a fake climate record!
NIWA’s 2018 report claims Lumsden set a new record of 32.3C (90.1F). History shows Lumsden with the same temperature in 1934. Net climate gain = 0.
In the same document, Cromwell is listed reaching an all time record of 36.6C. However the real record is 37.8C (100F) set in 1937.
All-time records don’t fall every year so we have to go back to NIWA’s 2019 Climate Summary to expose another Seven Station city, Wellington. In 2019, NIWA trumpeted a Wellington temperature of 30.3C (86.5F) as the highest since records began at Kelburn in 1927. Proof of global warming. What the article didn’t say is that Wellington’s all time highest temperature was 31.1C (88F) in 1896. And NIWA knows it, as you can see from the Masterton image above.
In that same 2019 Summary, NIWA trumpeted an all-time record high for Rotorua of 32.2C (90F). The only problem with that? Rotorua’s all-time record is actually 98F (36.7C). Yet another example of NIWA not doing its homework.
A temperature of 35.5C at Akaroa is listed as “equal highest”. This is wrong, records show a 36.7C temperature there in 1938.
In its 2019 Summary, NIWA claims that Hamilton had set a new record of 32C, when the actual all time record is 35C, set in 1935, creating the false impression that climate change is creating maximum temperature records. Again, the same NIWA document from 2000 that lists Masterton also notes a record of 34.7C at Hamilton – lower than the 35C we found but still ahead of the “record” they were trying to claim 19 years later.
In 2021, NIWA’s Annual Report said Ashburton had reached a record high of 39.4C, but the town hit 41.3C during the 1973 heatwave.
As an example of the kind of confusion these false record claims are causing in the media, and therefore the public, consider Invercargill.
In 2018, RNZ reported “Invercargill has hottest day on record at 32.3C”. Newshub earnestly told its viewers “Invercargill’s previous hottest recorded temperature was taken in 1921, when the city reached a high of 32.2degC.”
Is that accurate? No.
In 1894, historic news reports show Invercargill set a record with two consecutive days above 33.3C (92F).
That inconvenient truth was obviously unknown to NZ’s premiere climate research agency, as NIWA told the world in 2018 that Invercargill had never gone above 30C for “consecutive days”:
“From 14-16 January [2018], Invercargill recorded three consecutive days above 30°C, which is unprecedented in records going back to 1905. The city had never previously recorded consecutive days above 30°C. On 14 January, the city observed a maximum temperature of 32.3°C; its second-highest temperature on record for any month (the highest temperature recorded was 33.8°C on 2 January 1948).”
NIWA was wrong on the consecutive days, and because it didn’t know about that nor did it know the 1894 temps of 33.3C were actually “the second highest…on record”.
But just when you think you’ve sorted out the confusing media reports, along comes the Otago Daily Times on February 6 last year:
“Invercargill came agonisingly close to breaking a 24-year-old record when it reached 32.0 degC at 4pm on Saturday.”
Wait, what?! I thought we’d established that it hit 32.3C in 2018 and that the real record is 33.8C set in 1948?
“The February record stands at 32.1degC, set in 1999.”
Ah, the ODT was being fed monthly “records” by, in this case, MetService.
This constant bombardment of the public, via a compliant news media, with an endless confusing stream of monthly “geek records” is a sophisticated psy-op that again creates the false impression that real records are being broken when they’re not.
NIWA VS JOURNALIST: WHO’S RIGHT ON 40C DAYS?
In late December 2023, NIWA’s Ben Noll gave an interview to Stuff, where the news company say he told them:
Only three days have hit at least 40C in New Zealand, said Noll and two of those were recorded in the South Canterbury town of Timaru. “Timaru is home to two of the three hottest days overall on record, so definitely a claim to fame.”
This is where the rubber hits the melting bitumen for NIWA. Noll has all the power and resource of a $160 million government agency. He can put agents in suits, sunglasses and black electric SUVs with tinted windows anywhere in the country. I’ve just got a laptop and time to burn.
So is NIWA’s vast computer database correct? Has NZ really only experienced 40C temperatures on three days? Or is the journalist right? Let’s find out.
Eight days at 40C or higher. Not three. The power of comprehensive historical records over a badly designed NIWA database with decades of data holes, brutally demonstrated.
MANIPULATED CLIMATE RECORDS
Let’s examine those data holes a little more carefully. Whenever they come under fire, NIWA hides behind its “records began” caveat, the column alongside every data record that shows when the site data dates back to. “See that?” they say, “we’re not misleading anyone. It clearly says those records began in 1992.”
Yeah, but. The town in question was founded in 1860, what happened to all the previous records?
“A goat ate them”.
That last line is not a real answer of course, but it’s a good representation.
When towns first began springing up, collecting weather data fell to the local harbourmaster if it was coastal, or the local scientist/headmaster/reverend/old sea captain if there was no significant local authority. In rural areas, big sheep and cattle stations operated weather stations because they needed to run their stock logistics ahead of storms/heatwaves and so on.
Reports from this network of independent weather stations were initially supplied to local newspapers and then, after the country’s first Director of Meteorological Stations was appointed in 1861 they gradually ended up being coordinated.
Bureaucracies being what they are some of the records were lost or damaged over time. Many have now been digitised and form the backbone of NIWA’s CliFlo database, but even a cursory look at some of the Annual Climate Summaries will quickly show that there are gaps where you wouldn’t expect them.
There appear to be two possible explanations. 1) They have the data but it’s from no longer used sites so it’s been jettisoned from the records. This would enable NIWA to pass off more recent warming from the current site as a cascade of new records, without needing to bother the peasantry by revealing that the real record for Ohakune, for example, was five degrees higher than the current “record”. 2) The records are missing.
I suspect it’s a combination of both factors. Laziness and goats. NIWA admits “stations are missing (e.g. Masteron (sic) prior to 1906)”, so it’s clear backfill from newspapers is necessary in some cases.
When there’s a break in continuity at a weather station – say it’s moved to a different site – temperatures may need an adjustment factored in. The best example is Wellington where the site in Thorndon closed at the end of 1927 and reopened in Kelburn, higher up the mountain in a cooler spot. The old and new sites ran in parallel for a month and scientists discovered a 0.8C adjustment needed to be subtracted from old temperatures when comparing them to the colder new ones. The modern Wellington temperatures have that adjustment already built in, so they can be directly compared to older temperatures.
The hassle of working out offsets across the whole country is too much for NIWA so it found a core group of seven stations, adjusted those and now relies almost exclusively on that to measure long term temperature change.
But NIWA wants to both have its cake and eat it. The public want to know about weather trends in their own towns. The agency wants to issue as many press releases as possible on “new records”, and there are far more than seven towns in NZ. So the solution appears to have been use the most recent site data from every town outside the seven series and pretend the old records never happened.
This has the effect of creating a fireworks pattern of false random records announcements that can only be untangled the way we are doing it here (and which the mainstream media will never do as they are part of the problem) – by zooming out to get a big picture overview of the records timeline. That’s when the propaganda tricks become obvious.
CAUGHT IN THE ACT: NIWA DECEPTIVE CONDUCT
It’s not until you scrutinise some of these NIWA reports in depth that discrepancies become obvious. Consumers of NIWA’s data, like ordinary members of the public, would expect a consistency of measuring sites when records are being claimed. “Whangārei”, for example, should mean choosing and using “the” official site, not “any” official site.
After all, that’s what NIWA warns the media:
“Journalists are advised, however, to take extreme care when interpreting trends from raw data to ensure they have not been compromised by changes in site location, urbanisation, exposure, or instrumentation over time. If in any doubt, please call us.”
The irony, that when media call NIWA they are being fed information “compromised by changes in site location”, is stark.
Take Whangarei. One NIWA record says rainfall records only began in 1937, while another says 1943. Which is it?
Or take Wellington. Did temperature records begin in 1931 or 1928?
If NIWA were selling this data to ordinary consumers they’d be hauled before the Commerce Commission for making misleading statements in trade, in my opinion.
THE WRAP-UP:
So what does all this really mean? In my view NIWA is stacking its Annual Climate Summaries with misleading “records” to drive a climate change narrative and essentially justify its existence. While there’s a need for climate research, there’s no public interest in a government agency manipulating and exaggerating data.
In my view NIWA has:
Published false data on the size and power of Cyclone Gabrielle relative to the 1936 Cyclone it compared it to – specifically that NIWA seriously undercalculated the 1936 storm, creating a false impression that modern storms are bigger because of climate change
Published false information claiming that Gabrielle delivered Whangarei’s “wettest” February day with a “record” 216mm deluge, when it knew Whangarei’s February record was 290mm during, ironically, Cyclone 36, creating a false impression that modern storms are bigger because of climate change
Published misleading statements about Auckland Anniversary Day rainfall breaking records, with up to 265mm downfall in 24 hours in one part of the city, without disclosing that 356mm drowned the north of the city over just five hours in a 1924 storm, creating a false impression that modern storms are bigger because of climate change
Published misleading statements about “record” 199mm rainfall at Akaroa when the actual record from 1941 is 212mm, creating a false impression that modern storms are bigger because of climate change
Published misleading statements about record 117mm rainfall at Waipawa when the actual record from 1911 is 148mm, creating a false impression that modern storms are bigger because of climate change
Published misleading statements about “record” 154mm rainfall at The Chateau, Mt Ruapehu when the actual record from 1933 is 191mm that derailed a passenger express train, creating a false impression that modern storms are bigger because of climate change
Mysteriously increased the maximum extreme 24 hour rainfall in Hawke’s Bay from Cyclone Gabrielle to 561mm, from the 316mm total used by NIWA in all previous official reports on Gabrielle, without explanation, while also failing to mention the existing record of 512mm in ten hours from 1924, which NIWA knew
Published misleading statements that Greymouth topped 30C for the first time in 2023, when in fact it reached 31.7C in 1918 and was measured at 30.6C in 1967 on a state-approved thermometer at the government’s Broadcasting House
Published misleading statements that Westport reached 29.1C for the first time since 1937 when Westport reported 30.6C in 1967 as well
Published, in its 2019 Annual Climate Summary, misleading statements that Rotorua had reached 32.2C for the first time, when the actual temperature record of 36.7C was set in 1935, creating the false impression that climate change is creating maximum temperature records
Published, in its 2019 Summary, misleading statements that Hamilton had set a new record of 32C, when the actual all time record is 35C, set in 1935, creating the false impression that climate change is creating maximum temperature records
Published, in its 2019 Summary, misleading statements that Ohakune had set a new record of 31.1C when the actual record from 1924 is 36.7C, creating the false impression that climate change is causing new maximum temperature records
Published, in its 2019 Summary, misleading statements that Wellington had set a new record of 30.3C, when it knew Wellington’s all-time record is 31.7C dating back to 1896
In a 2024 interview with Stuff, NIWA falsely claimed only three days in New Zealand have ever seen temperatures of 40C or higher. In fact historical records disclose nearly triple that figure, with at least eight days reaching those heights
Falsely claimed New Zealand’s highest ever temperature was 42.4C at Rangiora in 1973, when two major South Island sheep stations recorded higher temperatures of 42.8 and 44.4C separately, on the same day in 1949
The public need to be able to trust NIWA. In my view publishing claimed records that imply a historical trend when, for whatever reason, relevant datapoints that might challenge that impression are being left out, is dishonest science. It is simply not good enough for a research agency to hide behind a technical literal truth – “it’s the highest since records began in 1978” – when in many cases the agency knows of verified higher records in the past. It is lying by omission in my view.
The government should compel NIWA to add columns to its record graphs for All-time Verified Record, and Unofficial Claimed Record, with the dates included as well, to provide meaningful context to the media, clients and the public.
NIWA should also be compelled to specify when it is using different sites within a region to report records, so that debacles like Masterton reporting no longer happen.
As for the news media, their predecessors a century ago had no computers to keep track of temperature records, so they could be forgiven for wrongly claiming something was a new record. Modern media have no such excuse. It’s one thing to be played by climate scientists, but it’s a total credibility fail if your internal systems can’t instantly pull up all previous stories on temperature records to factcheck.
The last government began a review of NIWA and MetService. On the strength of this report and last year’s Climate of Fear, it seems pretty clear the new government needs to deepen the investigation.
Ian Wishart is a bestselling author and journalist, currently a consultant to the Centrist in its establishment of a new investigative unit to help us bring more in-depth coverage of issues that matter to our readers. He is slowly (but carefully) writing a new climate book.


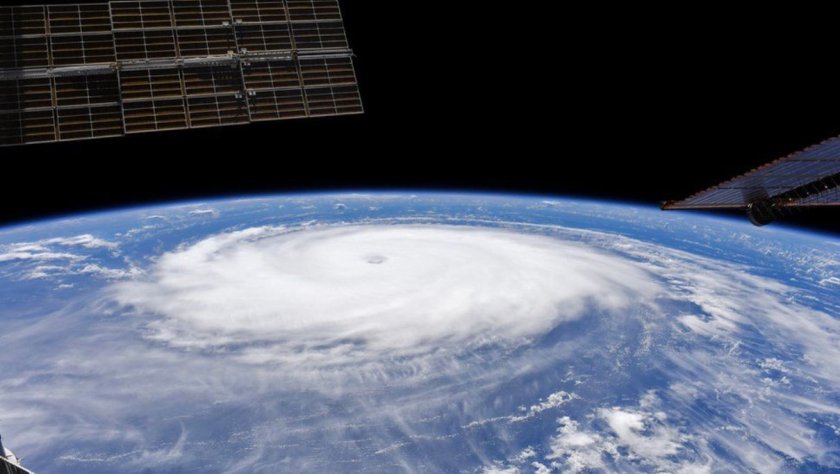


You must be logged in to post a comment.