Global warming, climate change, all these things are just a dream come true for politicians. I deal with evidence and not with frightening computer models because the seeker after truth does not put his faith in any consensus. The road to the truth is long and hard, but this is the road we must follow. People who describe the unprecedented comfort and ease of modern life as a climate disaster, in my opinion have no idea what a real problem is.
Last month a small but powerful cyclone named Chido made landfall in Mayotte before sweeping into Mozambique, causing considerable damage and leading to the loss of around 100 lives. Days after the tragedy, the Green Blob-funded Carbon Brief noted that scientists have “long suggested” that climate change is making cyclones worse in the region, while Blob-funded World Weather Attribution (WWA) at Imperial College London made a near-instant and curiously precise estimate that a Chido-like cyclone was about 40% more likely to happen in 2024 than during the pre-industrial age.
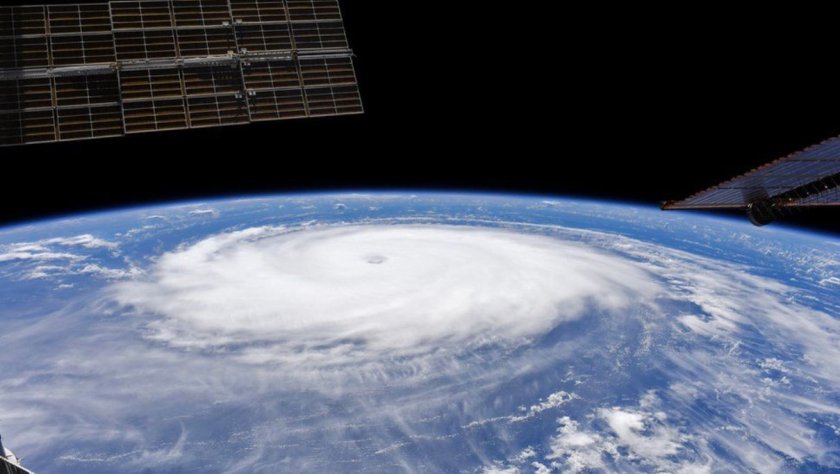
Last month a small but powerful cyclone named Chido made landfall in Mayotte before sweeping into Mozambique, causing considerable damage and leading to the loss of around 100 lives. Days after the tragedy, the Green Blob-funded Carbon Brief noted that scientists have “long suggested” that climate change is making cyclones worse in the region, while Blob-funded World Weather Attribution (WWA) at Imperial College London made a near-instant and curiously precise estimate that a Chido-like cyclone was about 40% more likely to happen in 2024 than during the pre-industrial age. Not to be outdone, Green Blob-funded cheerleader the Guardian chipped in with the obligatory “cyclones are getting worse because of the climate emergency”. Almost unnoticed, it seems, among all the Net Zero dooming and grooming was a science paper published during December by Nature that found no increase in the destructive power of cyclones – the generic term for typhoons and hurricanes – in any ocean basin over the last 30 years. In the South Indian basin, the location of cyclone Chido, there was a dramatic decrease in both frequency and duration in recent times.
Reality rarely gets much of a look-in these days when fanatical Net Zero activism is afoot, but the paper, written by a group of Chinese meteorologists, makes its case by considering the facts and the data. The scientists apply a “power dissipation index” (PDI) which they consider superior to single measure indicators since it combines storm intensity, duration and frequency. The graphs below show the cumulative index for tropical cyclones across all ocean basins along with a global indication.
Downward trends in the cumulative PDI can be seen in a number of Pacific regions, while the trend holds steady in the North Atlantic. The southern Indian ocean downward trend is particularly pronounced while the overall global line is also heading in a similar direction.
So why does all this scientific twaddle get written by the green activists in mainstream media? Much of it arises from the new pseudoscience that claims it can tie individual weather events to human-caused climate change. Press releases peddling climate Armageddon are issued days after a natural disaster and are eagerly reprinted by activist journalists promoting the Net Zero fantasy. The distinguished science writer Roger Pielke Jr. is a fierce critic of this new pseudoscience, which he calls weather attribution alchemy. In a recent Substack post in the aftermath of Chido, he noted that the WWA at Imperial College simply assumes the conclusion that it seeks to prove by accepting that every storm is made stronger because of warmer oceans. Using this explanation, continues Pielke, it is straightforward to conclude that the storm was made more likely due to climate change. Or as Imperial states: “The difference in the storm intensity and likelihood of this storm intensity between the counterfactual climate and today’s climate can be attributed to climate change.”
As the new Chinese paper shows, the matter is not quite so simple. Pielke notes that tropical storms encounter numerous environmental influences such as vertical wind shear and storm-induced ocean surface cooling, even when they remain over warmer waters. “Such complexities mean that simple storyline attribution – warmer oceans predictably mean stronger storms – is inappropriate when used to characterise the behaviour of individual storms,” he argues. Pielke also comes down hard on the statistical evidence backing the WWA claims. Even if storms such as Chido were more likely in the future, it would take a very long time to detect a significant change using the threshold 90% confidence set down by the Intergovernmental Panel on Climate Change (IPCC). And by very long time, he means thousands of years.
“Perhaps that is why assumptions are favoured over evidence,” suggests Pielke.
There were plenty of assumptions on display in a now routine end-of-year weather report from the BBC headed: ‘A year of extreme weather that challenged billions.‘ Written by Esme Stallard, it claims that record-breaking heat brought extreme weather including hurricanes and month-long droughts. Pride of place is given to Dr. Friederike Otto, lead of WWA and Senior Lecturer in Climate Science at Imperial, who claimed: “We are living in a dangerous new era – extreme weather caused unrelenting suffering.” “The impacts of fossil fuel warming has never been clear or more devastating than in 2024,” she added.
The redoubtable Paul Homewood is unimpressed with Stallard’s opening line about increasing extreme weather and has filed a complaint with the BBC. Stallard goes on to list a handful of random events, “but fails to provide any evidence that these are anything other than natural events which happen all the time”, states Homewood. “Nor is any evidence provided that such events have been getting more frequent or extreme over time,” he adds.
The BBC story highlighted typhoons in the Philippines as well as hurricane Beryl and stated that such events may be increasing in intensity due to climate change. Official data do not show any evidence of them becoming more powerful over time, notes Homewood. Much play was made of a recent drought in the Amazon, but Homewood points out that the World Bank Climate Portal reveals that rainfall has increased in the area by 5% over the last 30 years. Throughout the report, observes Homewood, the BBC bases its claims on weather attribution computer models. “However, computer models are not evidence, and can be manipulated to provide whatever results are desired. That is why they are widely derided by the wider scientific community,” he states.
For Roger Pielke, extreme weather attributions are “puzzling”. The most charitable explanation for their proliferation is that there is a demand for them, including from many in the media. The demand will be filled by someone, he concludes. “A less charitable explanation is that there is a systematic effort underway to contest and undermine actual climate science, including the assessments of the IPCC, in order to present a picture of reality that is simply false in support of climate advocacy. We might call that pseudo-scientific gaslighting,” he suggests.
Chris Morrison is the Daily Sceptic’sEnvironment Editor.
There have been a lot of unprecedented events going on in the Western Pacific. It’s amazing that no one in the major media outlets talks about this, given the source region this represents. It’s likely because there are blinders on as to anything that might be driving the weather besides man-made climate change, so such events that to those of us who watch this area are watching jaw-dropping events.
There have been a lot of unprecedented events going on in the Western Pacific. It’s amazing that no one in the major media outlets talks about this, given the source region this represents. It’s likely because there are blinders on as to anything that might be driving the weather besides man-made climate change, so such events that to those of us who watch this area are watching jaw-dropping events.
1st of all, the Honga Volcano above water inputs of unreal amounts of water vapor in the air likely led to the spike in global temperatures. It was the San Jacinto that caused the warming. There are many underwater vents, 10 MILLION of them, and we don’t know what the heck they are doing. But by observing rises in the Skin Surface temperatures ( SST) since the start of their increase around 1990, we can guess. After all, CO2 had been on the rise for 50 years. The bands that do the feedback were saturated from 1950. What changed? CO2 does not absorb incoming radiation but needs to be increased. OUTGOING LONG WAVE RADIATION (OLR) warming of the surface is a way to do that. Or a decrease in cloud cover over the tropics is a nice way, which would be a by-product of distorted warming as it changes. Sea Level Pressure, Global Wind Oscillation, and Vertical Velocity patterns. But the volcano was the San Jacinto (pulling the opponent into the trap) of the man-made warming argument because, without it, there would not have been the warming.
Now consider this:
1) 3rd lowest typhoon total on record in a so-called El Nino season (there was no El Nino as far as the Southern Oscillation Index was concerned). The years of El Ninos are when typhoons are supposed to run wild. The Accumulated Cyclonic Energy in the western Pacific got pretty close to average out there after 3 almost record-low years, which may be a record-low year. Given the West Pacific is responsible for 50% of the global ACE, this is a huge signal since the Atlantic has 1/3rd the ACE of the Western Pacific. So this year, if you double the Atlantic ACE but cut the West Pac by 50% the result between the two is below-average.
Have you heard anyone talk about this? I mean, aren’t we all globalists now? You hear if a typhoon goes wild (but like we see in the Atlantic they have tended to weaken if they are long-tracked as they approach the continents). So we hear about the Atlantic, but its crickets in the Pacific.
2) The SOI never reached an El Nino status (-8) for a ninety-day period). That the Oceanic Nino Index (ONI) reached 2 makes it even freakier. The other ONI El Ninos that reached 2.0 in 1982,1997,2015 all had strong SOI responses for DJF. This year, it was -6 with an unprecedented POSITIVE IN JAN!
2015-16. -16
1997-1998 -18
1982-1983 WAS A -30
How is this not brought up?
The warmer the West Pac gets, the weaker the SOI response. This is a big deal. An obvious by-product of climate change except the reason for it can not be linked strongly to man, but other inputs. Which makes it something no one will touch.
The MEI ( multi variate enso index), up until they killed it, had a record difference from the ONI. That is huge. And the loss of the MEI as a data source, since it RELIES ON ACTUAL OBSERVATIONS NOT SOME REANALYSIS, is a blow to objectivity.
3) unprecedented warming in January around Australia
November
Jan
change
SERIOUSLY, WHERE DID THAT COME FROM, MAGIC? IT IS OPPOSITE OF THE EL NINO ANALOG.
But now comes this. I can’t even believe this could happen.
But this would add to the string of events that appear to be unprecedented.
Look at SST temps now:
Here is the same day in 1989:
This is when the geothermal spreading started to increase.
Again, that it PRECEDED the rise means a likely contribution to the causation.
Now look at that above and try to imagine the change in Water Vapor input. I say imagine because it seems, despite being a much more prominent GHG and one that actually can be a “heat-trapping gas”, it is not quantified like CO2. The fact is the rise of the CO2 monster started way before this, and the warming was almost nonexistent in the oceans.
It got shifted around, some places cooler, some warmer, but nothing like the change since the geothermal input started.
But now comes this from the CFSV2 ( Climate Forecast System version 2), and I have been watching this like a hawk: what would be a record drop in Indo pacific SST:
For you lovers of winter, that is not that bad a picture off the west coast. That ring has been associated with colder, stormier winters and also linked to increased hurricane activity for the US, which the model is likely seeing. Notice the cooling off of the southeast coast, a likely by-product of the model seeing plenty of hurricanes churning up water. And lots of rain. Certainly, the precip chart says that.
This is very close to our analog years in the Dec 7, 2023 hurricane forecast we put out ( link below):
Forecast for November (remember this is after all the hurricanes went through. Notice the warm water still left in the typhoon areas where we are forecasting a season about 50% of average or a near-record low).
This is almost as cold in the INDO Pacific as in November of 1989. In fact, it is not as cold as in the Indian Ocean back then and the La Nina this year is stronger.
Now let me ask you this question, if the oceans had not warmed, do you think the air would have warmed? So it comes down to what warmed the oceans. Why is the model seeing the drop, which would be unprecedented in that area of the world and the strongest El Nino to La Nina turnaround on record (there is another event that should be at least talked about)?
Why is the model seeing this? Because — and we can not confirm this fully yet — there may have been a downturn in geothermal activity.
Remember, the warmer it gets the more it needs even more input to warm more. So, any downturn may start a response. But I DON’T KNOW. I believe it, but I can’t know it because we do not have the data saturation. We only have one data point for every 112k square miles, and they only go to 6k. I suspect they are seeing cooling at that level. The average depth of the ocean floor is 14k. So, I have no proof. But people who just look at one thing — man-made climate change — have no proof it is not. SOMETHING IS GOING ON. Since the CO2 rise has been constant in its up-down fashion, how can it be CO2? (Never mind that its back radiation relies on surface warming, fewer clouds, and more Outgoing Longwave radiation), inconvenient facts when blaming CO2 for warming the oceans when it only penetrates a mm or 2 of the surface.
You see we know a lot about the air and the sun, but of the oceans, laughably little.
But here is something as a weather nut or climate person, or someone who may be opened-minded enough to ask questions that you should be aware of: A lot is going on here that is way way beyond “this is the warmest ever”. There are indications to the opposite, and they are in the form of what should be raising the curiosity of every meteorologist, including those in media, the academics in the field, and the professional organizations.
I am excited about testing my idea in the coming years. The reason for the increased geothermal could be linked to the turning of the earth’s core in a natural cycle, which increases stress on the ocean floor, releasing more heat through the 10 million geothermal vents. But it’s not looked at and scoffed at when it is. It’s like a willingness to not look since it would upset so many applecarts. In the meantime, along with the highest global temperatures on record over the last year, which can be traced to WV increase as much as anything else, from a natural source, other events in a crucial area for weather and climate have been and are occurring.
But where the heck is the field of meteorology, and the Media outlets on all this? I have just listed these unprecedented events in the major climate source region for the planet (a couple of others are being forecasted). They should be having a field day with examinations into this rather than saying the same thing over and over again.
And sadly, the curiosity about them may be a victim of climate blinders, which are needed to just look at one thing, as well as the pressure to look the other way that is put on a lot of people who make a living at this.
During weather events, how often are we confronted with the simple claim: “More heat leads to more energy available, which leads to severe storms“?
This is so catchy that it can be understood with just a basic knowledge of physics.
During weather events, how often are we confronted with the simple claim: “More heat leads to more energy available, which leads to severe storms“?
This is so catchy that it can be understood with just a basic knowledge of physics.
So is the claim: “The warmer the tropical sea the more severe tropical storms, called hurricanes over the Atlantic or typhoons over the Pacific.” is often bandied about. The storms all occur over the ocean, and record surface temperatures were reported in 2023.
The temperatures (orange) already at the start of April 2023 were well above those of a year earlier . (Image: Climate Reanalyzer).
Following this logic, the energy in storms in 2023 should also have been at a record level and there should have been more strong storms than ever before. And we did indeed see a record last year:
Since the beginning of systematic satellite-based observations in 1982, the number of severe tropical storms globally has never been as low as it was last year, in 2023. This contradiction between record-high ocean temperatures and record-low severe tropical storm numbers makes it clear that it is never as easy as often suggested. If you look at the relationship between the global ACE (for “accumulated cyclone energy” in storms) and the surface temperatures of the oceans, you will find the correlation is highly pronounced in the El Nino region, elsewhere there are only very unclear signatures.
This means: globally many storms with El Nino, few with La Nina. The image was generated with the KNMI Climate Explorer.
However, the oscillation there is natural and “modulates” the temperatures with a pattern in the Pacific tropics and subtropics with global effects. Note: In the real climate system, nothing is so simple that it can be explained with elementary school knowledge. Whoever tries to do this: you have to be particularly careful not to be manipulated.
If you follow all the science, you will sleep much better knowing claims of a CO2 driven climate crisis is most likely just a flawed theory placed upon good scientific data! By following all the science, I am sleeping well!
Welcome back everyone.
How long heat gets trapped near the earth’s surface determines the global temperature, but the lack of adequately measuring this time delay is the greatest weakness in global warming theories.
The public often gets the wrong impression of the greenhouse effect from illustrations like this suggesting CO2 is trapping heat forever.
A comparison of the time delayed cooling by 3 different mechanisms of trapping heat, calls into question how each mechanism contributes to global temperatures and extreme weather. Other heat trapping mechanism by sea ice, clouds, or urban surfaces, won’t be discussed. Now undeniably, greenhouse gases delay the escape of infrared radiation back to outer space. .
In contrast heat domes that produce heat waves don’t trap radiation but suppresses the normal convection process that normally carries heated air away from the surface for days and even months.
The ocean’s salty sub-surface layers also suppress ocean convection, trapping ocean heat for days, seasons, and years. And that trapped heat intensifies hurricanes and typhoons.
In one of the 20th century’s most influential books “the structure of scientific revolutions, Thomas Kuhn wrote “philosophers of science have repeatedly demonstrated that more than one theoretical construction can be placed upon a given collection of data.” Kuhn was advising us to be careful and distinguish good data from the opinions claiming the data supports their pet theory.
This illustration graphicly represents the collection of data describing how the energy absorbed by the sun each day escapes back to space via waves of long wave radiation. It is solid, undisputed science based on theory and observations from satellites and laboratory experiments. It is the foundation of greenhouse theory upon which opinions regarding various climate crisis theories have been constructed.
The laws of physics have theoretically determined “how much” energy each infrared wavelength should transport back to outer space, for a given surface temperature if, there was no atmospheric interference. This is represented by the blue curve.
For non-physicists, it is helpful, to think of infrared wavelengths as roadways carrying solar heat from the earth back to space. Wavelengths between 20 and 15 microns should act like interstate highways carrying the greatest flow of heat,
While wavelengths of 5 or 40 microns act like dirt paths allowing very little heat transport.
The black jagged line represents how much energy each wavelength is actually transporting back to space as observed by satellites.
The difference between the blue and black curves represents an undeniable greenhouse effect. This is all excellent data and settled science.
But beware! This data does not determine for how long infrared heat will be trapped. Greenhouse gases only serve as detours, not permanent traps. Those detours simply delay the time needed for heat to escape to space. Not understanding this crucial point, has led to many absurd theories of a climate crisis, mass extinctions and much weeping and gnashing of teeth.
CO2 is a powerful greenhouse because it absorbs wavelengths centered around 15 microns that serve as major interstate highways for heat escape. CO2 forces half the theoretical heat to take a detour.
CO2 emits any absorbed heat in less than a second and emits those wavelengths in all directions with half re-directed back to the earth’s surface. It is this redirected heat that is believed to warm the surface.
In this illustration the green line separates absorption by CO2 from absorption by water vapor. The red line shows that by doubling CO2, it only increases the amount of re-directed heat by 1%.
Water vapor absorbs much more heat from a wider range of wavelengths. Dry desert climates lacking water vapor experience a reduced greenhouse effect. Heat can escape more freely so that nighttime temperatures rapidly plummet by 50 to 100 degrees Fahrenheit, despite a remaining CO2 effect.
More importantly, there are also wavelengths that always escape freely to space, providing an atmospheric window that allows about 15 to 20% of the earth’s energy to escape without delay. That window also provides the escape detour for re-directed greenhouse heat.
Although the redirected energy is transported by specific wavelengths of water vapor and CO2. It has a more general effect. A warmer surface now emits the entire spectrum of wavelengths.
So, 20% of CO2’s redirected energy now escapes freely through the atmospheric windows counter-acting the warming. That process repeats and continues throughout the night dropping surface temperatures lower and lower, back to their early morning minimums. So, despite added energy, the greenhouse effect doesn’t trap heat for very long.
Extreme heatwaves caused by heat domes operate in a manner like a car with its windows raised. It doesn’t matter how heat is radiating back to space, but for how long warm air is trapped close to the surface.
The longer the windows are up during midday sunshine, the higher the temperatures rise. At midday in 80F heat, temperatures inside your car can rise by 43 degrees to 123F in just one hour. Tragically, not realizing how quickly heat can accumulate, pets and children left in cars can die.
To reach 123 degrees Fahrenheit, the car’s rate of energy gain was at least 154 W/m2 for a full hour (FYI a watt is a measure of energy per second). Increased CO2 only adds about 2 W/m2, so it would be silly to argue that rising CO2 made the car hotter, when just lowering the windows would eliminate the extreme temperatures. The important dynamic for people to understand is suppressed convection causes extreme temperatures.
The ground, heated by solar radiation, sheds that heat in 3 ways: by emitting a spectrum of longwave radiation, by cooler air absorbing heat when contacting the ground, and by convection that carries the heated air towards the stratosphere. Without convection, the earth’s surface would trap surface heat like the car with its raised windows.
Convection not only causes warmer air to rise but allows cooler air from higher altitudes to sink. The mixing of cooler air further reduces surface air temperatures.
Carrying warm air up to the stratosphere is also crucial for cooling. You can see where the stratosphere begins when a rising rain cloud flattens out as it reaches an altitude where the stratosphere begins, called the tropopause. At that altitude, the air is about 100F (64C) cooler than the ground. The air has cooled due to both lower air pressure and by radiating heat back to space.
However, if the air doesn’t radiate heat away, cool air would simply warm back to its original temperature as it sinks. So, how does 99% of the air molecules that are not greenhouse gases, mostly oxygen and nitrogen, radiate away the heat they absorbed from contacting the ground?
C02’s warming effect is greatest at low altitudes where it is largely saturated. So future increases of CO2 will have a smaller and smaller warming effect.
Unfortunately, click-bait media rarely informs the public that CO2 also has a strong cooling effect increasing emissions in the stratosphere and mesosphere. Satellites observe that the stratosphere is cooling twice as fast as the lower atmosphere is warming.
Warmed oxygen and nitrogen can shed their heat by colliding with CO2 and transferring its heat. So, CO2 can then radiate their heat away.
In contrast, heat waves are caused by suppressed convection in the lowest 6 kilometers of the atmosphere that prevents rising air from reaching the stratosphere and cooling radiatively. Heat domes trap heat for days. They are high pressure systems where sinking air inhibits convection and reduces cloud cover which also increases solar heating.
Canada’s record high temperature was set and reset 3 days in a row at the end of June 2021 in Lytton, British Columbia. The final record was 45F (25C) warmer than the average maximum temperature for June. A difference that’s intriguingly like the increased temperature of the car with its raised windows.
Southwestern Canada’s heat wave was caused by an exaggerated ridge in the jet stream known as an omega block. Omega blocks regularly cause high-pressure systems that linger in one location. As the block remained in place for days, more heat accumulated each day driving Canada’s record temperature higher and higher.
Click-bait media, like CNN clearly doesn’t know its geography. They ranted that this very local heat dome was evidence that “climate change is frying the whole northern hemisphere.”
However, science doesn’t support CNN’s rants as climate models all suggest any warming “should reduce such blocking events.”
Finally, if we also consider that the dryness accompanying most heatwaves reduces the normal greenhouse effect, plus the absolute lack of any correlation between heat waves and rising CO2 as seen in this EPA graphic, it suggests that all the hype by politicians and the media ranting heat waves are evidence of a CO2 driven climate crisis, is just unsubstantiated fear mongering.
Lastly, suppressed convection also warms the oceans causing layers of trapped heat that can warm the air and intensify hurricanes and typhoons. There is a scientific consensus that no matter at what depth heat is absorbed, it is trapped in the ocean until it rises to the micron-thick skin surface, the only place ocean heat can escape.
However, when there is a salinity gradient with fresher water at the surface and saltier water below, despite being warmer, the denser saltier water suppresses convection, preventing it from reaching the skin surface to cool.
Humans have taken advantage of that salinity effect by creating solar ponds that generate useful heat to warm buildings and greenhouses or generate electricity. Solar ponds maintain a bottom layer of dense salty water at about a 6 to 10-foot depth where solar heating is greatest. Those dense layers trap penetrating solar heat, raising the bottom layer temperature to as high as to 190F (88C) despite air temperatures of only 68F (20C).
Similarly, salinity gradients in the ocean trap heat in subsurface layers maintaining warmer ocean temperatures from the tropics to the arctic.
Surveys in tropical oceans observed that the upper 20 to 40 meters will usually be well mixed by the winds and currents. So that layer has similar salinity, represented here by the blue line.
As well as similar temperatures represented by the black line.
But between 40 and 60-meters depth, increased salinity trapped solar energy and slightly increased temperatures where we would otherwise expect cooler temperatures due to declining solar penetration. Oceanographers call this layer the “barrier layer” because it stores heat and prevents colder deeper water from mixing with the surface layer, thus making surface temperatures warmer.
In contrast to the solar-salinity heating effect, there is no obvious mechanism demonstrating how greenhouse infrared might warm a solar pond or the ocean. All infrared energy re-directed towards the surface by greenhouse gases never penetrates deeper than a very few microns into the ocean’s skin surface layer.
A recent tropical ocean study measured 410 watts of greenhouse infrared energy penetrating a few microns into the cool skin surface.
However, the cool skin surface immediately radiates away all the heat that reaches that layer. In this study the heat emitted from the skin layer accounted for all the infrared heat from the atmosphere plus any solar heated subsurface water that had risen by convection and conduction to the skin layer.
Solar heated water requires more time to reach the skin surface and ventilate. Thus, it is most likely that any ocean warming is driven by trapped solar heat that is mixed downward.
There are well studied natural mechanisms demonstrating how oceans create and maintain salinity gradients that trap subsurface solar heat. In the simplest of terms, regional differences in evaporation and precipitation produce the required salinity gradient.
Atmospheric circulation, the Hadley Circulation, creates regions of descending air and high pressure that generate clear skies, greater solar heating as happens in heat waves and high rates of evaporation with very little rainfall. Saltier water is produced there.
As illustrated by the red regions, these so-called ocean deserts happen at the same latitudes where the atmospheric Hadley Circulation maintains deserts on land.
The trade winds then blow that saltier water towards the equator and westward.
The trade winds also blow the evaporated water vapor towards the equator where it converges, then rises and produces the world’s greatest region of rainfall around the equator, here represented in blue, and named the Intertropical Convergence Zone. The copious rainfall maintains the salinity gradient with fresh water on top of the warm saltier water. These combined dynamics constantly provide the needed ingredients to produce permanent heat trapping barrier layers.
This “solar pond” heat trapping mechanism forms the earth’s greatest reservoir of heat, the western pacific warm pool, which stores solar heated water as deep as 200 meters. The warm pool grows during La-Nina like conditions and shrinks when an El Nino event ventilates that heat.
During La Nina-like conditions, the amplified trade winds blow the warm salty water into the western pacific warm pool.
Simultaneously, colder deep water upwells in the eastern pacific, permitting a high-pressure system to form that amplifies the trade winds and creates clearer skies and greater solar heating.
As a result, the eastern Pacific and eastern Atlantic, illustrated here by the blue regions,
Absorb and trap more solar heat than any other regions on earth. That stored heat is eventually transported around the world where it ventilates and warms the atmosphere.
The regions illustrated in red represent where the most of that trapped heat ventilates, warming those latitudes several degrees higher than possible if there was no ventilated heat.
For example, heat ventilating from the Gulf Stream is why western Europe’s winters are milder than similar latitudes in North America by 27-36F (15-20C).
These dynamics contribute to the recent 150-year global warming trend as the tropical Pacific’s predominant El Nino-like condition during the little ice age switched to a predominant heat-absorbing La Nina-like conditions this past century. Intriguingly, based on scientific estimates of the speed of the global conveyor belt’s transport, heat now ventilating in the arctic and reducing sea ice may have first been trapped in the Pacific Ocean 200 years ago.
It is also the trapped heat in tropical warm pools that enables tropical storms to evolve into hurricanes.
And the pacific warm pool with its more permanent barrier layers enables hurricanes with the most intense wind speeds designated as category-5 hurricanes, to develop.
Uniquely, in the tropical south Atlantic, hurricanes virtually never form because waters heated in the tropical south Atlantic circulate across the equator and get stored in the north Atlantic warm pool.
In 2005 three category 5 hurricanes struck the United States prompting a flurry of click-bait media headlines proclaiming global warming was making more fierce hurricanes that also “intensify more rapidly”, thus rising CO2 will continue to make hurricanes more deadly.
But examining the different 2005 storm tracks of hurricane Wilma or hurricane Katrina reveals those 2005 hurricanes only reached a “fierce” category 5 status for a very short time and over just a very small local area and not when making landfall. Thus, it is regional ocean warming that is much more likely to be the cause of any intensification bouts. Not global warming.
Political fear mongers do not hesitate to weaponize the societal damage and human grief caused by hurricanes, so they cherry-pick the brief category 5 stints to blame rising CO2, while ignoring the dynamics causing hurricanes to exist for most of their lifetime in much weaker conditions.
Fortunately, mother nature quickly counter-acted the blatant fear mongering. For the next 9 years the USA experienced no intense hurricanes leaving most climate experts without any explanation.
Despite persistent click-bait media headlines from the NY Times or national public radio claiming CO2 is making hurricanes more deadly,
Good solid science finds no correlation with rising CO2 and hurricane frequency.
And no correlation with any increased frequency of the most intense hurricanes, categories 3, 4 & 5.
Yet as expected, the 150 mph winds at landfall from the 2022 hurricane Ian, provided an opportunity for the Guardian and world’s worst alarmist climate scientist, Michael Mann, to fear monger, claiming a climate crisis is causing more powerful hurricanes.
Hurricane Ian was a category 4 when it made land fall along the western coast of Florida. Mann emphasized that Ian was the fifth strongest hurricane to ever make land fall in America. But Mann avoided sharing the inconvenient truths that Ian was tied with 5 other category 4 hurricanes such as the 1919 Florida Keys and 1932 Freeport hurricanes, or the strongest landfall was the 1935 category 5 Labor Day hurricane.
Mann also failed to share that numerous peer-reviewed studies have documented that short bouts of hurricane intensification happen when they passed over the stored heat in ocean barrier layers.
The Gulf of Mexico and Caribbean Sea experience a shifting mosaic of warm barrier layers. Multiple studies have shown that barrier layers supply the heat needed to intensify a hurricane as well as preventing the typical upwelling of cooler deeper water that weakens a hurricane. Still to push his pet theory that all things are possible with rising CO2, Mann’s Guardian article never mentions barrier layers at all.
To produce the salinity gradient for a barrier layer, the Amazon, Orinoco, and Mississippi rivers supply seasonal plumes of fresh water, highlighted in blue, into the Caribbean and Gulf of Mexico.
The Loop Current erratically transports deep warm & salty equatorial waters northward towards the Gulf coast. It sometimes veers quickly to the east to join the Gulf Stream. Or 2) it sometimes loops much further northward and 3) sometimes those loops pinch off to form warm eddies.
Whatever the case, when hurricanes pass over a region with fresh river water above and warm salty loop current waters below, the hurricanes intensify. No wonder Michael Mann avoided discussing barrier layers, barrier layer formation and thus hurricane intensification has nothing to do with rising CO2 or a climate crisis.
Clearly, there are many proven scientific dynamics that trap heat and drive warmer temperatures other than rising CO2.
If you follow all the science, you will sleep much better knowing claims of a CO2 driven climate crisis is most likely just a flawed theory placed upon good scientific data! By following all the science, I am sleeping well!




You must be logged in to post a comment.