Global warming, climate change, all these things are just a dream come true for politicians. I deal with evidence and not with frightening computer models because the seeker after truth does not put his faith in any consensus. The road to the truth is long and hard, but this is the road we must follow. People who describe the unprecedented comfort and ease of modern life as a climate disaster, in my opinion have no idea what a real problem is.
The Biden administration’s “climate envoy,” former senator and failed presidential candidate John Kerry, said on Wednesday that China invited him to visit “in the near term” for talks on climate change.
The Biden administration’s “climate envoy,” former senator and failed presidential candidate John Kerry, said on Wednesday that China invited him to visit “in the near term” for talks on climate change.
Kerry said President Joe Biden has given his blessings to the proposed meeting, but some details need to be worked out — chief among them the uncomfortable fact that China is the world’s worst polluter by a wide margin, and its use of carbon-based fuels is increasing even as the climate movement pushes fantastically expensive and inefficient “green energy” on the free world. [emphasis, links added]
“This has to be cooperative, notwithstanding other differences that do exist. This is not a bilateral issue. This is a universal global threat to everybody in every nation,” Kerry insisted on Wednesday.
China has invited me to visit in the near term to be able to meet with him [Chinese climate envoy Xie Zhenhua] to be able to work on work that we’ve been doing for several years, which is trying to find the pathway forward to be able to cooperate in ways that are beneficial to the world. And hopefully, we’ll be able to do that.
Kerry once again illustrated why he is Communist China’s favorite American houseguest by refusing to criticize China’s titanic expansion of coal burning and its ongoing pollution, instead mumbling that he thinks Beijing has embraced the “terminology” of the Paris Climate Accord but has not “fully embraced” actually reducing its emissions.
None of this confused rhetoric does anything to dispel the impression that China loves to talk about climate change but has no intention of compromising its own energy production or industrial goals and in fact, seems to envision a world in which it utterly dominates heavy industry while the West cripples itself in the name of global warming.
Even environmentalist organizations like Greenpeace, which usually refrain from criticizing China, have begun noticing the wide gap between Beijing’s rhetoric and its actions.
Kerry himself occasionally admits that China keeps none of its climate promises and sees the issue as a far lower priority than winning its contest for economic and political influence with the United States.
Quite why Facebook would want to rely on the USA Today for its source of science is a mystery. Perhaps they should have actually checked what real scientists are saying
And this is the story the Facebook censors don’t want you to see:
Quite why Facebook would want to rely on the USA Today for its source of science is a mystery. Perhaps they should have actually checked what real scientists are saying:
Abstract
The Antarctic continent has not warmed in the last seven decades, despite a monotonic increase in the atmospheric concentration of greenhouse gases.
In this paper, we investigate whether the high orography of the Antarctic ice sheet (AIS) has helped delay warming over the continent.
To that end, we contrast the Antarctic climate response to CO2-doubling with present-day orography to the response with a flattened AIS. To corroborate our findings, we perform this exercise with two different climate models.
We find that, with a flattened AIS, CO2-doubling induces more latent heat transport toward the Antarctic continent, greater moisture convergence over the continent and, as a result, more surface-amplified condensational heating.
Greater moisture convergence over the continent is made possible by flattening of moist isentropic surfaces, which decreases humidity gradients along the trajectories on which extratropical poleward moisture transport predominantly occurs, thereby enabling more moisture to reach the pole.
Furthermore, the polar meridional cell disappears when the AIS is flattened, permitting greater CO2-forced warm temperature advection toward the Antarctic continent.
Our results suggest that the high elevation of the present AIS plays a significant role in decreasing the susceptibility of the Antarctic continent to CO2-forced warming.
The IPCC’s “Current Status and Trends” 100% falsely portrays fossil fuels as making climate, and life, worse than ever, even though they’ve made both better: “Climate change has adversely affected human physical health globally… and is contributing to humanitarian crises.”
Note: This week’s set of Energy Talking Points is long, and took both me and Steffen Henne (my Head of Research) a long time time to prepare. We thought it was worth the effort to create (and is worth your effort to read) because the subject matter, the UN IPCC’s recent Synthesis Report, has a huge influence on global energy policy. And it is just an absolute piece of garbage. Yet it’s gotten very little pushback. We hope that demolishing the “Report” in detail will help discredit the current state of the IPCC, which at this moment is one of the most destructive forces in the world.
The IPCC’s heralded Synthesis Report is supposed to accurately synthesize the best information about human beings’ climate impacts in order to rationally guide policy.
Instead, it severely distorts science to advance a corrupt political agenda.
The UN’s Intergovernmental Panel on Climate Change (IPCC) recently published, to great fanfare, its “Synthesis Report” (SR)—the culmination of its lengthy 6th “Assessment Cycle” of reports on various aspects of human beings’ climate impacts and their implications for policy.1
The Synthesis Report is supposed to accurately synthesize the best info about human climate impacts—including the threats of dangerous temps, storms, floods, etc—to rationally guide policy, above all what to do about fossil fuels, the leading cause of climate-warming GHGs.
Because of the Synthesis Report’s prestige, the world took it very seriously when they heard about its dire claims. E.g., UN Chief Antonio Guterres saying we can’t have a “liveable future” if we don’t take “urgent climate action”—above all rapidly eliminating fossil fuel use.2
Even skeptics of the IPCC Report’s drastic calls for rapidly eliminating fossil fuels—often via means that give enormous power and money to favored politicians—may feel uncomfortable questioning a “scientific” Report.
But a common-sense reading reveals that it’s total garbage.
A proper climate synthesis report must cover 2 key issues:
1. An evenhanded (covering minuses and pluses) and precise account of our climate impacts. 2. An account of our ability to master climate danger, including the use of fossil fuel to neutralize its own negative climate impacts.
1. An evenhanded and precise account of our climate impacts.
With rising greenhouse gasses we must consider both negatives (e.g., more heatwaves) and positives (e.g., fewer cold deaths, global greening from CO2). And we must be precise, not equating some climate impact with huge impact.
2. An account of our ability to master climate danger
Any valid climate synthesis must account for climate mastery, because the same fossil fuels that impact climate can also neutralize negatives—e.g., via fossil-fueled air conditioning to alleviate heat and irrigation to alleviate drought.
You don’t need to be a scientist to know that a proper climate synthesis report should include both an evenhanded and precise account of our climate impacts and an account of our ability to master climate danger.
And if you read the IPCC Synthesis it’s obvious it fails at both.
Instead of an evenhanded and precise account of our climate impacts, the IPCC SR gives us a blatantly biased view of exaggerated negative impacts, with no mention of positives like global greening thanks to CO2 fertilization of the atmosphere or decreasing cold-related deaths.
Instead of accounting for our climate mastery ability, the IPCC SR ignores our ability to neutralize negative climate impacts, despite the fact that we’ve driven climate disaster deaths down by 98% over the last century!
This is like a polio report omitting the polio vaccine.3
By exaggerating our negative climate impacts and ignoring our ability to master climate danger, the IPCC Synthesis perpetrates a 3-part perversion of science: “A: Current Status and Trends” “B: Long-Term Climate and Development Futures” “C: Near-Term Responses in a Changing Climate”
“A: Current Status and Trends” distorts the present state of climate danger
“B: Future Climate Change, Risks, and Long-Term Responses” distorts the evidence about future climate danger
“C: Responses in the Near Term” calls for huge power and money for an anti-fossil-fuel agenda
The IPCC’s “Synthesis Report” has been criticized intelligently by various experts, including Roger Pielke and Patrick Brown.
But this isn’t enough. Allexperts in the field should unequivocally condemn this dangerous piece of garbage and the process that produced it.4
How the IPCC severely distorts the present state of climate danger
By exaggerating negative impacts and ignoring climate mastery, the IPCC portrays the world as suffering “widespread adverse impacts… and related losses and damages” when climate danger is lower than ever!
Any honest “Current Status and Trends” report on climate would start by acknowledging that any negative climate changes so far have been far outweighed by our increasing climate mastery ability, which led to plummeting climate deaths thanks to our fossil fuel-powered technology.5
Insofar as a climate report addresses the overall state of the world, it should acknowledge that human life has never been better. E.g., extreme poverty (~$2/day) plummeted from 42% in 1980 to <10% today. And it should recognize fossil-fueled industrialization as a root cause.6
The IPCC’s “Current Status and Trends” 100% falsely portrays fossil fuels as making climate, and life, worse than ever, even though they’ve made both better: “Climate change has adversely affected human physical health globally… and is contributing to humanitarian crises.”
Any honest “Current Status and Trends” on climate would also acknowledge the impressively stable level of economic losses from climate—vs. an expected catastrophic increase–despite the increasing accumulation of wealth in disaster-prone spots like coastal areas.7
Instead of acknowledging flat or declining climate damages, the IPCC portrays things as worse than ever: “individual livelihoods have been affected through, for example, destruction of homes and infrastructure, and loss of property and income, human health and food security.”
Any honest “Current Status and Trends” report should acknowledge that while everyone has become safer from climate, the most developed countries are safest. And thus the path to increasing safety is more development, which will largely require more fossil fuels for the foreseeable future.8
Instead of acknowledging the improving climate safety of the poor world, largely due to fossil fuels. the IPCC pretends their situation is worsening due to the world’s use of fossil fuels.
To summarize: “The Current Status” section of the IPCC “Synthesis Report” gives a 180-degree false portrayal of today’s record-low climate danger by exaggerating our negative impacts and ignoring our climate mastery, so as to portray climate danger as record-high.
How the IPCC severely distorts the future state of climate danger
Just as the IPCC distorts the present evidence about (actually declining) climate danger, so it does with future danger to falsely claim: “Climate change is a threat to human well-being and planetary health.”
The fact that the IPCC’s Synthesis Report portrays record-low current climate danger as record-high calls its “Future Climate Danger” section into question: Why trust predictions about the future by those who deny the reality of the present?
And indeed, the section is garbage.
To understand how bad the IPCC’s “Future Climate Change, Risks, and Long-Term Responses” section is, note that it portrays climate danger as “a threat to human well-being” even though the reports it’s based on say nothing of the sort.
Preceding parts of the IPCC’s Sixth “Assessment Report” that supposedly inform the Synthesis Report have many flaws—most notably, they severely underestimate humanity’s climate mastery ability.
But those reports do not show a threat to a “liveable future” like the “Synthesis” claims.
The IPCC’s Assessment Reports, contrary to the “Synthesis” of “a threat to human well-being” all show that the overall well-being of humans will continue to increase for the foreseeable future.
A BBC article headline asked: ‘Carbon capture: What is it and how does it fight climate change?’ But a report last year found a Shell Oil project output more CO2 than it captured. The amount of CO2 such sites can capture is negligible anyway, and they’re relying on ‘hopium’ to bring the high costs down. Given the lack of evidence of success of CCS installations, why is the BBC – or anyone – promoting it as a climate benefit?
A BBC article headline asked: ‘Carbon capture: What is it and how does it fight climate change?’ But a report last year found a Shell Oil project output more CO2 than it captured. The amount of CO2 such sites can capture is negligible anyway, and they’re relying on ‘hopium’ to bring the high costs down. Given the lack of evidence of success of CCS installations, why is the BBC – or anyone – promoting it as a climate benefit? – – – The UK government has announced that the first sites in the UK to capture greenhouse gases will be in Teesside, says BBC News.
The carbon capture plants are designed to prevent carbon dioxide (CO2) from industrial processes and power stations being released into the atmosphere.
The announcement was part of the government’s new Net Zero Strategy and aims to move the UK closer to meeting its legally-binding carbon commitments. . . . Why is carbon capture needed?
Carbon capture power plants are part of the government’s commitment to remove carbon from UK electricity production by 2035.
It hopes to build at least one by the mid 2020s, although that deadline now looks improbable.
There has been a big expansion in renewable energy in the last decade – in particular the use of offshore wind – but the unresolved question is how to keep the lights on when the wind isn’t blowing.
Carbon capture power stations are seen as part of the solution, along with the increased use of nuclear energy, and other rapidly-evolving technologies such as hydrogen. . . . How much CO2 will these plants remove?
In 2021, the UK emitted 425 million tonnes of CO2. That’s fallen by almost 50% since 1990.
The amount being captured at these proposed power stations is very small by comparison.
None of the proposed carbon capture plants claims to capture more than two million tonnes a year.
The government has set a target to capture between 20 and 30 million tonnes of CO2 a year by 2030. That could involve other industrial processes as well as power generation.
How much will carbon capture cost?
The technology has been around for decades. It’s mainly been used in industries where captured CO2 can be reused, for example to force out oil and gas from underground reserves.
There are no such plans to use the CO2 from the new proposed power stations.
The cost of a new gas power station, providing electricity for nearly a million homes, is around £350m.
Catherine Raw of energy company SSE told the BBC that building a similar sized gas power station with carbon capture would roughly double the cost.
The hope is that the price might fall over time. The cost of renewable energy for example has plummeted in the last decade.
There are those who see carbon capture as too expensive and believe the money would be better spent on renewables and power storage (like batteries).
“These power stations look like another excuse for the government to show preference to their friends in the oil and gas industry, making energy more expensive to everyone else’s disadvantage,” says Dr Doug Parr of campaign group Greenpeace UK.
Do other countries have carbon capture?
In September 2022 there were just 30 carbon capture facilities in the world, according to a report from the Global CCS Institute.
Almost all of these are attached to industrial plants carrying out activities such as natural gas processing or fertiliser production.
Once built, it is hoped other industries would use the UK power station’s pipeline to store CO2 under the North Sea.
So that’s what I learned from the Vostok data—that humans have been through warmer periods many times in the past without them being an “existential crisis”, that oceanic outgassing isn’t the cause of the modern CO2 increase, and the speed of modern warming is far from unprecedented.
I got to thinking about the ice cores. It’s pretty amazing to realize that the air trapped in the tiny bubbles in the ice is the very air that was trapped there way back when the ice formed. And that air can be hundreds of thousands of years old. Not only that, but we can analyze the trapped air to see the changes in CO2 over time.
How accurate are the results? Well, different ice cores drilled and analyzed by different groups of scientists give very similar results. Here are some recent ice core CO2 measurements, along with the Mauna Loa measurements in orange.
Figure 1. CO2 measurements from a variety of ice cores, along with Mauna Loa measurements in orange.
As you can see, there’s very good agreement between all of the various ice cores, ice core analysis groups, and ice core CO2 measurement methods. And the ice core measurements agree with the Mauna Loa CO2 observations quite well.
Another thing that can be calculated from the isotopes in the air trapped in the ice-core bubbles are the temperatures back in the day. The Vostok ice core data, one of the longest datasets, recorded four glaciated intervals and five “interglacials” including our current interglacial, the Holocene.
Figure 2. Vostok global temperature reconstruction, along with modern (1850-2022) HadCRUT temperature measurements.
Now, there are several very interesting things about this graphic. First, people keep saying that a slight global warming is an “existential crisis”. But in both of the previous interglacials, temperatures were up to 2°C warmer than today. That’s 3.6°C warmer than the “preindustrial temperature”, far above the impending terror temperature of 1.5°C warmer than preindustrial that they keep scaring us with.
There were modern humans around for both of those hot spells, along with most modern life forms. It wasn’t an “existential crisis”. It wasn’t a crisis at all. It was a warm time.
And humans also existed through the glacial periods. In total, humans have seen a swing of +2°C warmer than today’s temperature to -9°C cooler than modern times … a very wide swing.
Next, the orange/black line at the right is the post-1850 warming. As you can see, the Vostok data indicates that the world has been warmer than today, both earlier during this interglacial as well as in every one of the previous interglacials in the record.
Call me crazy, but I’m not seeing any reason to panic or to demolish the fossil fuel economy in any of that …
Moving on, how about the Vostok CO2 data? Here’s a graph comparing the Vostok CO2 (right scale) and temperature (left scale) data.
Figure 3. Vostok Ice Core CO2 and Temperature.
So … is CO2 related to temperature? Is CO2 the secret temperature control?
The two are definitely related. And given the length of the dataset, almost half a million years, we can see that there is a clear physical relationship over the entire time. Either CO2 causes temperature changes, or temperature causes CO2 changes, or they both affect the other. As you might imagine, in nature the latter situation is the most common.
But regardless of the causation, clearly Figure 3 shows the long-term equilibrium relationship of the two. So we can investigate the various conditions.
First, let’s assume that CO2 is controlling the temperature. Analysis of the data in Figure 3 yields:
Change in temperature (∆T) = 13.4°C per doubling of CO2 (“climate sensitivity”)
Hmmm, sez I … the accepted value for climate sensitivity is not 13.4°C / 2xCO2. It’s somewhere around 2°C to 4°C / 2xCO2, far lower.
So let’s look at the opposite possibility, that temperature is changing the CO2. Analysis reveals the following relationship:
Change in CO2 (ppmv) = 9 ppmv per °C
Hmmm, sez I … seems possible. As the oceans warm, they outgas. However, that’s not enough to explain the modern CO2 increase.
Finally, it’s certainly possible that they are each affecting the other. CO2 might be adding a bit of warming or cooling to the changes of whatever’s driving the variations seen in Figure 2. Unfortunately, there’s no way to calculate that.
What else can we learn from the Vostok data? Folks keep talking about the speed of the current warming. Their claim is that the world can’t evolve or acclimatize fast enough to encomass the current rate of warming.
However, the Vostok data shows other times in the Holocene that it’s warmed (or cooled) that fast.
Figure 4. Warming rates in the Holocene, from the Vostok ice core data.
Finally, here’s a look at the ice core data overlaid with the modern changes in both CO2 and temperature.
Figure 5. Temperatures and CO2 levels. As in Figure 3, but with both ice core and modern observational data shown.
Hmmm, sez I, once again …
So that’s what I learned from the Vostok data—that humans have been through warmer periods many times in the past without them being an “existential crisis”, that oceanic outgassing isn’t the cause of the modern CO2 increase, and the speed of modern warming is far from unprecedented.
A rare day of soothing May rain here in California. At the end of last year, all the climate models and climatologists were predicting another very dry year … instead, it’s been one of the wetter years in history. The world’s best prognosticators were not just a little wrong. They were 100%, top to bottom and side to side wrong.
And these are the same models and folks who claim they can tell us what the average global temperature will be in 2100AD … yeah, that’s totally legit.
My best to all,
w.
PS—When you comment, please quote the exact words you’re referring to. This avoids many misunderstandings.
Another avoidable green fiasco in the name of climate obsession. – – – Millions of pounds are being spent carpeting thousands of acres of land with conifers on the basis they will lock up CO2 from the atmosphere.
But a new report shows that many of the forests springing up around the country likely add to the risk of climate change, says the Sunday Post.
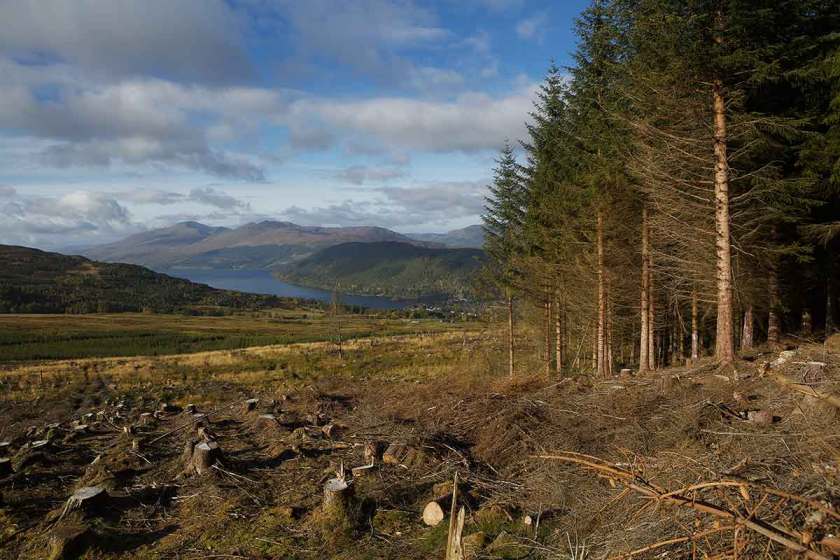
Scotland’s damp climate means peatland must be drained to prepare the planting of saplings. Excess water is flushed away using networks of ditches. When the peatland is disturbed, CO2 escapes into environment, turning local rivers acidic
Vast tracts of peaty soil are being dug up and drained in order to plant trees, unleashing a torrent of stored carbon [dioxide] into the environment.
The paper – published in the journal Land Use Policy – states: “We have been planting the wrong type of forests, in the wrong place, and using the wrong techniques. The industry promotes conifer forests as carbon positive; yet many plantations are emitting carbon.”
The author, Castle Douglas-based silviculture consultant Mary-Ann Smyt, warns: “Most of Scotland’s forestry has been (and is still being) planted on organic, peaty soils. The problem is acute in south-west Scotland, where afforested headwaters contain high levels of organic carbon and lethal spikes of acidity.
“If we want woodlands to lock up carbon for centuries, we need to move away from draining and disturbing peaty soils to suit plantations.”
The John Muir Trust conservation charity backed the research’s findings. Senior policy officer Rosie Simpson said: “We’re not confident about the long-term carbon savings of commercial plantations on peatlands.
“In the 1980s, we saw plantations in the Flow Country (in Caithness and Sutherland) driven by tax incentives. They are now widely acknowledged as having been environmentally destructive and are being converted back to peatland habitats.
“Our concern now is that we might be repeating past mistakes – except this time the driver is carbon-offsetting rather than tax-saving.” . . . The latest report highlights research from last year that showed trees grown in 30cm of peat would be unlikely to recoup the emissions created. Meanwhile, trees grown in 20cm of peat might take 15 years to break even.
And the report says the rules neither prevent further damage to existing sites caused by restocking nor properly account for emissions from ditches.
It concludes: “The net effect of plantations on peaty soils is that many forests are emitting more greenhouse gases than they sequester; they are not carbon-beneficial.
“This paper asks that investors and policy-makers recognise the damage being done…and suggests that the incentives driving these changes are corrected in order to favour a better kind of forest.”
The Scottish Conservatives called for a review of subsidies.
Shadow Net Zero Secretary Liam Kerr said: “The Scottish Government routinely attempts to force through so-called environmental measures without listening to the experts, from the shambolic Deposit Return Scheme to controversial fishing bans. We cannot afford tree-planting to become another failed green objective.”
Last year, an Aberdeen University study found that building wind turbines on peatland had released 4.9 million tons of greenhouse gases into the atmosphere. It will take some windfarms more than a decade of producing electricity to make good on the damage they have caused.
“Electric natural gas compressors contributed to the near collapse of the Texas power grid in 2021,” Ed Ireland argues below. “All U.S. power grids face the same risk.”
Ed Note: “Electric natural gas compressors contributed to the near collapse of the Texas power grid in 2021,” Ed Ireland argues below. “All U.S. power grids face the same risk.” His first-hand knowledge of this instance of ‘deep decarbonization’ politics gets to the why-behind-the-why of the still-debated Texas blackout, the worst electricity debacle in the history of the industry.
“The anti-fossil fuel movement started pressuring North Texas cities and towns to require electric compressors on natural gas pipelines based on arguments that the air pollution from natural gas-powered compressors was causing increased asthma and other health problems…. I said that electrifying natural gas pipeline compressors was a terrible idea that could affect the availability of natural gas when it was needed most, such as during bad weather events. Unfortunately, I lost that debate….”
The study, which the authors say is the first rigorous effort to identify the number of U.S. electric compressor stations, examined data from 2008 to 2020 and found that:
During times of high gas demand, electric outages that disable compressors at these stations can significantly reduce gas available to downstream generating stations. In some cases, the resulting outages could be as large as or larger than the most severe single-cause failure currently considered in electric reliability planning (emphasis added).
Of these outages, they determined that several areas of the country were especially vulnerable to electric outages:
California, the Midwest, the Gulf Coast, and the East have high levels of installed electric compressor capacity. New hydraulic models, verified by past events, show that disrupting power to a single pipeline compressor station can force a loss greater than 2 gigawatts of downstream gas generators (emphasis added).
It is not generally known that natural gas pipelines have, little by little and under the radar, become increasingly dependent on electricity. Recall the parable of a frog in a pot of water that is gradually heated to boiling, but the frog overlooks the danger until it is too late. This describes the electrification of natural gas pipelines that occurred so slowly that it was virtually unnoticed.
The electrification of gas pipelines occurred as the compressors, which are required to keep the gas moving through pipelines, were changed from natural gas to electricity. Compressors are necessary to keep the natural gas moving through the pipeline network. The average distance between compressor stations in interstate pipelines in the U.S. varies, but compressors are usually required every 50 to 100 miles. If any of these compressors fail, the entire pipeline shuts down completely.
Based on their findings, the authors suggest that electric utilities immediately incorporate the identified facilities into critical facilities lists. The authors’ findings support the recommendations of a recent study by the National Academies of Sciences, Engineering, and Medicine:
In contrast to well-established reliability reporting and standards for the electrical system, the gas system has almost no reliability transparency or oversight.” Establishing a federal gas reliability organization, comparable to what is now done for electric power, could improve gas reliability by establishing appropriate reliability reporting, incident investigation, and minimum industry standards.
Background
From the beginning of natural gas pipelines, compressors were powered by natural gas. That made sense because the pipelines were full of natural gas, so pipelines powered themselves. But gradually, compressors were electrified so slowly that, to follow the parable, they, like the frog, didn’t notice what was about to happen.
I observed the early phase of the movement to replace natural gas-fired compressors with electric gas compressors starting around 2010 when I was Executive Director of the Barnett Shale Energy Education Council, headquartered in Fort Worth, Texas. As the Barnett Shale developed in the early 2000s, thousands of natural gas wells were drilled, many in urban areas, and pipelines and compressor stations were constructed to carry the natural gas to markets.
The anti-fossil fuel movement started pressuring North Texas cities and towns to require electric compressors on natural gas pipelines based on arguments that the air pollution from natural gas-powered compressors was causing increased asthma and other health problems. In 2012, the Denton City Council invited me to participate in their project to rewrite city ordinances that regulate natural gas drilling and pipelines.
I distinctly recall a public meeting in which I said that electrifying natural gas pipeline compressors was a terrible idea that could affect the availability of natural gas when it was needed most, such as during bad weather events. Unfortunately, I lost that debate, and the City of Denton changed its city ordinances to require electric natural gas compressors within its city limits. Similar ordinances quickly spread to other municipalities within the state of Texas and eventually to other natural gas-producing states that pipelines pass through.
As shown in the map above, the use of electric compressors on gas pipelines has now become so pervasive that the entire interstate natural gas pipeline network is effectively compromised. An interruption in the generation of electricity can cause some natural gas pipelines to shut down, which interrupts other parts of the natural gas pipeline grid and potentially shuts down multiple pipelines.
Here’s what happened. The entire state of Texas was hit by Winter Storm Uri, which resulted in all 254 counties in the state experiencing below-freezing temperatures, with much of the state temperatures in the teens and below zero in some areas for almost an entire week. Freezing temperatures affected all forms of electrical generation, starting with frozen wind turbines, freeze-offs at natural gas wells, and even problems with coal-fired generators and nuclear power generation plants.
As the temperatures dropped and people turned up their heat, the demand for electricity exceeded the supply, and rolling blackouts were ordered to maintain the integrity of the electrical grid. The grid operator, ERCOT, ordered rolling blackouts to balance supply and demand. Unfortunately, some local electricity companies did not have good information on the location of natural gas wells and compressor stations, so some blackouts shut down natural gas wells and pipeline compressors. In turn, this reduced the natural gas supply to gas-fired power generators. This caused a death spiral in electricity generation to the point where the Texas grid was within 4 minutes and 37 seconds of completely collapsing.
After Winter Storm Uri, ERCOT and the Texas Railroad Commission (RRC) recognized that they did not have good data on the location of critical natural gas pipeline infrastructure, including natural gas wells with on-site compressors and the location of all natural gas pipeline compressors that operate on electricity, in addition to the critical customers that depend on electricity to maintain their supply of natural gas.
The RRC highlighted the importance of this information by establishing a new department, the Critical Infrastructure Division, which maintains up-to-date data on all infrastructure required to maintain natural gas supplies to power generators. The RRC published new rules that require gas pipeline operators to provide that information and keep it updated on an ongoing basis.
While Winter Storm Uri caused the Texas power grid problems in 2021, such problems can be caused by the destabilizing impact of wind and solar on power grids, for example. If a sudden decline of wind and solar results in disruptions of electricity, natural gas pipelines can be shut down, which causes a domino effect of more power outages. With more power grids sounding alarms about the instabilities caused by wind and solar, power grids are increasingly facing blackouts and the resulting shut-downs of natural gas pipelines that, in turn, can cause a loss of electric generating capacity.
Where do we go from here?
U.S. power grids have been warning that they are destabilized by wind and solar power generation. Add to that the potential problems they may face as a result of the electrification of natural gas compressors, and the tenuous situation becomes clear.
More power grid operators need to consider their own versions of the rules that ERCOT and the Texas Railroad Commission are implementing.
—————
Ed Ireland, adjunct professor at TCU’s Neeley School of Business, received his B.S. from Midwestern State University and Ph.D. from Texas Tech University. This analysis was originally posted at Thoughts About Energy and Economics (free subscription).
The Biden administration released new emissions control standards for vehicles. Billed as the “most ambitious climate regulations” ever, they have captured headlines, but technical realities and high costs have both rules headed straight for a brick wall.
The Biden administration released new emissions control standards for vehicles. Billed as the “most ambitious climate regulations” ever, they have captured headlines, but technical realities and high costs have both rules headed straight for a brick wall.
The light-duty category covers cars, trucks, and vans, and requires 67% of all new car sales to be electric by 2032. The heavy-duty category covers 18-wheelers, buses, and other work-related vehicles and requires half of new buses and a quarter of new truck sales to be electric by 2032. For comparison, last year, electric vehicle sales made up 5.8% of new car sales and less than 2% for heavier trucks. These proposed standards are not ambitious but rather represent a new level of regulatory lunacy.
The Clean Air Act (CAA) requires the EPA administrator to set vehicle regulations aimed at reducing pollutants from light-duty vehicles that negatively impact public health and the environment. In setting these standards, the administrator must take into consideration the feasibility of new technologies as well as costs. Team Biden promised as much when they committed to establishing a “data-driven” goal. But it’s hard to see how any serious expert would support the notion that, in less than five years, when car companies will begin designing the model year 2032 vehicles, they can develop enough electric vehicles, procure the massive amount of critical minerals needed for the batteries, and convince skeptical consumers to massively shift their purchasing priorities to meet this goal.
Despite numerous federally sponsored incentives, electric vehicle adoption rates remain low for a variety of reasons. Even with major advancements in EV technology, recharging batteries still takes hours, while filling up gas tanks takes minutes. Coupled with a limited network of charging stations, EVs continue to be a hard sell. Even the majority of current EV owners still rely on gas-powered vehicles—78% own a second gas-powered car to supplement their transportation needs.
Future demand isn’t there either. A new AP-NORC poll found only 19% of Americans are “very likely or extremely likely” to go electric. Gallup similarly poured water on the enthusiasm claim, suggesting Americans are “slow to adopt electric vehicles.” More troubling for EV backers: Even if this push was possible, the U.S. Energy Information Administration (EIA) forecasted just 9% of U.S. vehicles would be electric by 2050.
The administration displays tone deafness by touting expensive alternatives to reliable gas-powered cars. Many Americans are struggling to afford eggs and meat in the inflationary economy. It’s highly unlikely lower and middle-income folks are planning to purchase a car with an average cost of $54,000. The availability of taxpayer subsidies doesn’t change that equation. To date, most EV drivers are in households that make at least $150,000 per year or more. In states like Mississippi, where the median income is around $50,000, EVs are cost-prohibitive and regulations like the proposed Biden standards will only make those costs go up.
One of the nation’s leading auto manufacturing groups called the proposal “aggressive” and “unprecedented” even for them—suggesting the administration is going too far too fast. Their statements should be heavily considered given the industry has already invested billions to expand vehicle electrification. Although the industry has adopted the transition narrative, they are rightfully concerned with the expedited timeline and unrealistic expectations in the current proposal.
Despite serious technical hurdles and overwhelming preference by consumers for gas-powered vehicles, Team Biden seems done with the carrot approach and is using a regulatory stick to force its all-EV future on Americans. The courts may once again be the saving grace.
Critics have an opportunity to present legal arguments against the EPA. The biggest legal elephant in the room is the West Virginia v. EPA decision that invoked the “major questions” doctrine. Specifically, the Supreme Court made clear that agencies must point to “clear Congressional authorization” if they take actions of “vast economic or political significance.” One can argue in this instance that the EPA does not have the ability to restructure the entire transportation industry in the same way the agency did not have the ability to redesign entire energy markets in the West Virginia case.
The current rules, as proposed, have numerous technical and legal vulnerabilities. They also stand to undermine environmental progress as Americans will undoubtedly settle on driving older cars longer instead of amassing serious debt to acquire a new, less reliable car. As a result, the reach of new technologies and the affiliated benefits such as reduced pollution and safer roads will fail to materialize.
Mandy Gunasekara is the director of Independent Women’s Forum’s Center for Energy and Conservation and previously served as Chief-of-Staff at the U.S. EPA. Follow her on Twitter at @MississippiMG
This research suggests natural climate variation in Antarctica has a much wider range than expected. – – – The West Antarctic Ice Sheet is melting rapidly, claims EurekAlert, raising concerns it could cross a tipping point of irreversible retreat in the next few decades if global temperatures rise 1.5 to 2.0 degrees Celsius (2.7 to 3.8 degrees Fahrenheit) above pre-industrial levels.
New research finds that 6,000 years ago, the grounded edge of the ice sheet may have been as far as 250 kilometers (160 miles) inland from its current location, suggesting the ice retreated deep into the continent after the end of the last ice age and re-advanced before modern retreat began.
“In the last few thousand years before we started watching, ice in some parts of Antarctica retreated and re-advanced over a much larger area than we previously appreciated,” said Ryan Venturelli, a paleoglaciologist at Colorado School of Mines and lead author of the new study. “The ongoing retreat of Thwaites Glacier is much faster than we’ve ever seen before, but in the geologic record, we see the ice can recover.”
The study appears in AGU Advances, which publishes high-impact, open-access research and commentary across the Earth and space sciences. It presents the first geologic constraint for the ice sheet’s location and movement since the last ice age.
The grounding line is where a glacier or ice sheet leaves solid ground and begins to float on water as an ice shelf. Today, the Ross Ice Shelf extends hundreds of miles over the ocean from the grounding line of the West Antarctic Ice Sheet. Because ocean water washes up against the leading edge of the ice, the grounding line can be a zone of rapid melting.
“The concern of grounded ice loss is because the loss of ice on land is what contributes to sea level rise,” Venturelli said. “As grounding lines retreat farther inland, the more vulnerable the ice sheet becomes as it exposes thicker and thicker ice to the warming ocean.”
During the Last Glacial Maximum, about 20,000 years ago, the West Antarctic Ice Sheet was so large that it was grounded on the ocean floor, beyond the edge of the continent. Previous observations generally indicate a steady retreat since then, accelerated in the last century by human-caused climate change. [Talkshop comment – unsupported assertion]. . . . The new evidence of Antarctic ice’s ability to make a comeback was welcome news for Venturelli.
“It can be a bummer sometimes, studying ice loss in Antarctica,” Venturelli said. “Although the re-advance identified in the geologic record happens over thousands of years, I like to think of studying the process of reversibility as a little shred of hope.”
The next big question for Venturelli and her coauthors is assessing what conditions enabled the ice’s re-advance.
One possibility is the rebound after release from the massive weight of the ice sheet lifted the land enough to hold back the ocean and allow the ice to regrow. Another possibility is that slight changes in climate enabled the ice sheet to switch from retreat to advance.
It could have been a combination of these influences.
If Impact Assessments relating to UK legislation are to mean anything, then some years after the passage of the legislation in question, Ministers should be charged with considering the impact of the legislation in terms of its Impact Assessment.
One thing leads to another. Robin Guenier’s article How To Destroy The Claim That The West Must Cut CO2 Emissions has led to quite a discussion, and in one of the comments under the line, Robin mentioned an article on The Conversation website. This led Jit to write What About Whataboutism?, and in a comment on that article, Robin mentioned part of the Climate Change Act 2008 Impact Assessment. The reference seems to me to be far too significant to be limited to a comment on an article, and in fact it merits much more detailed consideration, so profoundly fundamental is it to the whole “Net Zero project”.
The Impact Assessment runs to 126 pages, and is too large to analyse in detail here. For instance, the claims made (based largely on the Stern Review) that the costs of inaction exceed the costs of action (viz-a-viz emissions reductions) are highly debatable, both in terms of the economic assumptions made, and when considering that the UK’s action has, by and large, not been replicated elsewhere in the world, so that the benefits of climate change mitigation have not been seen at all. In other words, we have borne the costs, but not seen the alleged benefits.
The key section for current purposes, however, appears early, on page 7:
It should be noted that the benefits of reduced carbon emissions have been valued using the social cost of carbon which estimates the avoided global damages from reduced UK emissions. The benefits of UK action will be distributed across the globe. In the case where the UK acts in concert with other countries then the UK will benefit from other nations reduced emissions and would be expected to experience a large net benefit. Where the UK acts alone, though there would be a net benefit for the world as a whole the UK would bear all the cost of the action and would not experience any benefit from reciprocal reductions elsewhere. The economic case for the UK continuing to act alone where global action cannot be achieved would be weak.
The last two sentences are crucial. What does “global action” mean in this context? I would say it means “actions, not words”, and while there have been words a-plenty, there have to date been few meaningful deeds globally in connection with reducing greenhouse gas emissions.
EDGAR Database
EDGAR stands for “Emissions Database for Global Atmospheric Research”. As it says on its website:
EDGAR is a multipurpose, independent, global database of anthropogenic emissions of greenhouse gases and air pollution on Earth. EDGAR provides independent emission estimates compared to what reported [sic] by European Member States or by Parties under the United Nations Framework Convention on Climate Change (UNFCCC), using international statistics and a consistent IPCC methodology.
Where better to look to see whether “reciprocal reductions” in greenhouse gas emissions have been achieved and therefore whether the economic case for the UK continuing to act, under the Climate Change Act, is weak or strong? The table of emissions isn’t perfect for current purposes, as it doesn’t enable us to compare 2008 (or 2009, given that the Act received Royal Assent only on 26th November 2008) emissions globally with those of 2023 or even 2022. The best we can do is compare 2005 to 2021, but that, I would suggest, is broadly adequate when considering the key point from the Impact Assessment.
Measurements are in Megatonnes of CO2. The start date in each case is 2005 and the end date is 2021:
United Kingdom: 562.09, declining to 335.36, a reduction of 40.33%.
Global emissions: 30,161.57, rising to 37,857.58, an increase of 25.51%.
China: 6,338.44, rising to 12,466.32, an increase of 96.67%.
India: 1,215.21, rising to 2,648.78, an increase of 117.96%.
Indonesia: 361.45, rising to 602.59, an increase of 66.71%.
South Korea: 516.53, rising to 626.8, an increase of 21.34%.
Russia: 1,735.03, rising to 1,942.54, an increase of 11.96%.
Pakistan: 132.46, rising to 219.79, an increase of 65.92%.
Bangladesh: 39.94, rising to 106.87, an increase of 167.57%.
The vast majority of countries, especially in the developing world, register increases, many substantial, some huge (running to several hundred percent). Of all the countries listed by EDGAR, the only ones of any size, with more than miniscule emissions, to show a decrease in emissions during the period 2005 to 2021 are the UK, the EU27 (a reduction of 24.18%), Australia (a 4.78% reduction, and its coal exports don’t count in its emissions total), Canada (a reduction of 2.5%), Japan (a reduction of 15.65%, and its emissions still represent 2.87% of the global total, compared to the UK’s 0.89%), Ukraine (a reduction of 47.49%) and the United States (a reduction of 20.14%). Thus it can be seen that of the world’s countries with emissions beyond insignificant levels in global terms, only Ukraine has made a greater proportionate reduction than the UK. The EU has managed a little over half as much in percentage terms, the USA has managed slightly half as much in those terms, and Japan has achieved even less, while the reductions achieved by Australia and Canada are extremely modest. In short, the rest of the world (with the exception of poor benighted Ukraine) isn’t following the UK’s “lead”.
If the EDGAR data, being based on changes in emissions between 2005 and 2021 is considered inappropriate, then the International Energy Agency must surely be considered a reliable authority by those who would defend the Climate Change Act – after all, they usually treat its pronouncements as Holy Writ. Well, the headline to its “Global Energy Review:CO2 Emissions in 2021” is “Global emissions rebound sharply to highest ever level”. It points out that the covid-induced reduction in economic activity, with consequent falls in greenhouse gas emissions in 2020, was more than reversed in 2021. Presumably emissions continued to rise in 2022, but we must wait a little longer for those figures. Not only did emissions generally reach an all-time high in 2021 but so, the IEA tells us, did emissions from coal, and emissions from the world’s power plants reached their highest ever level – driven by the biggest ever increase in year on year electricity demand: an increase which was more than 15 times larger than the drop in demand in 2020.
Let’s remind ourselves of the words of the Impact Assessment for the UK’s Climate Change Act:
The economic case for the UK continuing to act alone where global action cannot be achieved would be weak.
Unanswered Questions
What is the point of an Impact Assessment relating to legislation if nobody ever re-visits it some years later to assess the actual impact against what was envisaged when the legislation was passed?
Why was the net zero target introduced by Teresa May’s government without any apparent reference to the Impact Assessment?
Why did the Scottish Government legislate for an earlier (2045) net zero date? Did nobody involved in that decision read the Impact Assessment relating to the UK Climate Change Act?
Why did Chris Skidmore’s recent Net Zero Review not reference the Act’s Impact Assessment?
Conclusion
If Impact Assessments relating to UK legislation are to mean anything, then some years after the passage of the legislation in question, Ministers should be charged with considering the impact of the legislation in terms of its Impact Assessment. If anyone bothered to do so in the case of the Climate Change Act 2008 they would realise that the Act has not led to the rest of the world following the UK’s example. Consequently, the economic case for the UK continuing to act alone where global action has not been achieved is weak. It’s time to repeal the Act.




You must be logged in to post a comment.