Global warming, climate change, all these things are just a dream come true for politicians. I deal with evidence and not with frightening computer models because the seeker after truth does not put his faith in any consensus. The road to the truth is long and hard, but this is the road we must follow. People who describe the unprecedented comfort and ease of modern life as a climate disaster, in my opinion have no idea what a real problem is.
COP28, the climate change conference taking place in Dubai this year, is asking brands for millions of pounds to sponsor the event, promising that they will “benefit from access and unrivalled networking opportunities with governments and global business leaders”.
COP28, the climate change conference taking place in Dubai this year, is asking brands for millions of pounds to sponsor the event, promising that they will “benefit from access and unrivalled networking opportunities with governments and global business leaders”.
The most expensive sponsorship package on offer costs £6.5m and provides the paying company with a “speaking opportunity in the COP28 UAE presidency events” and “partner recognition on the trophy wall” among other benefits, according to documents seen by Sky News.
In total, the climate conference is asking for in excess of £25m from companies to take advantage of its sponsorship packages, the documents show.
A senior corporate executive told Sky News: “A COP isn’t an event to make money. We are here to save the planet and minimise climate change, not to milk sponsorship opportunities.
“It belittles the entire event and people lose trust in the entire process.”
Sponsorship prices have almost tripled since COP27 in Sharm El-Sheikh last year, according to the executive, who has direct knowledge of the rates, reflecting the increasing commercialisation of the United Nations summit.
Every year, almost 200 countries meet to discuss how to jointly tackle the climate crisis and its impacts. Thousands of observers, civil society groups and media attend too.
COP stands for Conference of the Parties, referring to governments that have signed the United Nations Framework Convention on Climate Change (UNFCCC).
Sponsors at last year’s event included Microsoft and Coca-Cola, the company named the world’s largest plastics polluter in the 2022 Break Free From Plastic’s global brand audit.
Sky sponsored COP26 in Glasgow in 2021.
Executives given chance to mingle with government officials
A petition calling on the organisers of the climate summit to stop seeking corporate sponsorship received nearly a quarter of a million signatures.
Brands which spent more than £3m on sponsorship at this year’s event will also receive accreditation for their executives to attend the talks and mingle with government officials.
The so-called Industry Partner package, which offers companies “an unparalleled opportunity to become a vital part of this important event for leading names in respective industries” and costs £3.2m, comes with five passes to the event.
Meanwhile, the Principal Partner package, which costs more than £6m, offers 25 UN-accredited passes for company executives to attend the talks.
The organisers of COP28 promise that the event’s principal sponsor will receive “privileged access” to the Blue Zone, the area reserved for world leaders, country negotiators, and NGOs (non-governmental organisations).
Also on offer is the chance to host a reception and an event, a perk not available to any of the lower tier sponsors.
Brands which partner with the event will also have the opportunity to display “presentations and activities featuring accomplishments across all areas of business” while “participants will be inspired to act on environmental issues that are increasingly impacting us today”.
They will also “receive an array of benefits that showcase their market presence,” according to the documents.
When contacted by Sky News, the UN said sponsorship for COP28 was handled by the host country and directed press questions to the UAE.
“The Administration’s efforts at achieving a goal of ‘net zero’ is foolish,” Rucker argued, “because it is based on a flawed premise, it’s not going to work, and there are better alternatives.”
The National Coal Transportation Association invited CFACT President Craig Rucker to address their annual meeting in Scottsdale, Arizona last week. During his speech, Rucker took aim at the Biden Administration’s “all of government” approach to tackling climate change and for directing the nation toward a reckless “net zero” emissions goal by 2050.
“The Administration’s efforts at achieving a goal of ‘net zero’ is foolish,” Rucker argued, “because it is based on a flawed premise, it’s not going to work, and there are better alternatives.”
CFACT’s president went on to explain that what’s driving Biden’s push to dismantle our nation’s energy structure is based on overhyped fears of an impending, climate Armageddon. “No such crisis exists,” Rucker maintained. To bolster his argument, he showcased numerous facts that refuted common perceptions of increased hurricane activity and heat waves, as well as hype surrounding polar bears, rapid sea level rise, and runaway temperatures.
Rucker then took aim at the core of net zero agenda — the reliance on renewable energy from the sun and wind as a replacement for fossil fuels.
“These sources of energy are not only intermittent and expensive, but they also are hardly ‘green’ in nature,” he said. “In fact, they are fabricated from minerals mined in parts of the world with terrible environmental standards, are toxic in nature, and pose a clear and present threat to endangered species such as whales and eagles.”
He concluded his 45-minute speech to a crowd of roughly 70 energy professionals by noting that the fight to preserve our energy infrastructure is being spearheaded by citizens and state legislators. He pointed to the recently passed “Energy Security Bill” in Utah, as well as the backlash by citizens to offshore wind because of its impact on endangered Right whales in New Jersey.
The post below updates the UAH record of air temperatures over land and ocean. Each month and year exposes again the growing disconnect between the real world and the Zero Carbon zealots. It is as though the anti-hydrocarbon band wagon hopes to drown out the data contradicting their justification for the Great Energy Transition.
As an overview consider how recent rapid cooling completely overcame the warming from the last 3 El Ninos (1998, 2010 and 2016). The UAH record shows that the effects of the last one were gone as of April 2021, again in November 2021, and in February and June 2022 Now at year end 2022 and continuing into 2023 global temp anomaly is matching or lower than average since 1995, an ENSO neutral year. (UAH baseline is now 1991-2020).
For reference I added an overlay of CO2 annual concentrations as measured at Mauna Loa. While temperatures fluctuated up and down ending flat, CO2 went up steadily by ~60 ppm, a 15% increase.
Furthermore, going back to previous warmings prior to the satellite record shows that the entire rise of 0.8C since 1947 is due to oceanic, not human activity.
The animation is an update of a previous analysis from Dr. Murry Salby. These graphs use Hadcrut4 and include the 2016 El Nino warming event. The exhibit shows since 1947 GMT warmed by 0.8 C, from 13.9 to 14.7, as estimated by Hadcrut4. This resulted from three natural warming events involving ocean cycles. The most recent rise 2013-16 lifted temperatures by 0.2C. Previously the 1997-98 El Nino produced a plateau increase of 0.4C. Before that, a rise from 1977-81 added 0.2C to start the warming since 1947.
Importantly, the theory of human-caused global warming asserts that increasing CO2 in the atmosphere changes the baseline and causes systemic warming in our climate. On the contrary, all of the warming since 1947 was episodic, coming from three brief events associated with oceanic cycles.
Update August 3, 2021
Chris Schoeneveld has produced a similar graph to the animation above, with a temperature series combining HadCRUT4 and UAH6. H/T WUWT
April 2023 Update Land and Sea Temps Little Changed
With apologies to Paul Revere, this post is on the lookout for cooler weather with an eye on both the Land and the Sea. While you will hear a lot about 2020-21 temperatures matching 2016 as the highest ever, that spin ignores how fast the cooling set in. The UAH data analyzed below shows that warming from the last El Nino was fully dissipated with chilly temperatures in all regions. After a warming blip in 2022, land and ocean temps dropped again with 2023 starting below the mean since 1995.
UAH has updated their tlt (temperatures in lower troposphere) dataset for April 2023. Posts on their reading of ocean air temps this month came later the same day as updated records from HadSST4. I just posted on SSTs using HadSST4 El Nino Comes to Save Global Warming April 2023. This month also has a separate graph of land air temps because the comparisons and contrasts are interesting as we contemplate possible cooling in coming months and years. Sometimes air temps over land diverge from ocean air changes. For example in February, Tropical ocean temps alone moved upward, while temps in all land regions rebounded after hitting bottom. In April, as shown later on, ocean air warmed slightly, while NH land air cooled sharply, leaving the overall Global anomally little changed.
Note: UAH has shifted their baseline from 1981-2010 to 1991-2020 beginning with January 2021. In the charts below, the trends and fluctuations remain the same but the anomaly values change with the baseline reference shift.
Presently sea surface temperatures (SST) are the best available indicator of heat content gained or lost from earth’s climate system. Enthalpy is the thermodynamic term for total heat content in a system, and humidity differences in air parcels affect enthalpy. Measuring water temperature directly avoids distorted impressions from air measurements. In addition, ocean covers 71% of the planet surface and thus dominates surface temperature estimates. Eventually we will likely have reliable means of recording water temperatures at depth.
Recently, Dr. Ole Humlum reported from his research that air temperatures lag 2-3 months behind changes in SST. Thus the cooling oceans now portend cooling land air temperatures to follow. He also observed that changes in CO2 atmospheric concentrations lag behind SST by 11-12 months. This latter point is addressed in a previous post Who to Blame for Rising CO2?
After a change in priorities, updates are now exclusive to HadSST4. For comparison we can also look at lower troposphere temperatures (TLT) from UAHv6 which are now posted for March. The temperature record is derived from microwave sounding units (MSU) on board satellites like the one pictured above. Recently there was a change in UAH processing of satellite drift corrections, including dropping one platform which can no longer be corrected. The graphs below are taken from the revised and current dataset.
The UAH dataset includes temperature results for air above the oceans, and thus should be most comparable to the SSTs. There is the additional feature that ocean air temps avoid Urban Heat Islands (UHI). The graph below shows monthly anomalies for ocean air temps since January 2015.
Note 2020 was warmed mainly by a spike in February in all regions, and secondarily by an October spike in NH alone. In 2021, SH and the Tropics both pulled the Global anomaly down to a new low in April. Then SH and Tropics upward spikes, along with NH warming brought Global temps to a peak in October. That warmth was gone as November 2021 ocean temps plummeted everywhere. After an upward bump 01/2022 temps reversed and plunged downward in June. After an upward spike in July, ocean air everywhere cooled in August and also in September. After sharp cooling everywhere in January 2023, all regions were into negative territory. Now in February, March and April, a sharp rise in the Tropics with upticks elsewhere led to a rise globally slightly above zero. Unusually April SH, NH and Global anomalies were all the same 0.17C.
Land Air Temperatures Tracking Downward in Seesaw Pattern
We sometimes overlook that in climate temperature records, while the oceans are measured directly with SSTs, land temps are measured only indirectly. The land temperature records at surface stations sample air temps at 2 meters above ground. UAH gives tlt anomalies for air over land separately from ocean air temps. The graph updated for April is below.
Here we have fresh evidence of the greater volatility of the Land temperatures, along with extraordinary departures by SH land. Land temps are dominated by NH with a 2021 spike in January, then dropping before rising in the summer to peak in October 2021. As with the ocean air temps, all that was erased in November with a sharp cooling everywhere. After a summer 2022 NH spike, land temps dropped everywhere, and in January, further cooling in SH and Tropics offset by an uptick in NH.
Remarkably, in 2023, SH land air anomaly shot up 1.2C, from -0.56C in January to +0.67 in April. Land air in the Tropics also rose, but NH land air dropped from +0.48C down to 0C. Due to NH having twice the land surface as SH, the Global land anomaly was pulled down.
The Bigger Picture UAH Global Since 1980
The chart shows monthly Global anomalies starting 01/1980 to present. The average monthly anomaly is -0.06, for this period of more than four decades. The graph shows the 1998 El Nino after which the mean resumed, and again after the smaller 2010 event. The 2016 El Nino matched 1998 peak and in addition NH after effects lasted longer, followed by the NH warming 2019-20. An upward bump in 2021 was reversed with temps having returned close to the mean as of 2/2022. March and April brought warmer Global temps, later reversed, and with the sharp drops in Nov., Dec. and January 2023 temps, there was no increase over 1980. Now in 2023 February-April there is a slight rebound over zero.
TLTs include mixing above the oceans and probably some influence from nearby more volatile land temps. Clearly NH and Global land temps have been dropping in a seesaw pattern, nearly 1C lower than the 2016 peak. Since the ocean has 1000 times the heat capacity as the atmosphere, that cooling is a significant driving force. TLT measures started the recent cooling later than SSTs from HadSST3, but are now showing the same pattern. It seems obvious that despite the three El Ninos, their warming has not persisted, and without them it would probably have cooled since 1995. Of course, the future has not yet been written.
Maslin and his fellow climate scientists would like you to think that all of their science is black and white, so how dare we sceptics argue that 2+2 don’t = 4!
The climate crisis is no longer a looming threat – people are now living with the consequences of centuries of greenhouse gas emissions. But there is still everything to fight for. How the world chooses to respond in the coming years will have massive repercussions for generations yet to be born.
In my book How to Save Our Planet, I imagine two different visions of the future. One in which we do very little to address climate change, and one in which we do everything possible.
This is what the science suggests those very different realities could look like.
Year 2100: the nightmare scenario
The 21st century draws to a close without action having been taken to prevent climate change. Global temperatures have risen by over 4°C. In many countries, summer temperatures persistently stay above 40°C. Heatwaves with temperatures as high as 50°C have become common in tropical countries.
Every summer, wildfires rage across every continent except Antarctica, creating plumes of acrid smoke that make breathing outdoors unbearable, causing an annual health crisis.
Maslin and his fellow climate scientists would like you to think that all of their science is black and white, so how dare we sceptics argue that 2+2 don’t = 4!
But this absurd claim of his has nothing to do with science. It is simply unsubstantiated scaremongering. Worse still, he says that we are now living with the consequences of “centuries of greenhouse gas emissions”. Does he seriously believe we are worse off than our ancestors a couple of hundred years ago? Or for that matter, is the world’s climate any worse?
Quite clearly, Mark Maslin is not somebody who should be treated seriously.
It was also Maslin who, in 2019, co-authored a paper claiming that the Little Ice Age was due to European colonisation. According to the BBC:
Colonisation of the Americas at the end of the 15th Century killed so many people, it disturbed Earth’s climate.
That’s the conclusion of scientists from University College London, UK.
The team says the disruption that followed European settlement led to a huge swathe of abandoned agricultural land being reclaimed by fast-growing trees and other vegetation.
This pulled down enough carbon dioxide (CO₂) from the atmosphere to eventually chill the planet.
It’s a cooling period often referred to in the history books as the “Little Ice Age” – a time when winters in Europe would see the Thames in London regularly freeze over.
“The Great Dying of the Indigenous Peoples of the Americas led to the abandonment of enough cleared land that the resulting terrestrial carbon uptake had a detectable impact on both atmospheric CO₂ and global surface air temperatures,” Alexander Koch and colleagues write in their paper published in Quaternary Science Reviews.
For a start, the Little Ice Age did not start in the late 16thC, as the paper implies.
HH Lamb, along with many other climate historians, is quite clear that temperatures began to decline from the High Middle Ages as early as the 13thC. This cooling trend began in the Arctic, but soon spread elsewhere in the 14thC.
Where you demarcate the end of the MWP and the beginning of the LIA is of course academic. But the decline in global temperatures was an ongoing process from the 13thC to the late 17thC, when temperatures appear to have bottomed out. (Following a small amount of warming, temperatures again dropped to low levels in the mid 19thC).
Whatever caused this long term trend of declining temperatures, it certainly was not colonisation that started 300 years later!
This global cooling would be enough to explain the drop in atmospheric CO2 concentrations, without the need for any man-made involvement.
In any event, the authors reckon that this great dying reduced CO2 by a tiny 7 to 10 ppm. This, even by IPCC standards, would be fat too small to have a measurable effect on global temperatures.
According to the paper, their theory only accounts for a cooling of 0.03 to 0.08C during the 1500s and early 1600s, which would not be enough to account for the climatic changes observed during that time.
Lamb reckoned that English temperatures were 1.5C less than the early 20thC during the coldest phase in the 1690s. And the abundant evidence of massive glacial expansion throughout the world indicates that this was not just a local phenomenon.
“The biggest changes are seen along the western edge of Europe, from Portugal up to Southern England. Half the stations recorded floods at least 15 days earlier than previously. A quarter of the stations saw flooding more than 36 days earlier than in 1960.
In these regions, the issue isn’t snow melt – it’s more about saturated soils. Maximum rainfall tends to occur in the autumn and gets stored in the soils. Heavier and earlier rain means that the groundwater reaches capacity earlier.
In southern England, it has been raining more, longer and more intensely than in the past. This has created a rising groundwater table and higher soil moisture than usual and combined with intense rainfall this produces earlier river floods.”
In effect therefore, they are claiming that autumns are now wetter in southern England. But what do the facts say?
Whatever Mr Maslin’s models might say, the actual data shows that there has been no long term change in autumn rainfall trends, merely the usual ups and downs we always see from year to year with English weather.
Why Mr Maslin thinks he should be able to get away with junk science like this, and not be challenged about tells us a lot about the state of climate science.
Glaciers exist today, where no glaciers existed during the Medieval Warm Period from about 800 to 1200AD and during the Holocene Climatic Optimum from about 7500 to 4500BC.
This is the text of my presentation on Tom Nelson’s podcast which can be viewed here. The question and answers start at about 18:15 into the interview.
The first IPCC Physical Science Basis report is called “FAR” and was first published in 1990. An updated 1992 version of the report contains this statement:
“global-mean surface air temperature has increased by 0.3°C to 0.6°C over the last 100 years … The size of this warming is broadly consistent with predictions of climate models, but it is also of the same magnitude as natural climate variability. … The unequivocal detection of the enhanced greenhouse effect from observations is not likely for a decade or more.”(IPCC, 1992, p. 6).
This was an accurate statement at the time, and it is mostly accurate to this day. In the past century (since 1920) temperatures have increased about one degree and I’m not sure we will be able to detect a human enhanced greenhouse effect in ten years, or ever, but otherwise the quote is still accurate. One degree of global warming in a century is well within natural climate variability according to historical records and records of glacier advances and retreats (Vinós, 2022, pp. 89-107).
Glaciers exist today, where no glaciers existed during the Medieval Warm Period from about 800 to 1200AD and during the Holocene Climatic Optimum from about 7500 to 4500BC. In addition, the Vikings farmed parts of Greenland where permafrost exists today. Ötzi, the Tyrolean iceman, who was frozen into a glacier about 5,000 years ago, and only recently discovered in his glacier tomb, can attest to the fact that modern glaciers are more advanced than they were before 3000BC.
The second report, called SAR was published in 1996 and 1997. Chapter 8 was a major issue when it came out because in the original draft, the scientists who wrote it all agreed to include this statement:
“no study to date has both detected a significant climate change and positively attributed all or part of that change to anthropogenic causes.”(Final draft, approved by all 36 authors, SAR, July 1995)
Yet, in the final meeting of the IPCC supervising committee of government politicians, the editors and lead authors of the IPCC on November 29th, 1995, which went very late and into the early morning of November 30th, this statement was changed to read:
“The balance of evidence suggests a discernible human influence on global climate.”(IPCC, 1996, p. 4).
This change was agreed by the lead authors and political representatives of the participating countries, and without consulting the scientists who wrote and approved the final draft months earlier (May, 2020c, pp. 230-235). The change caused an uproar in the scientific community with Frederick Seitz, the 17th president of the United States National Academy of Sciences, writing about it in the Wall Street Journal (1996), under the headline “A Major Deception On Global Warming.”
In the article, Seitz writes:
“In my more than 60 years as a member of the American scientific community, including service as president of both the National Academy of Sciences and the American Physical Society, I have never witnessed a more disturbing corruption of the peer-review process than the events that led to this IPCC report.”Frederick Seitz, the 17th president of the United States National Academy of Sciences
He did not choose the word “corruption” lightly.
The third report “TAR” was published in 2001. It was seriously tarnished by the inclusion and promotion of the notorious “hockey stick” graph that was later shown to be seriously flawed due to major statistical errors and the inclusion of seriously flawed data.
Even so, the IPCC included the following statement that was based on the flawed hockey stick:
“In the light of new evidence and taking into account the remaining uncertainties, most of the observed warming over the last 50 years is likely to have been due to the increase in greenhouse gas concentrations.”(IPCC, 2001, p. 699).
Numerous reports, peer-reviewed articles, most notably by Stephen McIntyre and Ross McKitrick, Edward Wegman, and the U.S. National Research Council, detailed the numerous flaws in the graph (May, 2020c, pp. 164-198). Analysis showed that random red noise could be fed into the statistical algorithm that was used to create the hockey stick and it still produced hockey sticks.
The fourth report “AR4” issued this statement:
“Most of the observed increase in global average temperatures since the mid-20th century is very likely due to the observed increase in anthropogenic greenhouse gas concentrations.”(IPCC, 2007b, p. 10).
This was very much like what was written in TAR where the same conclusion was based on the now discredited hockey stick. AR4 backed away from the hockey stick, admitting it was flawed, but it also claimed that there was a very high chance that the Himalayan glaciers would melt by 2035. This is an impossibility it turned out, and the head of the AR4 effort, Rajendra Pachauri had to back down and apologize for the error.
This and other problems with the report led to a U.N. InterAcademy Council investigation that found that the IPCC guidelines for their reports had not been followed and that serious bias had crept into AR4. They also found that a full range of peer-reviewed views were not included.
AR5, published in 2013, included the following statement:
“More than half of the observed increase in global mean surface temperature (GMST) from 1951 to 2010 is very likely due to the observed anthropogenic increase in greenhouse gas (GHG) concentrations.”(IPCC, 2013, p. 869)”
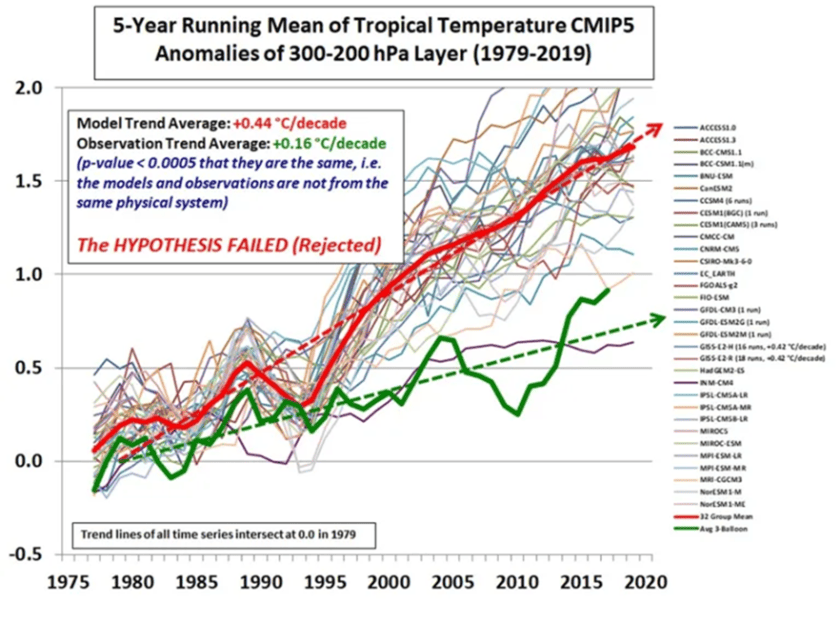
This is very similar to the conclusions of TAR and AR4, but no new evidence is included in the report. Importantly, John Christy, Ross McKitrick, and others had warned the authors of the report that the climate models they were using predicted much more warming in the tropical troposphere than was observed (see figure 1). Still later, Ross McKitrick and John Christy showed that nearly all the AR5 models predicted too much warming at a statistically significant level (McKitrick & Christy, 2018) and this excess warming was dubbed the “hot spot.”
Figure 1. The data is from (McKitrick & Christy, 2018), the plot is from John Christy.
The hot spot still exists in AR6 and has gotten worse (McKitrick & Christy, 2020). It is notable that if the human greenhouse gas emissions are removed from the climate models the fictitious hot spot goes away and the models move much closer to observations.
In AR6 we read the following:
“The likely range of human-induced change in global surface temperature in 2010–2019 relative to 1850–1900 is 0.8°C to 1.3°C, with a central estimate of 1.07°C, encompassing the best estimate of observed warming for that period, which is 1.06°C with a very likely range of [0.88°C to 1.21°C], while the likely range of the change attributable to natural forcing is only –0.1°C to +0.1°C.”(AR6, page 59).
Thus, they now claim that it is likely all the warming since the 19th century is due to humans. And this is despite the fact that in the tropical troposphere their climate models are statistically invalidatedifthey include human greenhouse gas emissions in the model.
They were warned to avoid confirmation bias and that the AR5 models were running too hot.
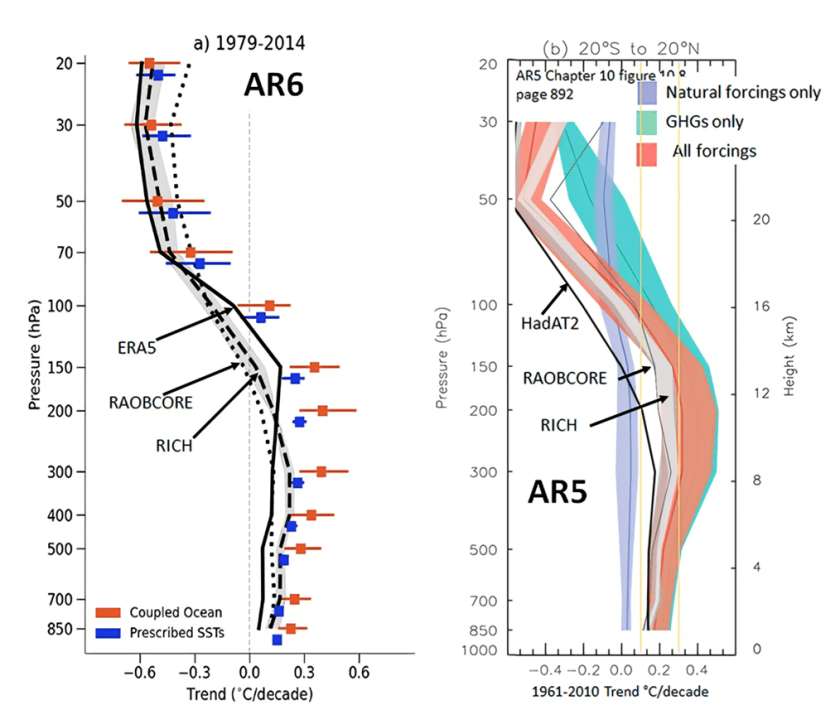
Yet, in AR6, they made the models run even hotter than in AR5 and they ignored dissenting opinions by Richard Lindzen, Roger Pielke Jr., John Christy, Ross McKitrick and many other prominent climate scientists. This is illustrated in figure 2.
Figure 2. The AR6 graph is from AR6, page 444. The AR5 graph is from AR5, page 892. For more on this comparison, go here.
Notice the range of AR5 model results do not touch 0.6, yet in AR6 they do.
In AR6, notice the coupled ocean/atmosphere models (red boxes) produce higher sea surface temperatures than the observed sea surface temperatures (blue boxes). The model/observation mismatch in sea surface temperatures in the Pacific Ocean is a very serious problem.
Besides sea surface temperatures, the IPCC/CMIP climate models have a serious problem with clouds. They cannot model clouds. It is well known and accepted that clouds are net cooling, but how do they respond when surface temperatures rise? What is the net feedback of clouds when the world warms? They don’t know and the uncertainty in the cloud response to warming is nearly as large as the total uncertainty in all modeled surface warming feedbacks.
We find this in AR6 on the subject:
“… CMIP6 models have higher mean ECS and TCR [climate sensitivity to greenhouse gases] values than the CMIP5 generation of 50 models. They also have higher mean values and wider spreads than the assessed best estimates and very likely ranges within this [AR6] Report. These higher ECS and TCR values can, in some models, be traced to changes in extra-tropical cloud feedbacks that have emerged from efforts to reduce biases in these clouds compared to satellite observations (medium confidence). The broader ECS and TCR ranges from CMIP6 also lead the models to project a range of future warming that is wider than the assessed warming range”(AR6, p 927).
Translation: We adjusted our cloud feedback parameters to try and fix the mismatch with the real world and when we did that, the already too-warm models got worse. They are clearly in that stage of their modeling effort that every time they try and fix a mismatch, they break something else. It is a sign that their models are missing some vital component of climate.
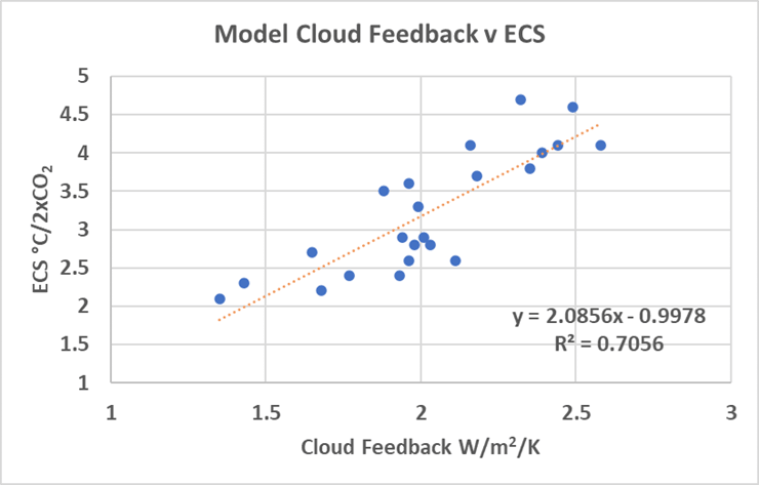
Figure 3 is a plot of model climate feedback to model calculated ECS or equilibrium climate sensitivity to a doubling of CO2 (Ceppi, Brient, Zelinka, & Hartmann, 2017). Remember cloud feedback cannot be modeled, it must be input to the model via user adjustable parameters. The plot tells us that 71% of the model computed ECS is determined by these user input parameters. The models can literally produce almost any ECS the modeler desires.
Figure 3. Modeled cloud feedback to surface temperature versus model calculated ECS (climate sensitivity to a doubling of CO2 or 2xCO2). Data from (Ceppi, Brient, Zelinka, & Hartmann, 2017).
As previously mentioned, the IPCC climate models have a hard time with sea surface temperatures. They not only predict higher sea surface temperatures than observed, they also get the pattern of warming and cooling oceans wrong. It seems they have decided that their models must be correct, so they have assumed that the feedbacks must be changing, and this has screwed them up.
They are fundamentally changing their models such that they cannot be refuted by observations. By hypothesizing a continually changing climate state, they are making their already unfalsifiable ideas even more unfalsifiable. As Karl Marx and his followers found out, if your hypothesis is fluid enough, you can conclude whatever you want, and no one can challenge you. From Karl Popper, 1962, page 37:
“The Marxist theory of history, in spite of the serious efforts of some of its founders and followers, ultimately adopted [a] soothsaying practice. In some of its earlier formulations (for example in Marx’s analysis of the character of the ‘coming social revolution’) their predictions were testable, and in fact falsified. Yet instead of accepting the refutations the followers of Marx re-interpreted both the theory and the evidence in order to make them agree. In this way they rescued the theory from refutation; but they did so at the price of adopting a device which made it irrefutable. They … destroyed its much-advertised claim to scientific status.”(Popper, 1962, p. 37).
So now AR6 claims that as surface temperatures rise, the feedbacks to that warming change. In one fell swoop, they both explain why their models do not match observations and they invalidate those pesky observation-based calculations of climate sensitivity that are so much less than their model-based estimates.
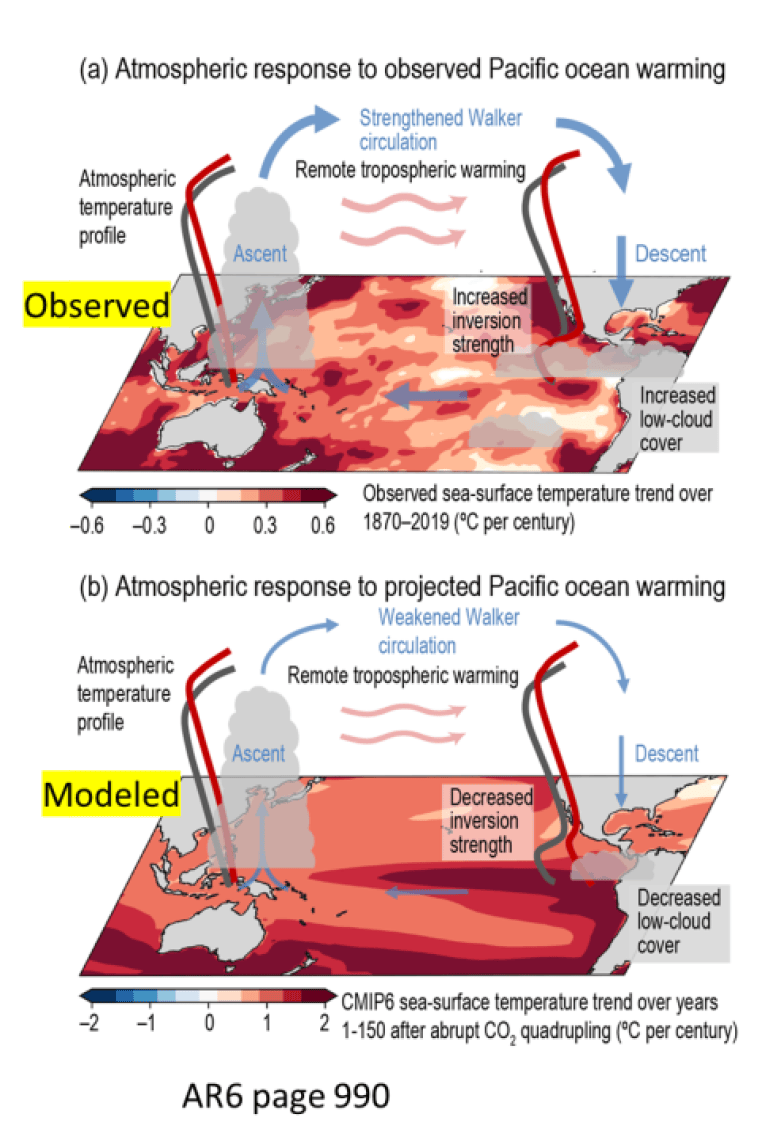
As you can see in the AR6 maps in figure 4, the modeled ocean temperatures are much simpler than the observed pattern. Further, the cloud cover over South America is increasing, not decreasing as predicted. The models expect the eastern Pacific to warm much more than observed and the western Pacific is warming much more than predicted. The pattern is wrong.
Figure 4. A comparison of observed sea surface temperature changes from 1870 to 2019 to modeled changes. The scales are different because the actual change in CO2, in the top map, is smaller than the model scenario used. But the colors in the maps are compatible.
They claim that the models are OK, they just need to adjust their feedbacks. Richard Seager and his colleagues write:
“The tropical Pacific Ocean response to rising GHGs impacts all of the world’s population. State-of-the-art climate models predict that rising GHGs reduce the west-to-east warm-to-cool sea surface temperature gradient across the equatorial Pacific.
In nature, however, the gradient has strengthened in recent decades as GHG concentrations have risen sharply. This stark discrepancy between models and observations has troubled the climate research community for two decades. … The failure of state-of-the-art models to capture the correct response introduces critical error into their projections of climate change in the many regions sensitive to tropical Pacific sea-surface-temperatures.”(Seager, Cane, & Henderson, 2019)
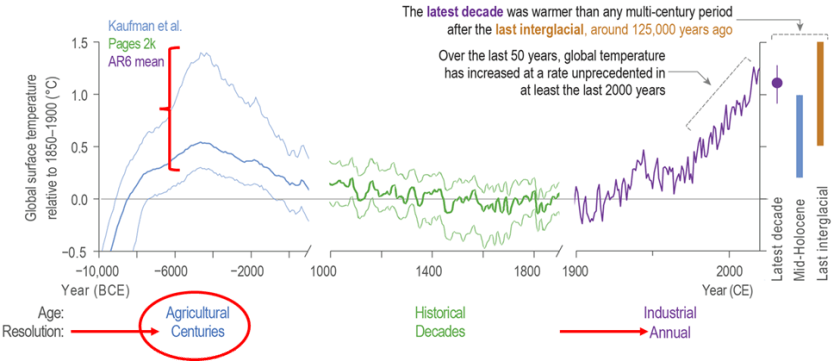
AR6 has its own version of the TAR hockey stick, and it is just as flawed as the first one. They also published a refutation of their own version on page 316 of their report, as shown in figure 5. They want us to believe that the last decade was warmer than any decade in the past 125,000 years. The data they rely on from 10,000 years ago to 2,000 years ago only has century (10 decades!) resolution by their own admission. I added the red circle, arrows, and brackets to their figure 2.11.
Figure 5. Modified after AR6, figure 2.11, page 316.
Notice especially the bracket. The uncertainty bars in their plot of temperatures from 10,000 years ago to 2000 years ago are larger than all the recent warming. In other words, their own data does not support their statement. They can’t possibly tell us anything about how the most recent decade compares to any decade prior to around 1850, at the end of the Little Ice Age.
In closing, I could go on and on, but the bottom line is that AR6 is the worst and most biased IPCC Physical Science Basis report ever. SAR through AR5 were bad, but AR6 is beyond help.
Take this from one of the few who has read all of them.
It is very clear that the IPCC is losing the public, polls repeatedly show the world population does not believe global warming is a priority. Recent polls show that skepticism about human-caused climate change is increasing around the world. A recent University of Chicago poll found that the belief that humans have caused all or most climate change slumped to 49% from 60% just five years ago. Seventy percent of the U.S. public are unwilling to spend more than $2.50 a week to combat climate change.
Figure 6. The number of pages in each major IPCC Physical Science Basis Report.
60% of U.S voters believe that climate change has become a religion that has nothing to do with climate. Billions of dollars, six major reports that total 6,543 pages (2,391, or nearly half of them are in AR6 as shown in figure 6) and a total of 47 reports of all kinds, and the public has not been convinced that climate change is important. It’s time for the IPCC to reform or give up, in my opinion.
For more details about the flaws in AR6 read the Clintel report. It was created by an international team of scientists, from seven countries around the world. It has been extensively peer-reviewed by some of the world’s top climate scientists. The cover is shown below as figure 7. It is available as a low resolution pdf for download at clintel.org and will be for sale as a proper ebook or paperback at Amazon, Kobo, and Barnes and Noble on May 29th.
Figure 7. Cover of the new Clintel assessment of the IPCC AR6 report. Download at clintel.org or purchase at your favorite bookseller after May 29th.
In agreeing to review a far-reaching legal precedent laid down in 1984, the U.S. Supreme Court May 2 opened the door to curtailing federal regulatory agencies’ power to decide for themselves what Congress intended when passing vaguely worded legislation.
Small scale fisherman next to his fishing boat in Hastings.
In agreeing to review a far-reaching legal precedent laid down in 1984, the U.S. Supreme Court May 2 opened the door to curtailing federal regulatory agencies’ power to decide for themselves what Congress intended when passing vaguely worded legislation.
For nearly four decades, federal agencies have seen their power grow exponentially under a doctrine known as Chevron deference. In Chevron v. Natural Resources Defense Council, the court ruled that judges are required to give wide deference to agencies’ interpretations of congressional intent.
The Reagan-era ruling has long been viewed by conservative scholars as undermining the U.S. Constitution’s separation of powers doctrine by placing too much power in the hands of unelected and unaccountable bureaucrats in the executive branch.
But a rule issued by the National Marine Fisheries Service (NMFS) that would charge commercial herring vessels up to $700 a day to monitor catches has triggered a lawsuit that poses a direct threat to agencies’ discretionary power. The case, Loper Bright Enterprises v. Raimondo, pits New Jersey-based herring fishermen against the Department of Commerce, to which the NMFS is attached. The lawsuit specifically asks the Supreme Court to consider overturning Chevron deference.
“Living at the Mercy of Washington”
Ryan Mulvey, counsel with Cause of Action representing the fishermen, told The Washington Times (May 2) that the case will give the court an opportunity to fix “one of the most consequential judicial errors in a generation.”
“Chevron deference has proven corrosive to the American system of checks and balances and directly contributed to an unaccountable executive branch, overbearing bureaucracy, and runaway regulation,” he added. “These fishing families and all those seemingly living at the mercy of Washington deserve better.”
Writing in The Wall Street Journal (May 10), former Interior Secretary David Bernhardt emphasized the significance of challenging Chevron deference.
“If the justices overturn the precedent, or at least significantly pare it back, executive agencies will no longer get to administer and interpret the law. Such a ruling would go a long way in restoring constitutional checks and balances.” (emphasis in the original)
Another Blow to the Administrative Regulatory State?
Overturning, or at least sharply curtailing, Chevron deference would represent the second blow the current Supreme Court has dealt the administrative regulatory state. In last year’s landmark case, WestVirginia v. EPA, the Supreme Court ruled that agencies issuing rules and regulations on “major questions” affecting the economy cannot do so without specific congressional authorization. Because every rule and regulation has the force of law behind it, in the pre-West Virginia v. EPA world, federal regulatory agencies had become de facto lawmaking bodies.
The Supreme Court will hear Loper Bright Enterprise v. Raimondo in October, with a ruling expected to be handed down in the following spring. At least one justice is eager to strike down the precedent.
“At this late hour, the whole project deserves a tombstone no one can miss,” Justice Neil Gorsuch wrote in a dissent last November. (The Washington Times, May 2)
Bonner R. Cohen, Ph. D., is a senior policy analyst with CFACT, where he focuses on natural resources, energy, property rights, and geopolitical developments. Articles by Dr. Cohen have appeared in The Wall Street Journal, Forbes, Investor’s Busines Daily, The New York Post, The Washington Examiner, The Washington Times, The Hill, The Epoch Times, The Philadelphia Inquirer, The Atlanta Journal-Constitution, The Miami Herald, and dozens of other newspapers around the country.
He has been interviewed on Fox News, Fox Business Network, CNN, NBC News, NPR, BBC, BBC Worldwide Television, N24 (German-language news network), and scores of radio stations in the U.S. and Canada.
He has testified before the U.S. Senate Energy and Natural Resources Committee, the U.S. Senate Environment and Public Works Committee, the U.S. House Judiciary Committee, and the U.S. House Natural Resources Committee. Dr. Cohen has addressed conferences in the United States, United Kingdom, Germany, and Bangladesh.
He has a B.A. from the University of Georgia and a Ph. D. – summa cum laude – from the University of Munich.
For a hypothesis to reach the status of being a legit theory, it requires withstanding the onslaught of observed empirical evidence. The CAGW hypothesis is no such animal.
For a hypothesis to reach the status of being a legit theory, it requires withstanding the onslaught of observed empirical evidence. The CAGW hypothesis is no such animal.
Known by its more contemporary aliases, such as ”climate crisis,” “climate emergency,” “climate collapse,” or “existential threat,” the CAGW has zero empirical evidence to support it.
Unlike the related hypothesis regarding greenhouse gases (GHG) and global warming, at least the GHG hypothesis has warming global temperature data that somewhat coincides with increasing atmospheric CO2 levels, putting aside the growing possibility that the purported cause-and-effect direction is probably the reverse. [Note: See Temps Cause CO2 Changes, Not the Reverse. 2023 Update]
In order to reach a CAGW climate disaster, global warming temperatures must change rapidly in an accelerating manner that will initiate a ‘tipping point’ for the climate.
The rapid acceleration would present its occurrence in a continuous increasing of the slope, i.e., trend, of temperatures, such as monthly temperatures. Each subsequent month would represent a greater temperature magnitude increase than the month before, hypothetically.
But those tipping point precursors are not occurring in the real-world climate.
For example, it is agreed by all climate scientists that oceans play a very major role in the world’s climate and its global temperatures due to their being both the world’s largest carbon sink and its largest heat content storage.
However, despite these characteristics, in totality, the global oceans HAVE NOT warmed since the year 2014. And certainly, there is no empirical evidence that oceans exhibit constant temperature increases of magnitude.
Quite the contrary, combined oceans exhibit a regular pattern of temperature decreases and increases, as the adjacent plot of NOAA’s monthly ocean data indicates.
Specifically, this is a plot (dark blue) of moving 5-year temperature changes ending each month of the 60-year period from March 1963 through March 2023.
[Explanation: the first data point is the temperature change for the 60 months ending on March 30, 1963; and the chart’s last temperature change data point is for the five 5 years (i.e. 60 months) ending on March 2023.]
The chart also includes a plot (green) of the moving 60-month CO2 level changes over the same sixty year period, plus a linear trend for both CO2 changes and ocean temperature changes.
The trend of the 60-month CO2 changes significantly exceeds the slight positive trend of ocean temperature changes by a factor of 117x.
This huge differential undercuts the belief that global warming is primarily the result of GHGs. Which is confirmed by the paltry R^2 of +0.06 – an almost non-existent relationship between 5-year atmospheric CO2 changes and 5-year changes in ocean temperature.
Not only are the large increases in CO2 levels not causing a concerning uptick of temperature change magnitude, it also has not lead to any type of acceleration, per the linear trend since 1963.
Specifically, with a trend of a tiny +0.0001°C, that would project out 20 years to be an increase of 5-year temperature changes to an insignificant amount of +0.024 – definitely not an existential threat of ‘runaway warming’ or a CAGW ‘climate crisis’ as portrayed by bureaucrats, politicians and Hollywood celebrities.
So, if 5 years of increasing amounts of CO2 in the atmosphere barely influence 5-year changes in temperature over a 60-year span, either in magnitude or acceleration rate, then it is highly unlikely that this trace gas would cause a catastrophic climate disaster or an extinction event.
Thus, it is fair to state that for all those scientists pushing a narrative of an imminent climate change catastrophe from CO2 without the requisite empirical evidence, this has become the real climate science crisis facing society.
Notes: Temperature and CO2 data sources.Excel used to calculate 60-mth (5-yr) temperature and CO2 changes; used to calculate the respective trends; used to calculate correlation and r-squared; used to plot the chart.
Former President Obama said in a new interview that what most worries him is that Americans are occupying “different realities.”
“The thing that I’m most worried about is the degree to which we now have a divided conversation, in part because we have a divided media, a splintered media,” Obama told “CBS Mornings” host Nate Burleson.
“Today what I’m most concerned about is the fact that, because of the splintering of the media we almost occupy different realities, right? If something happens that, you know, in the past everybody could say, ‘All right, we may disagree on how to solve it, but at least we all agree that, yeah, that’s an issue,’” he said.
“Now people will say, ‘Well, that didn’t happen,’ or, ‘I don’t believe that,’ or, ‘I don’t care about the science,’ or, ‘I’m not concerned about these experts, you know, ’cause they’re just all liberals’ or, you know, ‘That’s just conservative propaganda,’” he continued.
The one question Obama doesn’t ask is why the conversation fractured. If Obama wants to understand who caused the problem, perhaps he should try looking in the mirror.
The answer to why is obvious – noble cause corruption. Mainstream media abandoned their original mission of objectively reporting the news, and embraced an alternative mission of trying to re-shape society.
But millions of people want to hear what Trump has to say.
Why do many mainstream media figures believe CNN should have denied President Trump a platform, when so many of their potential audience wanted to see Trump speak? Were mainstream media objections based on their mission to uphold objective, unbiased reporting? Or were they angry that CNN had deviated from a liberal mission to re-shape society, by silencing voices which dispute the liberal narrative?
When Obama talks about healing the fracture, does he mean giving airtime to other points of view? Or is his idea of healing the fractured national voice an intention to silence those voices he doesn’t like?
Too many people in politics and mainstream media seem to believe it is their mission to protect the public from dangerous ideas and “misinformation”, to be the arbiters of truth, to decide which voices people should hear.
Did people like Obama really expect others would just sit still and take the abuse?
Whether it’s suppressing climate skeptics, refusing to debate skeptics, or deplatforming politicians like Trump, mainstream media and the establishment’s intolerable attempts to shape the conversation through heavy handed censorship are in my opinion the cause of the fracture.
Of all tyrannies, a tyranny sincerely exercised for the good of its victims may be the most oppressive. It would be better to live under robber barons than under omnipotent moral busybodies. The robber baron’s cruelty may sometimes sleep, his cupidity may at some point be satiated; but those who torment us for our own good will torment us without end for they do so with the approval of their own conscience. They may be more likely to go to Heaven yet at the same time likelier to make a Hell of earth. This very kindness stings with intolerable insult. To be “cured” against one’s will and cured of states which we may not regard as disease is to be put on a level of those who have not yet reached the age of reason or those who never will; to be classed with infants, imbeciles, and domestic animals. – CS Lewis
Some of the UK’s top scientists are struggling to deal with what they describe as a huge rise in abuse from climate crisis deniers on Twitter since the social media platform was taken over by Elon Musk last year.
Some of the UK’s top scientists are struggling to deal with what they describe as a huge rise in abuse from climate crisis deniers on Twitter since the social media platform was taken over by Elon Musk last year.
Since then, key figures who ensured “trusted” content was prioritised have been sacked, according to one scientist, and Twitter’s sustainability arm has vanished. At the same time several users with millions of followers who propagate false statements about the climate emergency, including Donald Trump and rightwing culture warrior Jordan Peterson, have had their accounts reinstated.
Climate scientists say the change has been stark, and they are fighting to make themselves heard over a “barrage” of often hostile comments.
“There’s been a massive change,” said Mark Maslin, professor of earth system science at University College London and the author of popular books including How to Save Our Planet. “I get so much abuse and rude comments now. It’s happening to all of us, but I challenge the climate deniers so I’ve been really targeted.”
Maslin says he used to have regular meetings with Sean Boyle, Twitter’s former head of sustainability, who was laid off in Musk’s mass cull of staff shortly after he began his takeover in April 2022. Maslin said Boyle discussed the platform’s work to develop ways of ensuring that trusted information was pushed to the top.
“They were using climate change as a good test bed, because it was fairly clear who the good and bad actors were,” Maslin said. “But he was sacked and Twitter became the wild west.”
Maslin said he will stay on the platform and push back against conspiracy theories with scientific evidence. “I want people to understand there are solutions. There is a real need for us to be on social media defending the truth, however nasty the responses get.”
But not all scientists have found standing up to regular hostility an easy feat. Doug McNeall, a statistician working on climate change at the Met Office Hadley Centre in Exeter, said he had blocked or muted many accounts on Twitter even before Musk’s arrival. “I got to the point where it was definitely affecting my mental health,” he said.
“I spent years debating quite strongly with climate sceptics, including people I assume were paid,” he added. “But there can be a real personal cost interacting over a long time with people who are abusing you.”
McNeall said it was hard for scientists to work out how to cut through the false information on Twitter. “I just can’t tell if people are seeing disinformation or getting good scientific information about what is happening,” he said. “That’s really worrying.”
First, it confirms that pre-Musk Twitter was censoring climate sceptics.
Secondly, far too many climate scientists want to be political activists too. If they want to carry on publishing scientific papers, then fine. But it is not their job to tell us to change our lifestyles. These are political matters, to be determined by governments and voters. If they want to get involved in politics, then they should rightly expect to be criticised.
Thirdly, if they don’t want the hassle of defending their views, then the answer is very simple – don’t go on Twitter. Ben Pile summed it up nicely, when he called them planet-saving super heroes.
They actually think they are more important than they really are.
They have not sought to defend themselves against their critics.
Instead, these planet-saving super-heroes play the victim to avoid debate.
The greatest energy folly of all time… Germany restricts electricity supply while ramping up demand! Rationing unavoidable
Nowadays it seems Germany is doing everything possible to warp-speed ruin itself.
If today’s German leaders were driving a car and wanted to go faster, they would ease off the gas pedal and slam on the brakes – and hope it works! That’s basically how they’re handling the country’s energy crisis. Some would understandably equate it all to lunacy.
Soon this may be what Germans with heat pumps and electric cars are going to be seeing next winter.
Going electric while shutting down power plants
While leaders demand citizens quickly switch over to electric mobility and heat pump systems, thus placing ever huger demands on the power grid, they are reacting by shutting off nuclear and fossil fuel power plants, thus making electricity even more scarce than it already is.
Rationing becoming unavoidable
As Germany’s energy shortages intensify, it’s no surprise that rationing is becoming only way out. And so the Federal Network Agency now proposes that grid operators be allowed to ration electricity in the future to avoid possible overloads caused by charging e-cars and heat pumps. This how grid overloads are to be avoided in the future.
Nightmare for companies
Companies planning to set up shop in Germany may want to think again if they plan on using electricity. Firstly prices have soared and are among the highest in the world, and secondly: don’t expect the supply to be reliable as brownouts are now in the plans.
Even worse for private citizens
For private consumers, it gets even worse. According to the plan, beginning already in 2024, grid operators are to be empowered “to temporarily restrict electricity purchases from private charging stations and heat pumps to avoid peak loads,” reports Blackout News.
Have blankets ready
“If it is proven that the grid could be overloaded, the distribution grid operator has the right to reduce the power,” said Klaus Müller, head of the Federal Network Agency in an interview with BR24. In other words, if it’s January and -10°C outside, your heat pump may be remotely switched off. Have blankets ready.
Power grid totally inadequate
Another problem is the lack of power grid upgrades that are necessary to handle the huge extra demand for power that heat pumps and electric cars will create. The result: severe supply bottlenecks and overloads. Again, the only measure available for the challenge will be rationing.
Lower electric rates for those who have to freeze
“In order to avoid delays in the connection of heat pumps and charging stations, an additional control option by the distribution grid operator is necessary, reports Blackout News. “In the end, a corresponding control means nothing other than a rationing of electricity purchases. As compensation for the affected consumers, it is envisaged that they will receive a reduction in their grid fees.”
Criticism mounts (finally)
A number of industry associations have widely criticized the “unilateral and unlimited throttling” of the power supply and warn this would mean “considerable restrictions for consumers and thus also limit consumer acceptance of heat pumps and electric cars”.
Unless Germany radically changes course in its energy policy, citizens who heat their homes with heat pumps and travel with electric cars may find themselves often stranded in unheated homes in the wintertime.
Greatest energy folly of all time?
No one could have imagined a folly of this scale less than 2 years ago, just before the current Socialist-Green government took over the reins of power at the end of 2021. Other countries may want to avoid the idiotic German path.





You must be logged in to post a comment.