Trump Shook Up Energy Policy In 2025. Disaster Could Still Strike In 2026

In 2025, President Trump’s second term brought major shifts to U.S. energy policy through executive orders and deregulatory actions signed from day one. These prioritized fossil fuels, nuclear power, and rapid permitting while scaling back renewables and climate-focused regulations.

Silhouette of the New York City skyline during sunset, featuring the Empire State Building against a colorful sky.
UNITED STATES – AUGUST 15: Manhattan skyline is dark as the sun comes up on the morning after a massive power failure caused the largest power outage in the nation’s history, affecting 50 million people in parts of seven states and Canada. (Photo by Mike Albans/NY Daily News Archive via Getty Images)

In 2025, President Trump’s second term brought major shifts to U.S. energy policy through executive orders and deregulatory actions signed from day one.

These prioritized fossil fuels, nuclear power, and rapid permitting while scaling back renewables and climate-focused regulations.

The administration canceled billions in clean energy funding, reduced EPA staffing, and rolled back emissions rules for vehicles and power plants.

These moves boosted domestic oil and gas production while canceling over $32 billion in planned renewable investments, slowing wind and solar growth.


From THE DAILY CALLER

Silhouette of a city skyline against a colorful sunset, featuring tall buildings and a calm atmosphere.
The sun sets over the Manhattan skyline on Aug. 14, 2003. A major power outage doused the lights on more than 50 million people across the Northeastern U.S. and part of Canada.

Daily Caller News Foundation

Audrey Streb
DCNF Energy Reporter

Though the second Trump administration has pivoted from the Biden administrationโ€™s aggressive and climate-centric policies, Americans could still face a year of rising electricity costs and potential energy bottlenecks in 2026.

President Donald Trump and Congress voided several harsh Biden-era policies in 2025 that would have restricted oil and gas development and enacted a de facto national electric vehicle (EV) mandate. The Trump administration has cut billions in green energy spending, which contrasts with former President Joe Bidenโ€™s focus on expensive climate initiatives.

Additionally, the Trump administration has moved to boost conventional energy sources like coal while also looking to advance newer technologies like fusion. Though the Biden administration also moved to advance nuclear energy, it cracked down on the oil and gas sector, blocking and restricting development in areas across the U.S. and freezing liquefied natural gas (LNG) exports.

The policy shift has come alongside a more โ€œrealisticโ€ approach to the energy debate, according to Dustin Meyer, senior vice president of Policy, Economics and Regulatory Affairs at the American Petroleum Institute (API). However, the shifting energy landscape could spell bad news for the U.S. in 2026, as artificial intelligence (AI)ย data centersย and other drivers areย projectedย to driveย demandย potentiallyย beyondย Americaโ€™s available supply.

โ€œThis has been a year in which the energy conversation has finally become more realistic, and I think fortunately, increasingly, we have a policy environment that reflects that,โ€ Meyer told the Daily Caller News Foundation. โ€œOne of the key reasons why the energy conversation has become more realistic this year is because of the rise of AI and the demonstrable need for more electricity generation to meet the AI demand.โ€

ย (RELATED: Republicans Erased Record Number Of Biden Regulations In 2025. Here Are The Worst

Trump Flipped The Script

โ€œFixing Joe Bidenโ€™s energy crisis has been a priority for President Trump since day one, and lowering energy costs for American families and businesses will continue to be a top priority in the new year,โ€ White House spokeswoman Taylor Rogers told the DCNF.

The administration hasย repeatedlyย toutedย Trumpโ€™s energy policies asย ushering inย lower gas prices andย arguedย that Department of Energy (DOE) efforts to keep coal plants operating past their planned decommission dates will help maintain affordability for ratepayers.

The Trump administration also spearheaded a major deregulatory effort, with the Environmental Protection Agency (EPA) Administrator Lee Zeldin announcing that his agency is targeting the 2009 Endangerment Finding, a keystone climate regulation.

While Biden moved quickly to restrict the oil and gas industry โ€” canceling the Keystone XL pipeline on his first day in the Oval Office โ€” the Trump administration has fought to block offshore wind projects, most recently halting construction on all major projects in the U.S., citing national security concerns.

Some energy experts argue that Trumpโ€™s crackdown could finally bring Congressional Democrats to the table on deregulation. However, the administrationโ€™s recent pause on offshore wind projects has prompted some Democrats to threaten to walk away from a deal, as key permitting reform legislation hangs in the balance.

โ€œIf rising prices are the problem, we think permitting reform is a big part of the solution,โ€ Meyer said.

Rising Electricity Costs

Meyer told the DCNF that โ€œaffordability has become the defining energy issue in American politics, and perhaps just the defining issue in American politics, and energy is just essential to doing that.โ€

Electricity costs are projected to keep rising in 2026, despite the administrationโ€™s efforts to deregulate and bolster traditional energy sources. The Energy Information Administration (EIA) projects that demand from data centers and cryptocurrency mining will contribute to rising electricity costs in 2026.

The administration and some energy experts have reasoned that blue states have higher rates and that Democrat policies restricting supply may be driving cost increases.

Rogers told the DCNF that โ€œhigh energy prices are a choice โ€“ blue states like California and Maine are stubbornly choosing Green Energy Scam policies that are making electricity bills unaffordable. Meanwhile, GOP-led states are successfully lowering energy costs for their residents by embracing President Trumpโ€™s commonsense โ€˜DRILL, BABY, DRILLโ€™ agenda.โ€

A recent analysis from the Institute for Energy Research and Always on Energy Research showed that blue states generally have higher electricity costs than red states. The reportโ€™s authors also note that several of these states with higher electricity rates also have what they term โ€œideological mandatesโ€ to phase out power sources like coal.

In contrast, 80% of the states with the most affordable electricity costs per kilowatt hour are โ€œreliably red,โ€ according to the report.

Someย Democrats, some clean energy andย green groupsย argue that it is keeping coal plants online that will drive up electricity costs. However, a July DOE grid reliabilityย reportย warned that if America continues to retire reliable power without replacing it, blackouts could increase by a factor of 100 by 2030.ย 

(EXCLUSIVE: Democrats Are Behind Your Crippling Electricity Bills, Report Confirms)

Artificial Intelligence

Several high-profile Republicans and Democrats alike are striking against unbridled data center expansion headed into the 2026 midterms, citing affordability concerns, among other worries.

While Trump has embraced AI development, some prominent GOP members like Republican Florida Gov. Ron Desantis and grid experts like former Federal Energy Regulatory Commission (FERC) Chairman Mark Christie have argued some of the administrationโ€™s AI policies and proposals could usurp state sovereignty and hurt consumers.

โ€œThe Biden Administration launched a war on American energy that constrained power production, drove up costs, and would have ensured the United States lost the AI race,โ€ a DOE spokesperson told the DCNF previously, arguing that Trumpโ€™s policies are key to powering America as the tech and energy landscape shifts.

Steve Milloy, senior legal fellow at the Energy & Environment Legal Institute, previously told the DCNF that โ€œwhile itโ€™s quite possible that many consumers will face high prices for less reliable power in the near-term because of tremendous data center needs and a grid that has been crippled by green policies, what we actually need are more power plants and fewer green policies.โ€

Meyer told the DCNF that due to climbing energy demand, โ€œweโ€™re going to have to move fairly quickly here [to build energy infrastructure.] The magnitude of the demand increases are significant, and this is a pretty sharp departure from some of the trends that weโ€™ve seen over the last 20 years.โ€

All content created by the Daily Caller News Foundation, an independent and nonpartisan newswire service, is available without charge to any legitimate news publisher that can provide a large audience. All republished articles must include our logo, our reporterโ€™s byline and their DCNF affiliation. For any questions about our guidelines or partnering with us, please contactย licensing@dailycallernewsfoundation.org.

Arctic Ice Recovering 2025ย Yearend

Sea ice extent is the total area of ocean covered by at least 15% sea ice, measured daily via satellite passive microwave sensors (e.g., NSIDC Sea Ice Index). It differs from sea ice area (which accounts for actual ice concentration) or volume/thickness. Extent is a key climate indicator because it reflects seasonal freeze/melt cycles and long-term changes driven by warming.

Aerial view of an orange and blue ship surrounded by extensive sea ice in a bright, sunlit Arctic landscape.

Sea ice extent is the total area of ocean covered by at least 15% sea ice, measured daily via satellite passive microwave sensors (e.g., NSIDC Sea Ice Index). It differs from sea ice area (which accounts for actual ice concentration) or volume/thickness. Extent is a key climate indicator because it reflects seasonal freeze/melt cycles and long-term changes driven by warming.

Seasonal cycle: Arctic sea ice grows in winter (maximum typically in March) and melts in summer (minimum in September).

Units: Million square kilometers (kmยฒ).

A map of the Arctic region displaying major geographic features including the Arctic Ocean, Canadian Archipelago, Greenland, and surrounding seas like Beaufort Sea and Chukchi Sea, with labeled areas of sea ice.
Maps | National Snow and Ice Data Center

From Science Matters

Byย Ron Clutz

A playful illustration featuring four cartoon polar bears celebrating the year 2025, with the bears wearing colored crowns and holding party noisemakers against a light blue background.

The Arctic ice extents are now fully reported for 2025, ending the year below average despite a higher rate of growth through December.

Line graph showing Arctic ice extents for December, comparing data from 2025, 2024, and 19-year averages, with axis labels for days and ice extents in million square kilometers.

Note MASIE 2025 started 1M km2 (or 1 Wadham) below the 19 year average, but cut the deficit to 428k km2, or a gap of 3%. SII v.4 tracked lower than MASIE during December, drawing closer the last week. The chart below shows the distribution of ice extent across the Arctic regions at yearend 2025.

Region2025365Day 365 Average2025-Ave.20243652025-2024
 (0) Northern_Hemisphere1261167613039302-42762612435177176499
 (1) Beaufort_Sea10710701070458612107100169
 (2) Chukchi_Sea966006964771123596598917
 (3) East_Siberian_Sea10871371087133410871370
 (4) Laptev_Sea89784589784148978450
 (5) Kara_Sea867623887208-19585876527-8904
 (6) Barents_Sea254882423978-169096345715-90832
 (7) Greenland_Sea6685505956587289157453794013
 (8) Baffin_Bay_Gulf_of_St._Lawrence768306982649-214343982716-214409
 (9) Canadian_Archipelago854931853618131385487853
 (10) Hudson_Bay1256284121569540589922416333868
 (11) Central_Arctic31743543206560-322063207164.49-32811
 (12) Bering_Sea350519403002-52483325489.9325029
 (13) Baltic_Sea1403131873-1784315271.77-1241
 (14) Sea_of_Okhotsk366812393742-2692930294163871

The major deficits are in Barents Sea and Baffin Bay (Atlantic basins), along with smaller losses in Bering and Okhotsk (Pacific basins).

A detailed map of the Arctic region highlighting various basins and seas, including the Canada Basin, Greenland Basin, and Barents Sea, with labeled geographic features.

Some years ago reading a thread on global warming at WUWT, I was struck by one personโ€™s comment: โ€œIโ€™m an actuary with limited knowledge of climate metrics, but it seems to meย if you want to understand temperature changes, you should analyze the changes, not the temperatures.โ€ That rang bells for me, and I applied that insight in a series of Temperature Trend Analysis studies of surface station temperature records. Those posts are available under this heading.ย Climate Compilation Part I Temperatures

This post seeks to understand Arctic Sea Ice fluctuations using a similar approach: Focusing on the rates of extent changes rather than the usual study of the ice extents themselves. Fortunately, Sea Ice Index (SII) from NOAA provides a suitable dataset for this project. As many know, SII relies on satellite passive microwave sensors to produce charts of Arctic Ice extents with complete coverages going back to 1989.  Version 3 was more closely aligned than Version 4 with MASIE, the modern form of Naval ice charting in support of Arctic navigation. The SII User Guide is here.

There are statistical analyses available, and the one of interest (table below) is called Sea Ice Index Rates of Change (here). As indicated by the title, this spreadsheet consists not of monthly extents, but changes of extents from the previous month. Specifically, a monthly value is calculated by subtracting the average of the last five days of the previous month from this monthโ€™s average of final five days. So the value presents the amount of ice gained or lost during the present month.

These monthly rates of change have been compiled into a baseline for the period 1980 to 2010, which shows the fluctuations of Arctic ice extents over the course of a calendar year. Below is a graph of those averages of monthly changes up to and including this year. Those familiar with Arctic Ice studies will not be surprised at the sine wave form. December end is a relatively neutral point in the cycle, midway between the September Minimum and March Maximum.

Graph illustrating the monthly Arctic ice change rates from 1980 to 2025, showing average extent change in million square kilometers throughout the year.

The graph makes evident the six spring/summer months of melting and the six autumn/winter months of freezing.  Note that June-August produce the bulk of losses, while October-December show the bulk of gains. Also the peak and valley months of March and September show very little change in extent from beginning to end.

The table of monthly data reveals the variability of ice extents over the last 4 decades, with gains in blue cells and losses in red cells.

Table showing Arctic sea ice extent changes from 1978 to 2025, highlighting monthly gains and losses with color coding for better visibility.

The values in January show changes from the end of the previous December, andย by summing twelve consecutive months we can calculate an annual rate of change for the years 1980 to 2025.

Graph showing annual Arctic ice changes in million square kilometers from 1990 to 2025, with a fluctuating line representing annual extent changes.

As many know, there has been a decline of Arctic ice extent over these 40 years, averaging 70k km2 per year. But year over year, the changes shift constantly between gains and losses, ranging up to +/- 500k km2, (2024 being exceptional). Since 1989 the average yearend gain/loss is nearly zero, -0.049k km2 to be exact.

Moreover, it seems random as to which months are determinative for a given year. For example, much ado was printed about 2023 losing more ice than usual June through September. But then the final 3 months of 2023 more than made up for those summer losses, resulting in a sizeable gain for the year.

As it happens in this dataset, October has the highest rate of adding ice. The table below shows the variety of monthly rates in the record as anomalies from the 1980-2010 baseline. In this exhibit a red cell is a negative anomaly (less than baseline for that month) and blue is positive (higher than baseline).

A table showing monthly anomalies of Arctic ice extent from 1979 to 2025, with gains highlighted in blue and losses in red.

Note that the  +/ โ€“  rate anomalies are distributed all across the grid, sequences of different months in different years, with gains and losses offsetting one another.  As noted earlier,  in 2023 the outlier negative months were June through September where unusual amounts of ice were lost.  Then unusally strong gains in October to December resulted in a large annual gain, compared to the baseline. The bottom line presents the average anomalies for each month over the period 1979-2025.  Note the rates of gains and losses mostly offset, and the average of all months in the bottom right cell is virtually zero.

A final observation: The graph below shows the Yearend Arctic Ice Extents for the last 35 years.

Graph showing yearend sea ice extent in million square kilometers from 1989 to 2025, illustrating a decreasing trend over time.
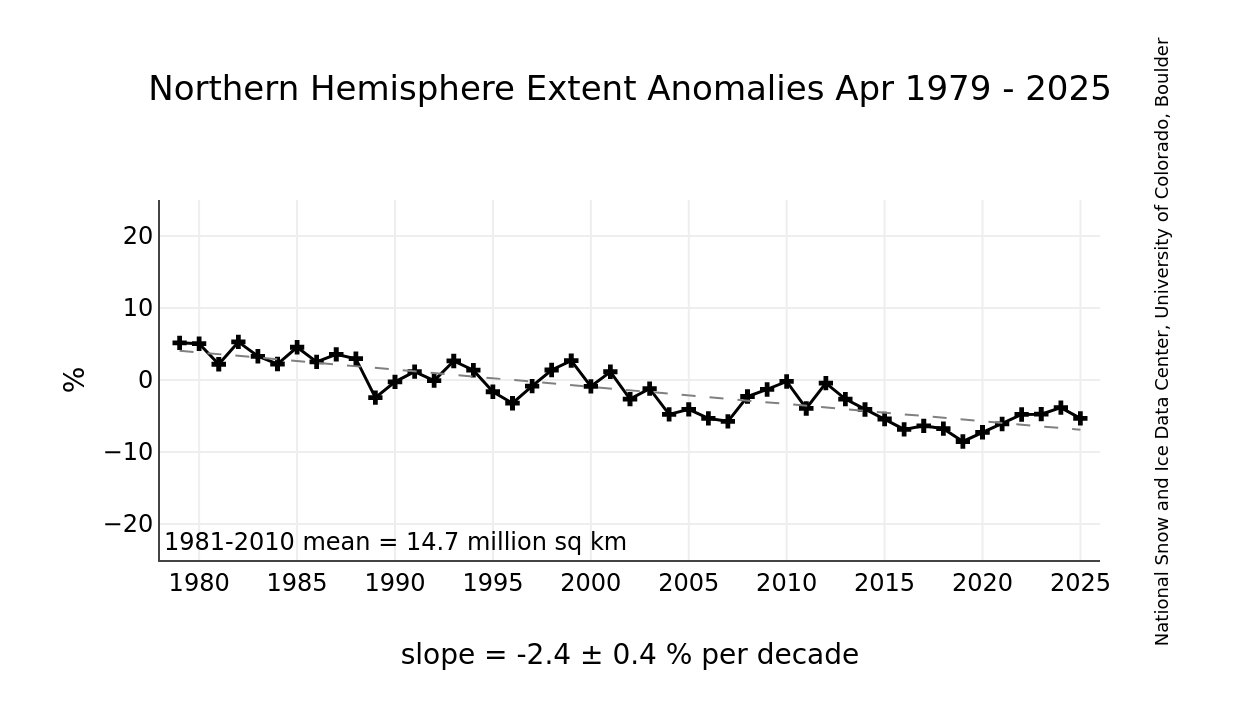
Graph illustrating the Northern Hemisphere sea ice extent anomalies from December 1978 to 2025, showing a decline in percentage over the decades.
Sea Ice Index Daily and Monthly Image Viewer | National Snow and Ice Data Center

Year-end Arctic ice extents (last 5 days of December) show three distinct regimes: 1989-1998, 1998-2010, 2010-2025. The average year-end extent 1989-2010 is 13.4M km2. In the last decade, 2011 was 13.0M km2, and six years later, 2017 was 12.3M km2. 2021 rose back to 13.0  2024 slipped back to 12.2M, and 2025 is back up to 12.4M. So for all the the fluctuations, the net is virually zero, or a loss of one tenth of a Wadham (0.1M) from 2010. Talk of an Arctic ice death spiral is fanciful.

These data show a noisy, highly variable natural phenomenon. Clearly, unpredictable factors are in play, principally water structure and circulation, atmospheric circulation regimes, and also incursions and storms. And in the longer view, todayโ€™s extents are not unusual.

Graph showing the reconstructed Arctic sea ice extent from 1900 to 2013, with marked trends and annotations.
The graph shows a reconstruction of September Arctic sea ice extent (the summer minimum) from ~1900 to ~2013, based on work by Alekseev et al. (2016), as presented in Connolly et al. (2017).

It uses red bars for year-to-year values (reconstructed pre-1979, satellite-observed post-1979).

A blue trend line is overlaid.

The annotation points to a low point around the 1930sโ€“1940s and accuses “alarmists” of starting trends from ~1979 (satellite era) while “ignoring” earlier lows.

There was a significant dip in sea ice during the Early Twentieth Century Warming (ETCW, ~1920sโ€“1940s), with extent roughly comparable to (or only slightly higher than) recent lows. This suggests natural variability played a big role, and modern decline isn’t unprecedented.

The method relies on a statistical relationship between summer Arctic surface air temperatures (from weather stations) and satellite-era sea ice extent. They essentially used temperature data as a proxy to “back-calculate” ice extent before direct observations.

This reconstruction is not mainstream.

A cartoon depicting a polar bear next to an out-of-order ice machine, saying, 'Oh, look... the ice maker's workin!' A person in winter clothing holds a sign that reads, 'The Earth has a fever.'

Richard Betts Fake Heatwave Deathsย Claim

Richard Betts, a prominent UK climate scientist (Head of Climate Impacts Research at the Met Office and Professor at the University of Exeter), appeared on Channel 4 News in early January 2026 discussing the UK’s “hottest year” claims. During the segment, he reportedly referenced heat-related impacts, including an estimated 1,500 deaths linked to heatwaves.

A close-up of a textured skull resting on a cracked surface, with an orange and red background suggesting heat or fire.

Richard Betts, a prominent UK climate scientist (Head of Climate Impacts Research at the Met Office and Professor at the University of Exeter), appeared on Channel 4 News in early January 2026 discussing the UK’s “hottest year” claims.

During the segment, he reportedly referenced heat-related impacts, including an estimated 1,500 deaths linked to heatwaves.

The post accuses Betts of exaggerating or fabricating the 1,500 deaths figure, arguing that UK mortality data from the Office for National Statistics (ONS) shows deaths actually decline in summer months compared to winter, with no visible spike corresponding to recent heatwaves.

It presents charts of weekly deaths and temperatures to support this, concluding that “heat does not kill, cold does,” and calls the claim “immoral and dishonest.”

Graph showing global heat, cold, and climate-related deaths from 1920 to 2020, illustrating the high number of cold-related deaths compared to heat-related deaths.

From NOT A LOT OF PEOPLE KNOW THAT

By Paul Homewood

Richard Betts discussing heatwave-related deaths on Channel 4 News, with text overlay indicating '1500 Heatwave Deaths - Richard Betts'.
UK โ€˜already seeing impact of climate changeโ€™, says Met Office scientist โ€“ Channel 4 News

Richard Betts, Head of Climate Impacts Research at the Met Office, was wheeled out on Channel 4 News yesterday to promote their dubious โ€œhottest year evah in UKโ€ claim. His rather pathetic attempts to scare the public included ludicrous claims about plants and insects being confused and glaciers melting! Yes, Richard, glaciers have been melting for 200 years โ€“ were our SUVs the cause in 1800 as well?

But I cannot let him get away with one particularly outrageous claim, at about 1 min in:

โ€œWe had a run of three major heatwaves in the UK, which caused a lot of people to die sadly. Over 1500 people died from heat related causes alone in the summer and about three-quarters of those probably would not have died without extra supercharging of the heatwave due to climate changeโ€

There is absolutely no evidence to back any of this up. Similar claims in previous years have always originated from fraudulent computer models, completely disproven by the actual data.

The Office for National Statistics, ONS, carried out a full analysis after the 2022 heatwave, which found that the heatwave did not increase death rates at all. What they said was that deaths may have been brought forward by a few days on the hottest days but quickly dipped below average on the days after. Over the period as a whole death rates were normal.

In short, people who were dying anyway may have died a couple of days or so prematurely. The heatwave did not kill them any more than an April shower or a cold winterโ€™s day could have done.

I have been keeping tabs on this topic since theย Guardianย claimed in June that 600 would die from the heat that month. The table below is compiled from ONS weekly registration of deaths data. (Bear in mind that registration is around a week after the date of death). As weekly registrations are affected by bank holidays, I have calculated averages per working day, i.e. excluding bank holidays:

Bar chart illustrating UK daily death rates for the year 2025, with weekly data displayed in orange columns showing fluctuations in death counts over the weeks.
Deaths registered weekly in England and Wales, provisional – Office for National Statistics

There is a little blip upwards in Week 18, w/e May 2nd, which almost certainly is a catching up of the backlog that built up over Easter, Also another blip up in Week 35, which included August Bank Holiday, probably extra registrations crammed into the 4-day week.

But the overall trend is unmistakeable. From winter onwards, there is a steady uninterrupted decline in daily deaths, until they resume their upward trend autumn.

There is no sign at all of Bettsโ€™ fake โ€œ1500 deathsโ€ during the summer. On the contrary, as temperatures rose, deaths declined. To pretend otherwise is immoral and dishonest. In summer, many fewer die than in spring and autumn, never mind winter. Heat does not kill, Richard โ€“ cold does.

We are now very familiar with the politicisation of the Met Office But this latest contribution from one of their most senior โ€œscientistsโ€ goes beyond the pale.

What Betts said was not only unsubstantiated and unscientific. It was an abuse of the trust that for years we have all put in the Met Office, which has for so long stood for scientific integrity, honesty and public service. It is a stain on the reputation of all those who once made the Met Office the envy of the world and a beacon of science.

If anybody needs any further convincing about this perversion of science, just listen to Richard Bettsโ€™ words. Twice he tells us we must give up fossil fuels.

Sorry, Richard, but it is not your job, or the Met Officeโ€™s, to tell us what we can and cannot do.

You have thoroughly demeaned yourself and destroyed your reputation.


Heat vs. Cold Deaths

Bar graph comparing cold deaths to heat deaths in Europe, highlighting that cold deaths far outnumber heat deaths, with additional detail on age groups and excess death rates.

Globally and in the UK, cold-related deaths far outnumber heat-related ones.

A 2021 Lancet study estimated ~4.6 million cold-related deaths annually worldwide vs. ~0.5 million from heat.

In England/Wales, estimates suggest ~60,000 cold-related excess deaths per year vs. ~800โ€“2,000 from heat (varying by source and methodology, e.g., London School of Hygiene & Tropical Medicine).

The “1,500 deaths” figure appears tied to modeled or estimated excess deaths from recent UK heatwaves (possibly aggregated or projected). It’s within the range of some public health estimates but debated.

When Everything Is a Heat Wave and Every Change Is Climate

This is the title of a January 2026 article on Watts Up With That? A site often skeptical of mainstream climate narratives. It critiques a scientific paper on a North Atlantic marine heat wave, arguing that loose definitions of “heat waves” (e.g., temperatures exceeding historical percentiles) and ecological impacts lead to over-attribution of ordinary variability or broad warming to specific “extreme” events caused by human-induced climate change.
This reflects a broader debate: Are modern heat periods overly labeled as unprecedented “heat waves” driven by climate change, or does evidence show genuine increases in frequency, intensity, and duration?

World map displaying marine heatwave magnitude over the past 30 days, with varying shades indicating temperatures from 0 to 5 degrees Celsius.
In hot water: exploring marine heatwaves – NOAA Research

This is the title of a January 2026 article on Watts Up With That?

A site often skeptical of mainstream climate narratives.

It critiques a scientific paper on a North Atlantic marine heat wave, arguing that loose definitions of “heat waves” (e.g., temperatures exceeding historical percentiles) and ecological impacts lead to over-attribution of ordinary variability or broad warming to specific “extreme” events caused by human-induced climate change.

This reflects a broader debate: Are modern heat periods overly labeled as unprecedented “heat waves” driven by climate change, or does evidence show genuine increases in frequency, intensity, and duration?

A recent study published in Science Advances (January 2026) titled “Major heat wave in the North Atlantic had widespread and lasting impacts on marine life” examines a significant marine heat wave (MHW) centered around a sharp temperature rise in the subpolar North Atlantic in 2003.

Illustration depicting changes in marine life in the North Atlantic before and after a significant marine heat wave, highlighting various species and ecological impacts.

From Watts Up With That?

By Charles Rotter

A NOAA research vessel is seen in the background, with a large whale surfacing in the ocean in the foreground.

A recent paper inย Science Advancesย bears the authoritative titleย โ€œA major heat wave in the North Atlantic had widespread and lasting impacts on marine life.โ€ย The phrasing is careful but decisive. A single physical event is asserted, and its ecological consequences are presented as both extensive and enduring. For readers accustomed to climate-ecology literature, the implication is clear: an extreme climatic anomaly occurred, ecosystems responded, and the link between the two is sufficiently established to justify confidence.

Screenshot of an article titled 'Major heat wave in the North Atlantic had widespread and lasting impacts on marine life' from the journal Science Advances.
https://www.science.org/doi/10.1126/sciadv.adt7125

The paper positions itself as both synthesis and analysis. It compiles physical temperature records, surveys a wide range of ecological indicators, and proposes that the year 2003 marks a pivotal momentโ€”a thermal disruption that reorganized the North Atlantic marine ecosystem. The ambition is not modest. The authors are not merely cataloging observations; they are advancing a causal narrative.

Early on, the paper states its central premise plainly:

โ€œHere, we test whether this sudden and stark rise in temperature classifies as an MHW, examine the physical drivers behind it, and investigate its impacts on marine ecosystems.โ€

This sentence does a great deal of work. It asserts the existence of a โ€œsudden and stark rise,โ€ presumes that classification as a marine heat wave is a meaningful exercise, and then moves directly to impacts. What it does not do is pause to ask whether the quantities being connectedโ€”โ€œthe MHWโ€ and โ€œmarine ecosystemsโ€โ€”are defined with sufficient precision to support causal inference. That omission is not incidental; it permeates the paper.

The first weak link is the marine heat wave itself. Despite the strong connotations of the term, the paper does not identify discrete heat-wave events in the ocean in any physically intuitive sense. Instead, it constructs a metric based on threshold exceedances. Temperatures above the 99th percentile of a historical reference period are counted across 88 different time series and summed by year. The resulting aggregate is labeled โ€œMHW frequency.โ€

The authors describe this as follows:

โ€œWe define an MHW as any temperature exceeding the 99th percentile of the 1870โ€“1969 reference period and count the number of MHWs each year.โ€

What is being counted here is not events, but exceedances. A single basin-wide warm anomaly can inflate this number dramatically if many correlated locations cross their thresholds at once. The metric is therefore sensitive not just to temperature, but to spatial coverage, data density, and correlation structure. Calling this โ€œfrequencyโ€ suggests a count of independent occurrences. That is not what the method produces.

This matters because frequency implies repetition, recurrence, and increased likelihood of impact. But what the paper is really tracking is the spatial coherence of warmth relative to a chosen percentile. A broad warm year will look like many heat waves, even if it is physically one phenomenon. The distinction is blurred, then forgotten, as the narrative advances.

The construction becomes even more problematic when the temperature data themselves are examined. The paper combines gridded sea-surface temperature fields with point-based, subsurface observations at approximately 100 meters depth. These are not interchangeable measures of โ€œheat.โ€ They respond to different processes, operate on different time scales, and interact differently with biological systems. Yet they are treated as equivalent contributors to a single index.

The ecological side of the ledger is even less well defined. The paper repeatedly refers to โ€œecosystem impacts,โ€ โ€œabrupt changes,โ€ and โ€œwidespread responses,โ€ creating the impression of a well-established baseline from which deviations can be measured. In reality, the baseline is an assemblage of disparate observations drawn from incompatible sources.

The paper itself hints at this breadth:

โ€œEvidence for ecosystem change was compiled from a wide range of peer-reviewed publications and stock assessment reports spanning multiple trophic levels.โ€

That breadth is presented as strength. But breadth without standardization does not produce a baseline; it produces a mosaic. Fish stock assessments, plankton indices, benthic surveys, and fisheries-dependent data are all governed by different assumptions, sampling strategies, and human influences. Each has its own implicit reference period, often shifting over time. The paper does not reconcile these differences. It aligns them temporally and treats concurrence as coherence.

Many of the changes described are qualitative judgments elevated through repetition. Terms like โ€œabrupt,โ€ โ€œsudden,โ€ and โ€œmarkedโ€ recur throughout the cited literature, yet formal tests against null models of natural variability are rare. A change that appears striking within a short observational window is implicitly treated as exceptional, even though the historical envelope of variability is poorly constrained.

The problem is compounded by the retrospective nature of many ecological baselines. Species โ€œexpansionsโ€ are often inferred from first detection rather than systematic absence. Abundance shifts are inferred from improved surveys compared against earlier, less reliable data. Once an event like 2003 is identified as climatically noteworthy, ecological observations are naturally reinterpreted in its shadow.

The paper leans into this alignment explicitly:

โ€œThe 2003 MHW coincided with abrupt ecosystem changes across multiple trophic levels.โ€

Coincidence is doing a great deal of work here. Temporal overlap is treated as explanatory, even though the mechanisms linking a basin-scale temperature anomaly to diverse ecological responses are not rigorously established. Fishing pressure, regulatory changes, survey redesigns, and market dynamicsโ€”all of which profoundly shape marine dataโ€”are acknowledged only peripherally.

Nowhere is this more evident than in the treatment of fisheries data. Stock redistributions and abundance changes are presented as ecological responses, even though fisheries systems are deeply socio-ecological. Changes in quotas, targeting strategies, and detection technology can produce โ€œabruptโ€ shifts in reported distributions without any underlying biological reorganization. The baseline, such as it is, quietly assumes that fisheries outputs reflect ecological truth rather than human behavior layered onto ecosystems.

The paper goes further, invoking regime-shift language that carries strong causal implications:

โ€œThe observed changes are consistent with the characteristics of regime shifts previously identified in marine ecosystems.โ€

Yet no formal regime-shift detection is performed. There is no change-point analysis, no state-space modeling, no statistical demonstration that 2003 represents a structural break rather than a conspicuous point in a noisy, evolving system. Consistency with a regime-shift narrative is asserted, not demonstrated.

Perhaps the most revealing moment comes when the authors acknowledge a tension they do not resolve. Later periods show similarly high values of the heat-wave metric, yet the ecological responses appear less dramatic or less well documented. The paper notes this, then moves on. But this observation undermines the central claim. If the same โ€œforcingโ€ produces different outcomes, either the forcing is not well characterized, or it is not the dominant driver.

At no point does the paper seriously consider the possibility that the baseline itself is unstable. North Atlantic ecosystems were not in equilibrium prior to 2003. They were already responding to decades of fishing pressure, nutrient changes, and circulation variability. Treating the late 20th century as a stable reference state is a narrative convenience, not an established fact.

In the end, the paper offers a compelling story, but not a disciplined causal argument. A loosely defined marine heat wave is paired with a loosely defined ecological baseline, and the two are joined by temporal coincidence and confident language. The synthesis feels objective because it is large and comprehensive, not because its foundations are secure.

What is presented as evidence of causation is better understood as plausibility structured into a narrative. That distinction matters. When weakly constructed quantities are allowed to support strong claims, uncertainty is not reducedโ€”it is concealed.

The danger is not that this paper alone overreaches. The danger is that this style of reasoning becomes standard: correlation framed as causation, baselines inferred rather than established, and skepticism replaced by accumulation. That is not how complex systems are understood. It is how stories harden into doctrine.


A black-and-white historical photograph depicting several houses in the foreground with dark storm clouds looming in the background, suggesting an approaching dust storm.

Heat waves are typically defined as prolonged periods of abnormally hot weather relative to local norms, often lasting 2โ€“3+ days with temperatures exceeding a threshold (e.g., 90ยฐF in parts of the U.S. Northeast or percentiles like the 90thโ€“99th of historical data).

Definitions vary by region and agencyโ€”no universal standard existsโ€”leading to criticism that relative thresholds make more events qualify as “heat waves” in a gradually warming world, even without changes in variability.

Critics argue this creates a perception bias: a hot spell that was normal in the past becomes a “heat wave” today due to updated climatology.

Severe heat waves are not new.

The 1930s North American heat wave (amid the Dust Bowl and Great Depression) caused over 5,000 deaths, with widespread 110ยฐF+ temperatures and prolonged droughtโ€”some U.S. records from then still stand.

Other notables include Europe’s 1757 and 2003 events, Russia’s 2010 wave, and pre-industrial extremes like China’s 1743 wave (44.4ยฐC in Beijing).

I

Major power outage in Berlin, police investigate arson

On January 3, 2026, a fire damaged high-voltage cables on a bridge over the Teltow Canal near the Lichterfelde power plant, causing a massive blackout affecting approximately 45,000โ€“50,000 households and over 2,200 businesses in districts including Lichterfelde, Zehlendorf, Nikolassee, and Wannsee.

A woman stands at a bus stop in a snowy urban environment at night, illuminated by car headlights. She carries a suitcase and appears to be checking her phone.

On January 3, 2026, a fire damaged high-voltage cables on a bridge over the Teltow Canal near the Lichterfelde power plant, causing a massive blackout affecting approximately 45,000โ€“50,000 households and over 2,200 businesses in districts including Lichterfelde, Zehlendorf, Nikolassee, and Wannsee.

Berlin police investigate the incident as arson, with a confession letter attributed to left-wing extremists (possibly the “Vulkangruppe”) deemed authentic in security circles. Berlin’s governing mayor, Kai Wegner, described the perpetrators as “evidently left-wing extremists.” This echoes a similar suspected arson attack in September 2025 that disrupted power in southeast Berlin.

Temperatures below freezing and persistent snowfall make the #Stromausfall in #Berlin particularly dangerous. NIUS interviewed passersby and people in the emergency shelters.

On January 4, 2026:

Many residents lack electricity, heating, and hot water amid freezing temperatures and snow.

Authorities evacuated care homes and hospitals partially.

Emergency shelters opened, and police advise residents to stay with relatives, conserve phone battery, and use flashlights.

Power restored to about 7,000โ€“10,000 households via rerouting; full restoration for the majority may take until January 8 due to extensive cable damage and weather challenges.

Berlin declared a major emergency, with the Bundeswehr considering support.

Two silhouetted figures waiting at a bus stop in a dark, snowy street during a power outage.

Power outage in Berlin: 45,000 households without electricity – police investigate arson

From The Blackout News

Police at the scene of a large-scale power outage in Berlin, with snow-covered ground and emergency vehicles visible. A red and white barrier cordons off the area, indicating an ongoing investigation into a fire at a cable bridge over the Teltow Canal.

In the southwest of Berlin, there was a large-scale power outage on Saturday, and the consequences also affected nursing homes. According to Stromnetz Berlin, around 45,000 households and about 2,000 commercial enterprises were affected. At the same time, emergency services secured the supply of critical places. The police are investigating arson as the cause (welt: 03.01.26).

Cause at the Teltow Canal

According to the company, the trigger was the fire of a cable bridge over the Teltow Canal, which damaged several lines to the nearby Lichterfelde power plant. The fire has now been extinguished, but the repair remains complex because several cable harnesses are affected and the network topology cannot be changed at will. Company spokesman Henrik Beuster named the affected districts Nikolassee, Zehlendorf, Wannsee and Lichterfelde, and thus an area with many residential quarters as well as important facilities.

The fire brigade also prepared for a longer scenario early on because the situation remained dynamic and a reliable forecast was missing. She wrote online: “It is still unclear when the power supply will be restored. A longer absence is to be expected.” In addition, it said: “Stromnetz Berlin is working as quickly as possible to find a solution to the problem. At the moment, it is not foreseeable how quickly it can be fixed. At the moment, it must be assumed that the power outage will last longer.”

Safety in the cold: Fire brigade warns and relies on simple measures

Because temperatures in the minus range create additional risks, the fire brigade advises clear precautionary measures, and they are targeting typical sources of danger in apartments. Literally, the advice reads: “Be careful when handling candles – do not leave them unattended. It’s better to use flashlights than candles! Do not use gas-powered heaters and disposable grills indoors. Warm yourself with sweaters and blankets.” In this way, it addresses not only fire hazards, but also the risk of exhaust fumes in enclosed spaces.

At the same time, the police warned that the power outage could also affect mobile communications and landlines. It therefore sent forces to the affected areas. Anyone who urgently needs help should contact emergency services directly or visit a station, because an emergency call in individual streets could temporarily fail. For residents, therefore, the following applies: keep calm, but remain prepared, and keep an eye on neighbors in case there are problems with the elderly or sick.

Large-scale operation in Steglitz-Zehlendorf and commemoration of attack in September

In the district of Steglitz-Zehlendorf, a large-scale operation was underway with several hundred firefighters and other helpers. In addition, volunteer fire brigades and the Federal Agency for Technical Relief were involved. The situation was particularly delicate because there are several nursing homes and hospitals in the area and emergency power and logistics have to be neatly intertwined. According to the fire department, residents and patients from at least two homes were transferred to other facilities.

At the same time, the case brings back memories of September, when a similar power outage in southeastern Berlin lasted for days. At that time, Stromnetz Berlin initially also spoke of around 50,000 affected customers. At the time, the cause was considered to be a politically motivated arson attack on two electricity pylons. This time, too, the police are investigating a possible deliberate fire. It is precisely this suspicion that increases the sensitivity, because the critical infrastructure is increasingly in focus.


Left-wing extremist attack on power supply and the failure of Wegner & Co

From Philisophia- Perennis

By David Berger

A still image from a comedic scene depicting a man in a suit gesturing dismissively in front of a chaotic explosion behind him, with large text overlay stating 'NOTHING TO SEE HERE MOVE ALONG'.

The left-wing extremist attack on Berlin’s power supply exposes serious failures of the Senate under Kai Wegner (CDU) and the federal government in the protection, prevention and crisis management of critical infrastructure. The late political reaction and the recourse to the Bundeswehr seem less like resolute leadership than an admission of a lack of preparation and a failed security policy strategy.

At the weekend, Berlin was shaken by a massive power outage in the southwest of the city – triggered by an apparently targeted arson attack on a cable bridge over the Teltow Canal. Several high-voltage power lines were destroyed, around 45,000 to 50,000 households and over 2,000 businesses were left in the dark, many without electricity and at times without functioning heating systems in freezing temperatures โ€“ a situation reminiscent of infrastructure emergencies, not a well-organized, safe capital city center.

The perpetrator group “Vulkangruppe”, a left-wing extremist group that has been active for years, claimed responsibility for the attack. In their claim of responsibility, they celebrate sabotage as a “necessary step” in the fight against the social system โ€“ regardless of the consequences for the elderly, children, hospitals and general security of supply.

Berlin’s Ahr Valley disaster: Wegner laughs

While the city sank into cold and darkness, the Governing Mayor Kai Wegner (CDU) initially seemed absent – at least in the public perception. According to reports, he did not show up in person on Saturday but stayed in his office and made calls. Only later was the deployment of the Bundeswehr announced. When he turned up laughing at the press conference at noon today, some journalists were a bit irritated by the laughing face he showed at the beginning. Memories of his colleague Laschet and the Ahr Valley disaster were raised.

Clearly, no one expects political leaders to attend every fire brigade operation themselves. But it is precisely in crisis situations โ€“ when people are directly affected and insecure โ€“ that the visibility of those in positions of responsibility is decisive for trust or mistrust in the state and politics. Wegner’s answers seemed more managed than led, more reaction than proactive crisis management.

The chairwoman of the AfD parliamentary group, Dr. Kristin Brinker, is probably not entirely wrong when she remarks on the absence of Kai Wegner on the first day of the power outage in large parts of the southwest of Berlin:

! Another left-wing extremist terrorist attack against Berlin’s infrastructure with tens of thousands of people affected, but the supposedly ‘governing’ mayor is nowhere to be seen and the Senate only manages to convene a crisis team after more than 13 hours โ€“ a greater political failure is hardly conceivable.

It is inconceivable that Wegner is conspicuous by his absence during Berlin’s biggest infrastructure disaster since the Second World War. Instead of being there for the affected citizens on the spot, he apparently thinks he can sit out the situation in his home office or on vacation. This complete ignorance is fatally reminiscent of the failure of political decision-makers during the Ahr disaster Wegner has now disqualified himself as the father of the country at the latest.”

Not only a left-wing extremist, but also a structural problem

The decision to call in the Bundeswehr for support is currently being sold as pragmatic aid โ€“ especially to ensure the supply of the population with hot food, drinks and warmth.

But this step should rather be understood as a political alarm signal: If the civilian authorities and operational structures are no longer sufficient to protect a large city in one of Europe’s most important industrial countries, then this is not only an operational test โ€“ but a symptomatic failure of state precaution and planning. Bundeswehr support must not become a substitute solution because precautionary infrastructure security and rapid, effective crisis responses are insufficiently organized.

The energy policy spokesman of the AfD parliamentary group,ย Frank-Christian Hanselย (here on the outside โ€“ in conversation with the Islam criticย Irfan Peci, among others),ย reacted very quickly to the power outage and presented the completely neglected structural problem, which is particularly severe in Berlin:

“The massive power outage in Lichtfelde, Nikolassee, Wannsee and Zehlendorf is a serious warning signal for the state of Berlin’s energy infrastructure (…) The failure of a single network node was enough to paralyze the power supply and in some cases the entire telecommunications infrastructure over a large area. This makes a central network node problem visible. Critical distribution points are apparently poorly dimensioned and interconnected, so that faults do not remain localized, but cascade entire supply rooms. The redundancy and grid resilience that are often invoked simply does not prove to be given under real conditions.

Security of supply is not an ideological question, but a basic prerequisite for security, the economy and social stability. Today’s incident shows that Berlin needs an honest assessment of its grid node structure and an energy policy that consistently focuses on grid stability and reliability again. The energy supply brought about by the so-called climate policy, sewn on edge, is dangerous to the public.”

Wrong security policy

The question arises: How could it have come to this in the first place? Left-wing extremist acts of sabotage on critical infrastructure are not new โ€“ there have been repeated incidents in Berlin in recent years in which electricity, rail or communication networks have been attacked.

Despite repeated warnings, it seems that security and domestic policy has not taken these developments seriously enough for a long time. The expected early detection, prevention and protection of sensitive infrastructure remained โ€“ so the impression โ€“ a bureaucratic buzzword instead of a strategic obligatory programme. This spectrum also includes the fact that the Office for the Protection of the Constitution and the old parties have been trivializing the threat posed by left-wing extremism as well as Islamization for many years. And instead pay the greatest attention to a largely invented problem of right-wing extremism.

While Berlin struggled with the acute state of emergency, the German government remained conspicuously quiet about structural consequences. Crisis areas in critical infrastructure โ€“ from the power grid to digital networking โ€“ are not only a state but also a federal task. A national protection plan is needed that takes sabotage, terrorism, extremism and hybrid threats seriously. Instead, we are experiencing reactive politics that only get moving when tens of thousands of people are already affected. And which does not indicate that it intends to fight the real enemies of our democracy, freedom and security, but only to defend its “fleshpots” (Sรถder) against the strongest opposition party โ€“ whatever the cost. After all, the others have to freeze.

Seizing the moment for U.S. nuclear energy dominance

Nuclear power delivers clean, reliable baseload energy essential for economic growth, national security, and competing in AI.
U.S. companies lead in advanced reactor designs (e.g., small modular reactors or SMRs), but regulatory hurdles, supply chain weaknesses, and foreign competition (from Russia and China) threaten leadership.

Man sitting at a desk with a serious expression, wearing a suit and tie, in an office setting with an American flag and portraits in the background.

The phrase “Seizing the Moment for U.S. Nuclear Energy Dominance” serves as the title of an op-ed published in CFACT.

Authors Sam Thernstrom, Paul Saunders, and Todd Abrajano argue that the United States must urgently act to revitalize its nuclear sector amid surging electricity demand from AI data centers, manufacturing resurgence, and grid strain.

Nuclear power delivers clean, reliable baseload energy essential for economic growth, national security, and competing in AI.

U.S. companies lead in advanced reactor designs (e.g., small modular reactors or SMRs), but regulatory hurdles, supply chain weaknesses, and foreign competition (from Russia and China) threaten leadership.

A digital artwork featuring a nuclear power plant with a large American flag overlay, symbolizing U.S. nuclear energy dominance and innovation.

From CFACT

By Sam Thernstrom,ย Paul Saunders,ย Todd Abrajano

A close-up of pink flowers in a garden with cooling towers of a nuclear power plant in the background, illustrating the harmony between nature and nuclear energy.
A stunning scene showcasing pink flowers blooming in a garden with industrial cooling towers in the background, blending nature and human-made structures against a striking sky.

As Americaโ€™s electric grid faces an unprecedent strain, nuclear power has never been more promising nor more important. Nuclear energy provides clean, reliable power that is vital to our economy and national security. American companies are pioneering some of the most promising advanced reactor designs in the world, but they will not succeed without effective government support for nuclear energy.

Americaโ€™s nuclear renaissance has been long delayed by regulatory and financial barriers, but that is rapidly changing. In May, President Trump signed a series of executive orders designed to accelerate reactor licensing and reform regulations, with a goal of bringing 300 gigawatts of new nuclear capacity online by 2050, effectively quadrupling the reactor fleet. A recently announced framework agreement with Westinghouse, Brookfield and Cameco to invest $80 billion in building 10 new, advanced nuclear plants in the United States is an important step towards fulfilling that vision.

The plan reflects the Administrationโ€™s understanding of two key facts:  Effective government policy support is needed to jumpstart a resurgence of nuclear power; and success depends upon building new reactors in series, not just one or two. That allows companies to establish robust supply chains and secure the manufacturing scale that drives cost-reductions.

While these initiatives indicate important momentum, further federal action will be critical to our success. To evaluate policy options, we convened a bipartisan Working Group on U.S. Nuclear Energy Dominance earlier this year, comprising former senior officials, industry representatives, and subject-matter experts; they identified key priorities for the Administration and Congress to consider.

First, the federal government should provide robust support for a series of new nuclear plants. Every first-of-a-kind plantโ€”including nuclearโ€”entails risks of delay and cost overruns. The Westinghouse agreement recognizes that building multiple plants of the same design is essential. Other countries have achieved impressive cost reductions through sequential construction, and Americaโ€™s existing nuclear fleetโ€”the largest and most reliable in the worldโ€”was built using this model.

Beyond Westinghouse, the United States has a wealth of innovators working to commercialize advanced small modular reactors. Congress and the Administration should facilitate construction of multiple units of the most promising designs. Early federal backing for the initial plants in a series can be decisive in unlocking private capital. Reducing investor risk through targeted insurance mechanisms and measures that prevent costly delays would boost deployment. Enactment of the ARC Act would be a sensible first step in this direction.

Second, the Nuclear Regulatory Commission (NRC) must license a growing number of designs and construction projects safely and efficiently. Workforce reductions at a time of potential agency restructuring and rapidly growing responsibilities will hinder progress. Congress should ensure that the NRC has adequate resources and staff to achieve President Trumpโ€™s nuclear energy goals.

Congress should also ease the licensing burden on small, innovative reactor developers. The NRC is funded almost entirely through industry feesโ€”more than $800 million annuallyโ€”while agencies like the Environmental Protection Agency use taxpayer funds to support its work regulating other power generators. Nuclear should be treated no differently.

And Congress should adopt selected reforms to ensure that licensing review is proportionate to risk. For example, amending the Atomic Energy Act so that the Advisory Commission on Reactor Safeguards reviews only new or novel license applications, rather than all applications, would streamline the process without compromising safety.

The bipartisan Refuel Act is another example of a commonsense adjustment to reflect evolving technologies. There are new technologies and processes for recycling used fuel that never isolate plutonium; it is appropriate to differentiate their regulatory review from the traditional processes that do produce plutonium.

Third, expansion of Americaโ€™s nuclear industry will require a rapid build-out of our nuclear workforce and supply chain. Along with nuclear engineers, the industry will need thousands of skilled construction and maintenance workers and reactor operators. Supporting series production of both large reactors and small modular reactors will send an important demand signal to both suppliers and manufacturers. As the Department of Energy (DOE) supports series production of both large and small reactors, it should also use the Office of Energy Dominance Financing to support investments by suppliers and manufacturers. But expanding supply chains will take time; in the near term, lowering tariffs on essential imports would reduce both reactor costs and downstream electricity prices.

Fuel is equally essential, and there too, we lost our supply chain when we stopped building nuclear plants. Congress and DOE have provided initial support for uranium mining and enrichment firms and nuclear fuel fabricators, but more must be done to ensure predictable, long-term demand for suppliers. Congress should also encourage emerging private-sector efforts to recycle used fuel.

As electricity demand rises and global competitors accelerate their own nuclear programs, restoring U.S. leadership in nuclear energy is essential to ensuring reliable, affordable, and resilient power for decades ahead.

This article originally appeared at Real Clear Energy

Expect Soon Another PIK Paper Claiming Warming Leads to Cold Snaps Over Europe

The post argues that, as cold weather hits Europe (raising public doubts about global warming amid high energy costs), researchers from the Potsdam Institute for Climate Impact Research (PIK) might soon publish a paper attributing these cold snaps to climate changeโ€”specifically via mechanisms like reduced Arctic sea ice weakening the polar vortex and causing a wavier jet stream that allows cold air to spill southward.

A person bundled in warm clothing, with snow and ice covering their face, against a cold backdrop, accompanied by the text 'GLOBAL WARMING' in large letters.

The phrase “Expect Soon Another PIK Paper Claiming Warming Leads To Cold Snaps Over Europe” is blog post published by NoTricksZone.

It appears to be a satirical or mocking prediction amid an ongoing cold spell in Europe in early January 2026.

The post argues that, as cold weather hits Europe (raising public doubts about global warming amid high energy costs), researchers from the Potsdam Institute for Climate Impact Research (PIK) might soon publish a paper attributing these cold snaps to climate changeโ€”specifically via mechanisms like reduced Arctic sea ice weakening the polar vortex and causing a wavier jet stream that allows cold air to spill southward.

PIK scientists (e.g., Stefan Rahmstorf, Dim Coumou, and earlier Vladimir Petoukhov in a 2010 paper) have indeed promoted this hypothesis in past winters. They link rapid Arctic warming (Arctic amplification) to more persistent or extreme mid-latitude cold events in Eurasia and Europe.


From No Trick Zone

Byย P Gosselinย 

Winter across Europe has been on the mild side so far โ€“ just as predicted by global warming alarmists. But now the weather is about to turn cold.

A cold winter spell is beginning to settle over Europe and thereโ€™s a risk the public here might start having doubts about the global warming narrative โ€“ especially as heating bills skyrocket and gas reserves run out. Thus, letโ€™s not be surprised if climate-alarm suspects soon rush out another dubious paper claiming that extreme winter cold, too, is a telltale sign of warming.

Just-so story science

This was the case earlier. For example, in 2010, in the middle of a bitter cold winter, PIK scientists Petoukhov et al published a paper, โ€œA link between reduced Barents-Kara sea ice and cold winter extremes over northern continentsโ€ that found that sea ice loss in the Barents-Kara Seas could triple the probability of cold winter extremes in Europe.

In 2019, Kornhuber et al published a paper, Extreme weather events in early summer 2018 connected by a recurrent hemispheric wave-7 pattern that focused on summer heatwaves, This research tracks the โ€œresonant amplificationโ€ of planetary waves that allegedly causes cold air to spill south and stay there for weeks.

PIK researchers, particularly Vladimir Petoukhov, suggest to have identified a specific non-linear relationship, and claim the atmosphere reacts most violently when sea ice concentration is around 40โ€“80% in certain Arctic regions. When the ice disappears, the ocean releases a massive โ€œbubbleโ€ of heat into the cold winter air, thus creating a local high-pressure system (an anti-cyclone) over the Arctic. This high-pressure system acts like a physical wall that pushes the Jet Stream south and forces cold, continental winds from Siberia to blow westward into Europe.

Stefan Rahmstorf and his team have also championed the theory, arguing that Arctic warming makes the โ€œwavesโ€ in the Jet Stream grow much larger and to move much slower. So, you see warming also leads to unusual cold and harsh winter events across Europeโ€

As of January 2026, the Potsdam Institute for Climate Impact Research (PIK) and the broader scientific community have been tracking a highly unusual set of Arctic signals they believe align with the โ€œless ice = harsher wintersโ€ mechanism (AMOC slowing, Tipping Points Report in October 2025, and the Arctic Report Card 2025 released just weeks ago.)

According to the PIK, we are no longer looking at โ€œfuture risksโ€ but rather the live observation of a destabilized system where low ice is creating a โ€œheat domeโ€ over the pole and is forcing the Jet Stream into a โ€œstuckโ€ position, leading to the current cold snaps.

A stylized drawing of a giraffe standing in a savanna landscape with trees in the background.
Just-so science: Giraffes have long necks to reach high leaves. Image generated by Grok AI.ย 

While the climate scientitsts insist this is well-grounded climate science, skeptics see it for what it really is: a โ€œjust-so storyโ€ filled with pseudo-profound bullshit and science sophistry. It sounds perfectly logical and satisfying (e.g., giraffes have long necks to reach high leaves), but it lacks empirical evidence to prove itโ€™s actually how things happen.

Surprise! A $600 Million Insect Protein Animal Feed Business Just Went Bankrupt

A French insect farming startup that specialized in producing mealworm-based protein primarily for animal feed (aquaculture, livestock, and poultry) and pet food, with some exploration into fertilizers and limited human applications.

Close-up view of mealworms on a conveyor belt in a farming facility, with green plastic bins in the background.

A French insect farming startup that specialized in producing mealworm-based protein primarily for animal feed (aquaculture, livestock, and poultry) and pet food, with some exploration into fertilizers and limited human applications.

An industrial insect farming facility featuring large transparent containers filled with mealworms, alongside workers examining the production area with machinery in the background.

From Watts Up With That?

Essay by Eric Worrall

A modern insect farming facility with mealworm production equipment and a group of professionals discussing operations.

First published JoNova, Tom Nelson โ€“ Even starving dogs wouldnโ€™t eat their product?

How reality crushed ลธnsect, the French startup that had raised over $600M for insect farming

Anna Heim
2:52 PM PST ยท December 26, 2025

French startup ลธnsect shot into the spotlight when โ€œIron Manโ€ star Robert Downey Jr. touted its merits on the โ€œLate Showโ€ during Super Bowl weekend 2021. Now, nearly four years later, the insect farming company has been placed into judicial liquidation โ€” essentially bankruptcy โ€” for insolvency. 

โ€ฆ

And revenue was the problem. According to publicly available data, ลธnsectโ€™s revenue from its main entity peaked at โ‚ฌ17.8 million in 2021 (approximately $21 million) โ€” a figure reportedly inflated by internal transfers between subsidiaries. By 2023, the company had racked up a net loss of โ‚ฌ79.7 million ($94 million).

โ€ฆ

But the vision collided with market reality. Animal feed is a commodity market driven by price, not sustainability premiums. โ€ฆ

โ€ฆ

The 2023 pivot to pet food came too late. By then, ลธnsect had already committed to a massive, capital-intensive bet that would ultimately doom the company. That bet was ลธnfarm, a โ€œgiga-factoryโ€ in Northern France that the company billed โ€œthe worldโ€™s most expensive bug farm.โ€ Built for insect production at scale, the facility consumed hundreds of millions in funding โ€” money spent before ลธnsect had proven its business model or figured out its unit economics.

โ€ฆRead more: https://techcrunch.com/2025/12/26/how-reality-crushed-ynsect-the-french-startup-that-had-raised-over-600m-for-insect-farming/

I love it when green activists and clueless Hollywood celebrities think they know how to run a business.

The fools blew hundreds of millions of dollars on a giant production plant, only to discover their target market didnโ€™t exist. By the time they realised their original plan was a bust, they used internal transfers to inflate reported revenue, then tried to retool their plant for their new target market. But there wasnโ€™t enough money left to solve their retooled plant production problems, so they ran out of cash.

Anyone who has ever run their own business knows that if possible, you start small and field test your ideas, even if you have lots of capital burning a hole in your pocket. No business plan survives contact with reality, you have to test and refine your plan, and if necessary, completely ditch the original plan and pivot into doing something new, while preserving as much capital as possible for the big push once your idea starts to generate revenue.


A researcher in protective gear inspecting mealworm substrate in a laboratory setting, surrounded by containers of insect farming material.

Details:

  • Raised over $600 million (approximately โ‚ฌ600 million) in funding since 2011 from high-profile investors, including Robert Downey Jr.’s FootPrint Coalition, venture firms like Astanor Ventures, and significant public money from France’s Bpifrance and taxpayer subsidies.
  • In late December 2025, a French commercial court placed the company into judicial liquidation (the French equivalent of bankruptcy) due to insolvency, after months of financial struggles, failed restructuring attempts, and inability to secure additional funding.
  • The company’s massive “ลธnfarm” facility in Amiens, Franceโ€”billed as the world’s largest and most advanced insect farmโ€”became a major money sink, costing hundreds of millions before proving viable economics.

Failure:

Despite the hype around sustainability (insects as a low-impact alternative to soy or fishmeal), the business collapsed because:

  • Animal feed is a low-margin commodity market where buyers prioritize the cheapest optionโ€”insect protein was 2โ€“10 times more expensive than traditional sources.
  • Scaling issues โ†’ production challenges (diseases, parasites, inconsistent quality), high energy and input costs, and reliance on feedstocks that weren’t truly “waste-based” at scale.
  • Revenue never took off โ†’ peaking at around โ‚ฌ18 million (~$21 million) in 2021, with massive losses (e.g., โ‚ฌ80 million net loss in 2023).
  • A late pivot to higher-margin pet food came too late to save the overbuilt infrastructure.