Global warming, climate change, all these things are just a dream come true for politicians. I deal with evidence and not with frightening computer models because the seeker after truth does not put his faith in any consensus. The road to the truth is long and hard, but this is the road we must follow. People who describe the unprecedented comfort and ease of modern life as a climate disaster, in my opinion have no idea what a real problem is.
Javier Vinós, a Spanish scientist (PhD in molecular neurobiology turned independent climate researcher), author of books like Climate of the Past, Present and Future and Solving the Climate Puzzle, and president of the Asociación de Realistas Climáticos, published an opinion piece titled “Seis cosas imposibles de creer” (Six Impossible Things to Believe) on December 23, 2025, in Libertad Digital. Echoing the White Queen’s boast in Lewis Carroll’s Through the Looking-Glass of believing “as many as six impossible things before breakfast,” Vinós argues that European and Spanish authorities are asking citizens to believe six implausible claims about climate change and the energy transition.
Javier Vinós: Seis cosas imposibles de creer
Javier Vinós, a Spanish scientist (PhD in molecular neurobiology turned independent climate researcher), author of books like Climate of the Past, Present and Future and Solving the Climate Puzzle, and president of the Asociación de Realistas Climáticos, published an opinion piece titled “Seis cosas imposibles de creer” (Six Impossible Things to Believe) on December 23, 2025, in Libertad Digital.
Echoing the White Queen’s boast in Lewis Carroll’s Through the Looking-Glass of believing “as many as six impossible things before breakfast,” Vinós argues that European and Spanish authorities are asking citizens to believe six implausible claims about climate change and the energy transition.
Javier Vinós provides the list in his yearend Clintel post Six Impossible Things to Believe. Excerpts in italics with my bolds and added images.
Like Alice’s White Queen, European and Spanish authorities want us to believe six impossible things about climate change and the energy transition.
In Alice Through the Looking-Glass, a character by Lewis Carroll says, “One can’t believe impossible things,” to which the White Queen replies, “When I was your age, I sometimes believed as many as six impossible things before breakfast.”
Like Alice’s White Queen, European and Spanish authorities want us to believe six impossible things about climate change and the energy transition, before and after breakfast. These six impossible things to believe — and yet many people, like the White Queen, do believe them — are as follows:
The first is believing that humanshave — or could have in the near future — some degree of control over the climate and the weather,and that through our actions we can reduce the frequency and intensity of hurricanes, floods, droughts, or sea-level rise. Anyone who believes this is capable of believing anything.
The second is believing that the climate, in its extraordinary complexity with hundreds — perhaps thousands — of variables, is controlled by just one: changes in the concentration of greenhouse gases. The theory and models that propose this are based on a good understanding of the properties of CO₂, but a poor understanding of the other climatic variables. And the fact that no solid evidence for this theory has emerged, despite decades of intensive searching, makes it very difficult to believe.
The third is believing that an energy transition is taking place or will take place. There are no examples of energy transitions. We use more biomass, coal, oil, natural gas, and uranium than at any other time in history, and we are simply adding the so-called renewable energies, which are installed, maintained, and replaced thanks to hydrocarbon fuels. Our energy use is growing faster than our capacity to install renewable energy. The transition is a myth, and anyone who claims to believe in it is either lying or poorly informed.
The fourth is believing that the use of hydrocarbon fuels is going to be abandoned. At the recent climate conference in Brazil, a group of countries, including Spain, pushed for the agreement to include a roadmap for abandoning those fuels. They were forced to back down, and hydrocarbon fuels are not even mentioned in the final agreement. Eighty-three governments supported that roadmap, but together they represent only 13.6% of the world’s population. The remaining 86.4% shows no intention of abandoning the source from which the human species obtains 85% of its external energy.
It is impossible to believe that such an abandonment will take place because, 33 years after the United Nations Framework Convention on Climate Change and 10 years after the Paris Agreement, support among nations for abandoning hydrocarbon fuels has decreased rather than increased.
The fifth is believing that a reduction in global CO₂ emissions will occur. These emissions are linked to human development and population growth. Many regions of the planet remain underdeveloped, and the world’s population will continue to grow in the coming decades.
Since the first climate conference in Berlin in 1995, where strict emission-reduction commitments were adopted — but only for “developed” nations — global CO₂ emissions have increased by 70%. These 30 years should be enough to convince anyone that they are not going to stop rising.
The Fantasy
The sixth is believing that energy can be decarbonized. Only 23% of the EU’s final energy consumption is electricity, and only 70% of that electricity comes from carbon-free sources. One third of it comes from nuclear energy, which Spain rejects and which was installed in the last century. So far this century, the EU has managed to decarbonize less than 10% of the energy it uses. Most of the planet is not even trying.
These six things are impossible to believe, but if we refuse to believe even just one of them, the entire climate and energy strategy of the European Union and the Spanish government is revealed as a tragic farce. Based on these impossibilities, our national and European governments have committed themselves to a transition whose consequences we are already suffering:
♦ more expensive energy, ♦ declining industrial production and competitiveness, ♦ increased risk to the power grid, ♦ environmental policies with tragic consequences, ♦ greater indebtedness, and, ultimately, ♦ an accelerated decline of Europe relative to the rest of the world.
Here is a summary of the six impossible things he lists (translated and paraphrased from the original Spanish article):
Believe that climate change is an emergency Despite decades of warnings, extreme weather events and climate-related impacts have not worsened as predicted. Data shows no clear upward trend in disasters or deaths when adjusted for population and exposure.
Believe that renewable energies (wind and solar) are cheaper than fossil fuels Intermittent renewables require massive backups, grid reinforcements, and subsidies, making the overall system costlier. True levelized costs, including reliability, favor dispatchable sources.
Believe that electric vehicles are more environmentally friendly Accounting for mining, battery production, electricity generation (often coal-based in many grids), and disposal, EVs have a higher lifecycle environmental footprint than efficient internal combustion engines in many cases.
Believe that hydrocarbon fuels will be abandoned Despite 33 years since the UN Framework Convention on Climate Change and 10 years since the Paris Agreement, global support for phasing out oil, gas, and coal has decreased, not increased. Demand continues to rise, especially in developing nations.
Believe that the energy transition will reduce energy poverty Policies driving up energy prices (via subsidies for renewables and restrictions on fossils) are exacerbating energy poverty in Europe, forcing households to choose between heating and eating.
Believe that these policies will significantly affect the climate Even if fully implemented, unilateral actions by Europe and Spain would have negligible impact on global temperatures, as emissions growth is driven by Asia and developing countries. The effect is symbolically tiny compared to natural variability.
Vinós concludes that these “impossible” beliefs underpin costly policies that deliver little climatic benefit while imposing economic and social harm.
He advocates for realistic, evidence-based approaches over alarmism and ideological transitions.
This piece aligns with Vinós’s broader skeptical stance on mainstream climate orthodoxy, emphasizing natural variability (e.g., solar influences, meridional heat transport) over CO₂ dominance.
His views are popular in realist/skeptic circles but controversial in consensus climate science.
The Trump Administration’s Fight To Fund Scientists is a December 2025 investigative article by Paul D. Thacker.
The piece argues that the Trump administration’s efforts to reform federal research funding—particularly by capping indirect costs (overhead rates) in NIH grants—aim to redirect more money from university administrators to actual scientists conducting research.
The Trump Administration’s Fight To Fund Scientists is a December 2025 investigative article by Paul D. Thacker.
The piece argues that the Trump administration’s efforts to reform federal research funding—particularly by capping indirect costs (overhead rates) in NIH grants—aim to redirect more money from university administrators to actual scientists conducting research.
The article represents a perspective sympathetic to the administration’s cost-cutting rationale, highlighting long-standing debates over how federal dollars (primarily from NIH, ~$47B annual budget) are allocated between direct research and institutional overhead.
The panic and outrage were palpable last February when President Trump announced plans to trim reimbursement rates for government-funded scientific research.
“This is going to decimate U.S. scientific biomedical research,” Northwestern University biologist Carole Labonne told Bloomberg. “The lights will go out, people will be let go, and these [medical] advances will not occur,” David Skorton, CEO of the Association of American Medical Colleges, told PBS. “The goal,” University of Washington biologist Carl Bergstrom warned on BlueSky, “is to destroy U.S. universities.”
The sky has not fallen on American research in the 10 months since. The National Institutes of Health (NIH) is still paying the same 50% to 70% in indirect costs – the premium added on top of grants meant to reimburse universities for providing labs and other research infrastructure – because lawsuits have frozen the president’s proposed policy. One Trump official admits this is unlikely to change because the administration will almost certainly lose in court. The current system, which provides the lion’s share of billions of dollars each year for often-unspecified overhead costs to universities, has the backing of Congress. As it stands, there appears to be no momentum, even among Republicans, to reform the practice.
“It’s basically a slush fund,” one NIH official told RealClearInvestigations. “We just don’t like to call it that.”
A RealClearInvestigations analysis of these indirect payments reveals a long, largely forgotten history of concern about taxpayer-sponsored research. Although many researchers have cast Trump’s proposal as an attack on science, this issue isn’t the need to fund research activities that sometimes lead to beneficial discoveries, but whether some of the billions that support the necessary infrastructure and equipment are actually being shifted to purposes such as staffing and buildings that have little or no direct connection to the actual research.
In the late ’80s, Stanford faculty revolted against the university’s high overhead charges for diverting research dollars to a bloated administration and a campus building frenzy. Those concerns are still voiced by some.
“If the universities truly believe that it takes 60-70% of a research grant to provide facilities, utilities, and other basic support, then that is easy to prove by opening the books,” said Sanjay Dhall, a research physician at the University of California, Los Angeles. “I suspect however, that opening the books would reveal that a significant chunk of these funds, or even the majority, are paying an army of unnecessary administrators.”
At a time when the value of college is being challenged because of exorbitant tuition and fees, and the federal government is struggling to rein in debt, the story of indirect funding offers a window into the history of runaway costs and the growing power of college officials. RCI has also learned that NIH Director Jay Bhattacharya has been selling a new plan that makes the grant process more competitive for institutions that were overlooked in the past.
Indirect Costs Hard To Define
Distributing over $37 billion in grants every year, NIH is the largest funder of biomedical research on the planet, far exceeding the European Commission, which spends around $12 billion, and dwarfing the Gates Foundation’s $1 billion.
Every NIH grant a university researcher receives provides two categories of funding: direct and indirect costs. The direct costs include all items the researcher submitted as part of the project’s budget, from laboratory equipment to a percentage of salaries.
Indirect costs are harder to define. The funding goes to administrators, and how they use it is shrouded in mystery. What’s more, indirect rates vary from university to university for reasons that few understand and can explain.
“How do you think Harvard built all those buildings?” one NIH official, a graduate of Harvard Medical School who insisted on anonymity, told RCI. “NIH indirect costs paid for that.”
When Trump first proposed the 15% cap in 2016, Harvard president Drew G. Faust told the student newspaper in late 2017 that she flew to Washington, D.C., to lobby Republicans in both the House and the Senate to stop it. “We’re bringing in quite a bit of money through federal contracts which provide money for a lot of buildings and other infrastructure that makes possible what we do going forward,” a Harvard dean told the student newspaper. “So if that was to all go away, we’d have to sit down and look at that.”
The Trump administration’s proposal to cap overhead at 15% would cost university administrators billions of dollars that they control. Among the many critics was Holden Thorp, editor-in-chief of the flagship journal Science and a former university administrator. He wrote an editorial last February titled “A Direct Hit” that described the cap as a “ruthless takedown of academia.”
“The scientific community must unite in speaking out against this betrayal of a partnership that has enabled American innovation and progress,” he wrote.
In response to questions from RCI, Thorp said any change to NIH overhead funding should be done in partnership with the scientific community. “Indirect costs are used to secure debt on research facilities and were treated as very secure by banks and the rating agencies,” Thorp said. “Pulling all of that abruptly – without following processes with decades of precedent – is certainly betraying a partnership by putting the universities in difficulty with their lenders and bond ratings.”
Inexorable Rise in Charges
It turns out that concerns over universities possibly misusing federal grant money date back more than half a century, according to Thorp’s own publication. In 1955, the federal government almost doubled the 8% premium paid for university overhead. A decade later, Science reported that Congress lifted the overhead ceiling to 20%, maintaining a flat rate to assure more taxpayer dollars were targeted at scientific research, and less spent on constructing new buildings. Some members of Congress believed that “the universities need not accept the grants if they can’t afford them.” Elected officials also worried that indirect costs would not go to research but to support other university efforts.
“You might be surprised if you read the list of money being spent for research in various universities,” one senator said in a 1963 Science news story. “Not only to pay the teachers, but also to construct buildings and facilities around the school.”
Despite these concerns, lobbyists convinced the government in 1966 to remove all caps, empowering universities to negotiate directly with federal agencies to set their own overhead rates. In 1966, overhead consumed 14% of NIH grant expenditures. By the late 1970s, it consumed 36.4%. When the federal government attempted to backpedal in 1976 to bring “spiraling indirect cost rates under control,” it failed.
Both Republicans and Democrats have long championed increasing NIH budgets, partly because grants for research land in congressional districts scattered across the nation. Republicans have often been the NIH’s biggest supporters. Fifteen years ago, Congress launched investigations into the NIH’s poor monitoring of grants that were awarded to research physicians with undisclosed ties to the pharmaceutical industry. Despite the unfolding scandal, Republican Sen. Arlen Specter pushed through a 34% increase in the NIH’s budget in 2009. During the 2013 government shutdown, the NIH was one of the few agencies that Republicans pushed President Obama to keep open. Two years later, Republicans cut many parts of Obama’s proposed 2015 budget, yet gave the president even more money than the increase he requested for the NIH.
Like some elected officials, academics have also long complained that high overhead harms academic scientists by diverting NIH funding to administrators. In 1981, a University of California researcher published a study in Science, which showed how “Funding has thus been markedly reduced, and this has become a critical factor limiting research support in the United States.”
By 1983, indirect costs accounted for 43% of the NIH grant budget. In response, then-NIH Director James B. Wyngaarden pushed to make more money available for scientists by paying administrators only 90% of what they claimed in overhead.
“[L]egislators tend to sympathize with the investigators who are more interested in seeing federal money spent for equipment and researchers’ salaries in their labs than for light and heat and the services of typists and bookkeepers,” reported Science at the time.
However, Science reported that Wyngaarden was met with stiff opposition from university officials and their allies in Congress.
When Wyngaarden tried to deal with the matter by sending a report to Congress, Science reported, officials from several university lobby groups shut the report down, calling it not “acceptable.”
One of Wyngaarden’s biggest critics was Stanford President Donald Kennedy, whose school was then charging one of the highest rates for indirect costs. Kennedy convened a group to attack cost-saving proposals, stating in a letter, “The NIH proposals to reduce reimbursement of those costs … will directly damage the research effort as a whole.”
This effort appeared to succeed until Kennedy himself became ensnared in a scandal that showed Stanford’s indirect costs charged to the NIH paid for a bevy of personal goods and upkeep on a yacht.
Stanford’s Taxpayer-Funded Yacht
Stanford’s yacht, the Victoria, was valued at $1.2 million and became a symbol of excess, with walnut and cherry paneling, brass lamps, marble counters, and lavish woodwork. Administrators used the yacht as a fundraising venue to wine and dine campus bigwigs. NIH money had paid for overhead to maintain it.
As Congress and federal investigators dug into Stanford’s accounting, they discovered that administrators had also redirected NIH research overhead to pay $2,000 a month for flowers at President Kennedy’s home, $7,000 for his bed linens, and $6,000 to provide him with cedar-lined closets. Another college official had hosted Stanford football parties and charged the NIH $1,500 for booze.
Humiliated in the media, Stanford was forced to lower the indirect rate it charged the NIH from 78% to 55.5%, and federal agencies launched audits of overhead charges at dozens of other universities, resulting in millions of dollars returned to the NIH.
With the politics and the media on his side, Michigan Congressman John Dingell launched reforms to indirect charges. Stanford and other institutions were forced to halt expensive building campaigns. President Clinton proposed a cap on indirect costs in a “concerted effort to shift national spending from overhead to funding research.” As in the past, universities opposed the change, and the White House buckled.
“One way or another, I’ve been involved in controversy about indirect cost rates for about 30 years,” a chancellor at the University of Maryland told The Baltimore Sun in 1994.
Kennedy resigned from the Stanford presidency, as did several of his administrators. Kennedy later joined Science as editor-in-chief – a predecessor to Thorp – while universities’ charges for indirect costs to the NIH eventually snapped back to their former pricing, which continues to this day.
RCI spoke with several academic researchers at institutions scattered across the U.S., working at both private and public-funded universities. None wished to be named about their concerns about how their administrators spend NIH indirect funding, with one professor noting that administrators determine your career, so it makes no sense to criticize their spending habits.
While university presidents say administrators strictly account for NIH indirect funds, the reality appears to be different. Professors who bring in large sums of NIH money, sometimes referred to as heavy hitters, can complain and get some of the indirect costs back from the administrators for their own research and even personal use. At some institutions, department heads can get a cut of the indirect costs to set up slush funds, monies they can dole out to favored professors, or even divert to their own labs.
Professor Dhall said that after he published a March letter in the Wall Street Journal that supported Trump’s cap on indirect rates, he was contacted by colleagues across the country. “They congratulated me on going public and vehemently agreed, in private,” he said.
A congressional staffer who has spent decades investigating problems at the NIH said that nobody truly understands how universities negotiate their NIH overhead rates. And once that money gets to the university, it disappears into a byzantine accounting system that seems designed to confuse government auditors, who rarely inspect university books.
“It’s a complete black box,” he said. “I wish someone could explain it to me.”
Trump’s Play To Change the Game
The Trump administration will lose the fight to cap indirect costs at 15%, a senior HHS official told RCI, because of the universities’ outsize influence. During the first Trump administration, universities caught wind that Trump planned to cap overhead rates. As they had done for over half a century, university lobbyists ran to Congress to complain, only now they sought an alliance with the pharmaceutical industry.
Responding to lobbying pressure, Republicans in the House and Senate inserted a provision into the appropriations bill in 2018 to block Trump’s attempt to change universities’ indirect cost rates. That provision has been included in every succeeding appropriations bill.
While it does not seem likely that Congress will strip the schools in their states and districts of billions of dollars in funding, NIH Director Bhattacharya has been floating his own proposal to revamp indirect payments to make them more equitable in private talks with members of Congress and university leaders. Shortly before Thanksgiving, Bhattacharya gave a dinner talk to the Republican Main Street Caucus, a group of 85 GOP members of Congress who are critical behind-the-scenes players among Republicans now running the House.
A dinner participant recounted to RCI that Bhattacharya noted that more than half of the NIH’s money goes to 20 universities located on both coasts. These elite universities win a lion’s share of the grant money, including indirect costs, because they have the money to attract excellent scientists, in part because NIH money helped them build great infrastructure.
This creates a vicious cycle that guarantees NIH will continue to fund institutions that have already won past NIH money – and which charge high indirect costs. To end this cycle, Bhattacharya wants to break off indirect costs into a separate category of infrastructure grants that universities can compete to win.
During the talk, Bhattacharya said that all the universities in the entire state of Florida now get as much money as Stanford. Yet, there’s no reason Florida could not become a hub for scientific research if the federal government invested in its scientific infrastructure.
If Florida can provide lab space at a lower cost than Stanford, he said, they should get the money. Bhattacharya also wants to make it easier for academics to take their grant to different universities. If a Harvard researcher is offered more space or better facilities at a university in Kansas, because building costs there are cheaper, that professor should be able to transfer his grant.
The NIH already provides specific grants for infrastructure, and the hope is that spreading the billions in indirect costs across the country will gain political support.
“He wants to get this money out to the middle of the country, not just the coasts,” said Congresswoman Mariannette Miller-Meeks, Republican from Iowa. Dr. Miller-Meeks is one of the few physicians in Congress and said she was impressed with Bhattacharya’s talk at the Main Street Caucus dinner. However, she is uncertain whether Democrats would embrace the new proposal in today’s polarized environment.
“I would think there are members from the center of the country that would like to see more money in their district,” she said.
A spokesperson told RCI that NIH remains focused on ensuring that funding is used efficiently and that direct and indirect costs contribute to scientific productivity. “Bhattacharya’s proposal represents one of several ideas being discussed publicly about how to structure federal support for research infrastructure,” the spokesperson said. “NIH looks forward to continuing to work constructively with Congress on this issue.”
This article was originally published by RealClearInvestigations and made available via RealClearWire.
According to the latest available data from the U.S. Energy Information Administration (EIA) for October 2025, the national average residential electricity price is 17.98 cents per kilowatt-hour (kWh). Prices vary significantly by state, ranging from 12.39 cents/kWh in Louisiana to 39.74 cents/kWh in Hawaii.
According to the latest available data from the U.S. Energy Information Administration (EIA) for October 2025, the national average residential electricity price is 17.98 cents per kilowatt-hour (kWh).
Prices vary significantly by state, ranging from 12.39 cents/kWh in Louisiana to 39.74 cents/kWh in Hawaii.
To assess the “blue vs. red” divide, I classified states based on their 2024 presidential election outcomes (states voting for Kamala Harris as blue/Democratic-leaning, and those for Donald Trump as red/Republican-leaning, treating split-vote states like Maine and Nebraska by their overall lean).
Blue states (e.g., California, New York, Massachusetts) have an average price of 23.60 cents/kWh, while red states (e.g., Texas, Florida, Ohio) average 15.44 cents/kWh.
This means blue-state residents pay about 53% more on average than those in red states.
Here’s a table of the 10 highest- and lowest-priced states, including their 2024 election lean (blue or red) for context:
Electricity meters with flying dollar banknotes and high voltage towers outdoors at sunset. Paying bills
Americans are anxious about their utility bills – and with good reason. Three quarters of U.S. residents are concerned about their electricity and gas bills rising this year, and 80% feel powerless over how much they are charged for utilities. For nearly two-thirds of U.S. billpayers, simply keeping the lights on has become a growing source of financial stress.
Those concerns are grounded in reality. U.S. electricity prices rose 27% during the Biden administration and another 11% between January and September 2025. Yet despite a national narrative eager to blame President Trump’s One Big Beautiful Bill Act (OBBBA), the real drivers of high electricity prices are far closer to home.\
Electricity affordability is shaped primarily by state policy choices, and states choosing the most expensive path are overwhelmingly blue. So, blue-state residents are experiencing the pain much more than those in red states.
A new report from Always On Energy Research and the Institute for Energy Research finds that 86% of states with electricity prices above the national average voted for Democratic presidential candidates in 2020 and 2024. In contrast, 80% of the 10 states with the lowest electricity prices are reliably red. That’s not a coincidence. Those high prices reflect a consistent pattern of state-level energy policies that dictate emissions reduction targets at the expense of affordability, reliability, and physics.
States have the exclusive power to decide which resources supply their grids under the Federal Power Act. Governors, legislatures, and public utility commissions – not the White House – decide whether to impose renewable portfolio standards (RPS), enforce Net-Zero mandates, or prematurely retire reliable power plants. Those decisions directly determine how much families and businesses pay for electricity.
Today, 28 states enforce an RPS, requiring a certain percentage of retail electricity sales to come from renewable sources, and 16 states have 100% clean energy standards (CES) or carbon-free mandates. Many of these policies compel utilities to overbuild intermittent generation, such as wind and solar, thereby requiring significant investments in transmission, grid-scale storage, and backup generation to maintain reliability. The result is a higher total system cost, which is passed onto ratepayers in the form of higher electricity rates.
Consider that the U.S. average electricity price between January 2025 and August 2025 was 13.54 cents per kilowatt-hour. Each of the five most expensive states mandates 100% of their electricity come from renewable or carbon-free sources in the coming decades. Eight of the 10 states with the lowest electricity prices voted for the Republican presidential candidate in 2020 and 2024, and seven of the 10 don’t have renewable or carbon-free mandates.
New York is a prime blue state example, where electricity prices were 58% higher than the national average during the same period. The Progressive Policy Institute (PPI) found that New York experienced the second-fastest increase in electricity prices nationwide, with residential customers suffering a 36% increase between 2019 and 2024. PPI points to “the immense capital investment required to transform the grid and specific policy choices that increase the cost of energy production,” as well as the closure of the Indian Point nuclear plant.
It’s clear that Governor Kathy Hochul knows exactly which policy choices are driving up electricity costs — because she’s scrambling to roll them back. Ms. Hochul has delayed implementation of the state’s cap-and-tax mandates under the 2019 Climate Leadership and Community Protection Act (CLCPA), which includes a substantial renewable energy mandate requiring 70% renewable energy by 2030 and 100% carbon-free energy by 2040.
The state’s Department of Environmental Conservation defended the delay, arguing in court that the regulations would impose “extraordinary and damaging costs upon New Yorkers.” Ms. Hochul has approved two major natural gas pipelines and delayed implementation of the state’s ban on gas stoves in new buildings – a tacit admission that reliability and affordability still matter in New York.
California, however, remains committed to the most expensive path in the country with the fastest rate increase, now double the national average. For years, Governor Gavin Newsom and the California legislature have imposed on ratepayers a carbon-emissions reduction mandate, renewable mandates, solar cost-shifting through net metering, nuclear reactor closures, and EV charging subsidies.
For all of his climate-friendly posturing, Mr. Newsom signed a bill to ramp up oil drilling in Kern County, and his Energy Commission has delayed its plan to penalize refinery profits for five years. These reversals underscore a central truth: ideology will take a back seat to cost and reliability.
There’s a silver lining, however. While states can choose to raise electricity costs for their residents through bad policies, they can also choose to lower costs through good policies. For instance, Florida is the second-largest electricity producer in the country, behind only Texas. Residents require air conditioning for its hot, humid summers and heating in its mild winters. However, Florida delivers electricity at prices 2% below the U.S. average—mainly because it generates 75% of its power from imported natural gas. It has avoided aggressive climate mandates and delivers below-average electricity prices despite frequent hurricanes that require ongoing investment in the grid.
Louisiana and Kentucky have also invested in wise policies. Louisiana posted the third-lowest electricity rates in the U.S. in 2025, and Kentucky had the lowest rates east of the Mississippi River. Nearly three-quarters of Louisiana’s electricity is generated from natural gas, leveraging its abundant natural gas production and robust pipeline network. Kentucky, similarly, leverages its coal resources to generate 67% of the state’s electricity, with another 26% by natural gas. Neither has pursued aggressive carbon emissions reduction or renewable energy mandates.
Pinning the blame on the federal government and President Trump, as Democrats have been eager to do, ignores the vital role that states play in delivering affordable, reliable electricity. Secretary of Energy Chris Wright recognizes the same, stating on Fox News that “Electricity prices have risen very fast in blue states with restrictive renewable portfolio standards.”
The Department of Energy and President Trump can set the tone, but they don’t dictate the composition of state grids or the bills consumers receive each month. Those decisions rest squarely with governors, legislators, and regulators. Ultimately, it’s up to the states to prioritize reliable, affordable, dispatchable generation and drive down electricity prices.
High electricity rates aren’t an unavoidable consequence of modern life or federal policy. They are the predictable outcome of state-level choices that ignore reliability, undervalue dispatchable generation, and impose rigid mandates regardless of cost. Americans deserve leaders who recognize that keeping the lights on at a modest price isn’t optional. The states keeping electricity affordable today offer a roadmap for those willing to learn.
Yeah. There appears to be evidence supporting the claim that media coverage of climate change has declined in recent years after reaching a peak.Data from the Media and Climate Change Observatory (MeCCO) at the University of Colorado Boulder, which tracks mentions of “climate change” or “global warming” in newspapers, TV, and radio worldwide, shows coverage generally increased over decades with notable spikes tied to events like IPCC reports, COP summits, and political developments. It reached its highest levels in 2021, coinciding with the Biden administration’s green agenda, the Glasgow COP26, and post-COVID recovery discussions.
Yeah. There appears to be evidence supporting the claim that media coverage of climate change has declined in recent years after reaching a peak.
Data from the Media and Climate Change Observatory (MeCCO) at the University of Colorado Boulder, which tracks mentions of “climate change” or “global warming” in newspapers, TV, and radio worldwide, shows coverage generally increased over decades with notable spikes tied to events like IPCC reports, COP summits, and political developments.
It reached its highest levels in 2021, coinciding with the Biden administration’s green agenda, the Glasgow COP26, and post-COVID recovery discussions.
Since then, coverage has trended downward—described in sources as a “precipitous” drop starting in 2022 and continuing through 2025, with an estimated 30% reduction over the past 3–4 years in some datasets. This post-2021 decline is corroborated by:
Reuters Institute reports (2024–2025) — noting gradual decreases in weekly climate news exposure from a 2023 peak, especially in Global North countries.
DW and Yale Program analyses — highlighting shrinking U.S. coverage amid competing priorities like politics and economics.
Media Matters studies — showing drops in broadcast TV climate segments (e.g., 25% decline from 2023 to 2024).
I know many of you have been feeling it. I certainly have, especially when I go look for stories to debunk from media outlets that take some press release and massage it so it reads like “turbo doom clickbait.”
There’s less of those these days and the data suggests a downward trend.
Our friend, Steve Milloy of junkscience.com posted a very interesting plot on X yesterday. Given the clues he left, I was able to replicate it with Grok.
It goes from 1988 (when Dr. James Hansen first testified before Congress about the climate scare,) to the present post-Biden era where Trump is effectively replicating Sherman’s march to the sea in the climate world.
Numbers are approximate and scaled to represent total articles across monitored sources, normalized for consistency across periods (e.g., fewer sources pre-2020 expansion).
The data comes from Media and Climate Change Observatory (MeCCO) which tracks media coverage of “climate change” or “global warming” in newspapers, radio, and TV across dozens of sources worldwide, with data starting in 2004 for global monitoring (and 2000 for US-specific).
Pre-2004 data comes from earlier studies by MeCCO founder Max Boykoff and colleagues, which analyzed English-language newspapers from 1988 onward.
Absolute article counts are not publicly available without accessing their datasets, but trends show low coverage in the late 1980s, spikes around key events (e.g., IPCC reports in 1990, 1995, 2001; Kyoto Protocol in 1997), and overall increases with major peaks in 2007, 2009, 2015, 2019, and especially 2021 (the highest since tracking began).
The peak around 2006-2007 is likely due to Al Gore’s climate movie An Inconvenient Truth gaining traction.
The peak in 2009 is clearly due to Climategate, which as you may recall, WUWT broke that story.
The plunge afterwards was the loss of faith in “The Hockey Team” of climate scientists. Since then, climate as a topic in media coverage has clawed its way back uphill, peaking in 2021 with Biden’s green agenda and EV mandate.
Coverage dipped during the 2018-2020 COVID-19 pandemic but has fluctuated with events like COP summits.
Whether this short down trend will hold depends on us. We have to keep fighting climate alarmism, calling out nonsense, be it scientific or political, when we see it.
Recent reports from late December 2025 and early January 2026 highlight a significant slowdown in the installation of public electric vehicle (EV) chargers in the UK, marking the first year-on-year decline in the rate of new additions. This development has been described as a setback for the Labour government’s net zero ambitions, particularly its push to accelerate the transition to EVs ahead of the 2030 ban on new petrol and diesel car sales.
Recent reports from late December 2025 and early January 2026 highlight a significant slowdown in the installation of public electric vehicle (EV) chargers in the UK, marking the first year-on-year decline in the rate of new additions.
This development has been described as a setback for the Labour government’s net zero ambitions, particularly its push to accelerate the transition to EVs ahead of the 2030 ban on new petrol and diesel car sales.
Multiple factors have contributed, based on industry analysis:
Slower-than-expected EV adoption — EV sales rose to 23% of new car sales in the first 11 months of 2025 (up from 19% in 2024), but growth has been weaker than projected, reducing investor confidence in new charger deployments.
Rising costs and grid connection delays — Charge point operators face increasing expenses and bottlenecks in connecting to the electricity grid.
Policy signals — Critics point to “mixed messages” from the Labour government, including the introduction of a pay-per-mile tax on EVs starting in 2028 (announced in the Autumn Budget). Earlier decisions, such as scrapping a £950m rapid charging fund from the previous Conservative government, have also drawn scrutiny.
Delayed funding rollout — Local Electric Vehicle Infrastructure (LEVI) funding for councils has been slow to deploy, with significant allocations expected only in 2026–2027.
The number of electric vehicle (EV) chargers being installed in Britain has fallen for the first time, in a significant blow to the Government’s push for drivers to switch from petrol and diesel.
Public charger installations are down by 30pc for the first 11 months of this year compared to all of 2024, the first time on record the rate has not increased.
Figures from Zap Map, which provides data to the Office for National Statistics, show that 13,469 were installed by the end of November this year, compared to a total of 19,834 in 2024.
The drop is a blow to Labour’s net zero plan to accelerate the switch to EVs and comes at a critical moment, with industry figures warning that a planned pay-per-mile tax on electric cars also threatens to deter sales.
It will raise fresh doubts about the Government’s EV plans. Labour is under pressure to delay or drop an incoming ban on petrol cars after the EU scrapped its own ban, which was due to take effect in 2035.
Government targets are one thing, but EV chargers are usually installed by private companies. And they are not going to waste billions on chargers that will be heavily underutilised for years.
There are still less than 2 million EVs on the road in the UK, despite rising sales, about 6% of all cars. Moreover most of this are charged at home. After all, who would willingly buy one that can’t be?
Demand for public chargers is therefore weak and largely limited to long journeys and business cars.
The DTI reckons we will need half a million chargers by 2030, but we have less than 90,000.
Eventually supply of chargers will rise to meet demand. But in the meantime, drivers without off street parking will be between a rock and a hard place.
Global industrial demand now accounts for 50–60% of silver consumption, driven by solar (projected to consume massive volumes as capacity grows), EVs, electronics, 5G, and AI data centers. The market has faced structural deficits for five consecutive years (e.g., ~230-million-ounce shortfall in 2025), eroding inventories.
Renewables and electric vehicles (EVs) rely heavily on silver due to its unmatched electrical and thermal conductivity, with no viable short-term substitutes in many applications.
Solar panels use about 20 grams of silver per panel (primarily in conductive paste for photovoltaic cells).
EVs typically require 25–50 grams (or up to 1–2 ounces) per vehicle in wiring, sensors, batteries, and power electronics—roughly double that of internal combustion engines.
Global industrial demand now accounts for 50–60% of silver consumption, driven by solar (projected to consume massive volumes as capacity grows), EVs, electronics, 5G, and AI data centers. The market has faced structural deficits for five consecutive years (e.g., ~230-million-ounce shortfall in 2025), eroding inventories.
China, which dominates 60–70% of global refined silver supply (and is the second-largest miner), implemented new export restrictions effective January 1, 2026.
This is not a full ban, but a stringent licensing system requiring government approval. Exporters must meet strict criteria (e.g., minimum 80 tonnes annual production, ~$30 million credit lines, and prior export history), favoring large state-approved firms and effectively sidelining smaller exporters.
Macro close up of a American Eagle pure Silver Bullion coin. Used as a means of exchange and a store of value
Remember how biodegradable plastic was going to make the world a healthier place? It would save us all from the horrible plastic landfill that lasts 1000 years, and it would protect the dolphins. Well, let’s just hope the dolphins don’t eat the bags.
Despite the rush to put biodegradable bags in every shopping center, no one had bothered to study whether it had an effect on our health, and we still don’t know, but we can say that the mice on that compost heap with these biodegradable bags will be more likely to have diabetes, smaller ovaries, and liver damage. Degradable plastic affected their gut flora. The authors say: “Prolonged exposure to environmentally relevant doses of Starch-based microplastics can have widespread health effects.”
How many native mice will die that could have been saved, and do the Greens care?
While many studies have examined the health implications of ingesting petroleum-derived microplastics, none have looked at the long-term health effects on a living organism ingesting starch-based microplastics. To help elucidate the safety of these ecoplastics, Deng and his team used a mouse model to simulate long-term exposure to varying doses of starch-based microplastics. (J. Agric. Food Chem. 2025, DOI: 10.1021/acs.jafc.4c10855) They incorporated various concentrations of starch-based microplastics into the animals’ food, scaled to reflect typical human exposure; after 3 months, they euthanized the mice to probe the impacts of no, low, and high consumption of microplastics
Notably, the exposed mice consistently had elevated blood glucose levels and disrupted insulin regulation — both heavily implicated in conditions such as diabetes.
Organ-sample analysis revealed system-wide physiological changes, including reduced ovary size, liver damage and inflammation, and impaired colon function. “Starch-based microplastics [SMPs] exhibit widespread harm, potentially affecting multiple tissues and functions,” Deng says. “Given that humans also face real-life scenarios of chronic exposure to starch based microplastics, these findings serve as an important warning regarding their potential health impacts.”
In lab tests, normal plastic bags didn’t harm the cells.
‘Biodegradable starch-based plastics may not be as safe and health-promoting as originally assumed,’ said Professor Yongfeng Deng, one of the study’s authors.
In a previous study, the researchers compared the compostable bags to normal plastic bags after they had been left out in the sun and composted. But when they put them next to fish cells, “A ‘high level of toxicity’ was produced by the biodegradable bags, harming the fish cells,”
Cinta Porte, lead author of the study, published in the Journal of Hazardous Materials, said: ‘We were surprised that cells exposed to conventional plastic bags showed no trace of toxicity.
I don’t put these bags into my own compost. The Council can have them.
REFERENCE
Liu et al (2025) Long-Term Exposure to Environmentally Realistic Doses of Starch-Based Microplastics Suggests Widespread Health Effects. J Agric Food Chem, 2025 Apr 23;73(16):9867-9878. doi: 10.1021/acs.jafc.4c10855. Epub 2025 Apr 9.
This week the world woke up to realize that silver is a critical mineral for the high tech, AI, solar panels, and renewables. In four days’ time, China, which supplies more than half of the processed silver on Earth, effectively blocks their exports of silver.
Meanwhile, it turns out JP Morgan, which has been aggressively shorting the silver market for 15 years — was accumulating it all along. The entire COMEX silver market in New York has 30 million ounces of silver that is ‘immediately deliverable’. But JP Morgan is widely reported to control or custody up to ~700–800 million ounces of silver across vaulting, ETFs and proprietary holdings. It is de facto, the US strategic reserve, but controlled by a private bank, not by the Treasury.
The phase change is in progress. I’m not trying to cover all the details, just to let people know that something very big is unfolding.
The largest single use of silver has become “industrial applications”:
Silver, it turns out, is the best electrical and thermal conductor of all the elements. It is essential to the solar panel industry, EVs, and data centers. And for the last five years, the demand from the tech giants and renewable industry has been so great the global silver miners have not been able to keep with demand. The cumulative deficit in silver production since 2020 is 1.1 billion ounces. That’s a lot of silver that has been pulled from physical stores and sent to industrial buyers.
When Elon Musk says, “It’s not good,” he is thinking of the silver his factories need. Without enough supply, production lines will grind to a halt. Current EVs use about twice as much silver as a petrol and diesel car (25-50 grams per car). But the demand is only going to rise. The new Samsung sold state battery is rumored to need hundreds of grams, or even 1 kilogram of silver in every battery. It’s only a prototype,but supposedly charges in nine minutes and has a range of 900km (600 miles). You know they will want silver…
And even if the price of silver rises substantially, it’s still a small part of the whole cost of an EV, therefore, the factories are going to pay the new higher prices. Anything is better than shutting down…
It is possible to substitute other metals for silver, but the losses are significant. Copper oxidizes badly and has higher resistance.
Meanwhile, inconveniently, China announced two months ago that export licenses will be required for silver in 2026 (this is the same treatment they have done with rare earths). So technically, the CCP can say they haven’t banned anything, but the new rules just happen to restrict supply leaving the country from January 1 (Friday). The export licenses are just “sanctions by paperwork.” Hence, many industrial players are just starting to realize their supply lines are suddenly at risk.
There is a big silver shortage, which may bring down some bankers, the ones left holding the short contracts on silver… At the very least, the money printers will have to work hard.
The most calculated trade in inside trading
The Asian Guy in the videos below, is telling (or selling) a story. Strangely, his YouTube channel only started three weeks ago, yet his reports on silver have been so detailed and prescient he has gathered 43,000 subscribers. He appears to be pure AI, and we should keep in mind that he may even be a product of the JP Morgan marketing team. Who knows? He almost seems to know too much.
JP Morgan Flips LONG + China Ban Starts In 4 Days
The Asian Guy describes himself as a silver bug and talks the talk of the long-suffering silver nerd, and yet, in the end, we have to ask why he is suddenly making these videos and “who benefits” from them. Obviously, JP Morgan comes out looking very powerful, (albeit, also rather predatory. They told everyone not to buy silver while they bought it themselves).
The Asian Guy is effectively telling Elon Musk he has been out-gamed by JP Morgan, and he will need to knock at their door and wait for them to set the price. Presumably, they don’t want him to buy up Mexican silver mines…
In this video (below) made a few days ago, The Asian Guy claims last Friday, one banker must have gone to the U.S. Federal Reserve to beg for $17 billion in Repos (Repurchase agreements) to keep them alive in the disastrous silver shorts gamble. A repo is a loan of last resort. If it’s true, it suggests things are getting very close to the wire for some traders.
It also confirms that the U.S. central powers are willing to inflate their way out of trouble.
The Blob bureaucracy depends on fiat currencies
If the Blob can print money — they can keep giving away other people’s purchasing power in order to buy votes. The game is up though, if the voters realize what is going on and abandon the dollar in favor of something else, like gold or silver.
Because the Blob bankers can always print more money, they have created vast numbers of layers of derivatives, options, and hedge contracts. Astonishingly, the ratio of “paper silver” to real silver is estimated to be over 100 to one, or much higher. What’s changing is that people are demanding the physical silver, not just another paper contract. They can’t make solar panels or EVs with paper silver. But once people realize there isn’t enough silver, everything falls apart just like a bank run, and panic sets in.
A prize-winning science graduate in molecular biology. She has given keynotes about the medical revolution, gene technology and aging at conferences. She hosted a children’s TV series on Channel Nine, and has done over 200 radio interviews, many on the Australian ABC. She was formerly an associate lecturer in Science Communication at the ANU. She’s author of The Skeptics Handbook which has been translated into 15 languages. Each day 5,000 people read joannenova.com.au
Recently released UK government stats suggest Hybrid vehicles are significantly more dangerous to vehicle occupants than gasoline vehicles.
Death rates in hybrids ‘three times higher than petrol cars’ as road safety experts call for inquiry
By GABRIEL MILLARD-CLOTHIER
PUBLISHED: 10:33 AEDT, 28 December 2025 | UPDATED: 19:32 AEDT, 28 December 2025
Road safety experts were calling for an inquiry on Saturday night as it was revealed motorists are three times more likely to die in hybrids than in petrol cars.
A total of 122 people died in hybrid car crashes last year, compared with 777 in accidents involving petrol cars, according to Department for Transport figures analysed by The Mail on Sunday.
But as hybrids are outnumbered by almost 20 to 1 on Britain’s roads by petrol models, that means hybrids are three times more likely to be involved in a fatal crash.
Experts believe the higher death rates could be explained by hybrids’ combination of petrol engines and batteries and electric motors, which can be harder to control and more prone to fires.
…
The cars’ batteries may also be to blame. They can be damaged by the heat of the engine, which burns at extremely hot temperatures, making them more liable to set ablaze.
…
Hybrids were found by a leading insurer of company cars, Tusker, to burst into flames at higher rates than others. Among their fleet of 30,000 cars, hybrid vehicles had an almost three times’ higher risk with 3,475 fires per 100,000.
If anyone has a link to the original report please post in comments.
It makes sense that hybrids are more dangerous than other vehicle categories. While gasoline fires are probably more likely than a battery vehicle fire, I strongly suspect EV fires are less survivable. That big battery is a mobile thermite bomb.
Mix the higher probability of a gasoline fire and hot engine components with a battery, and I suspect you are combining the worst of both worlds.
Since the report focussed on Britain, it is also possible local conditions in Britain contributed to this risk. Frequent wet weather with lots of loose road salt in winter, poorly maintained roads, a lack of undercover parking, and in winter extreme cycles from freezing cold to hot might all play a part.
I once survived a gasoline vehicle fire, it was nasty, but I had a good minute to escape the vehicle – I had time to pull over, safely get out of the vehicle through the passenger door, and stroll a hundred yards from the vehicle before the fire reached an intensity which would have been life threatening. After the fire was put out by the fire crew, I even managed to recover and salvage my plastic laptop computer. It was scorched and the battery was destroyed, but after a month of drying out it actually booted and survived enough for me to recover my files.
Battery fires are a little more spectacular. From MGUY.
Combine a gasoline fire with a battery fire, and you have a potential recipe for disaster.
And it might not even have to be a fire. Gasoline engine components frequently operate normally at temperatures above the ignition temperature of Lithium batteries, so even say a small leak in the exhaust system might be enough to cause a battery explosion.
There was a brief moment when I considered buying a hybrid. After Covid gasoline prices in Australia shot up, and hybrids started to look attractive. But let’s just say I’m going to defer that purchase decision.
The phrase “Slam Dunk: Δtemp Drives Δco2, Ocean Biochemistry at Work” appears to refer to the argument that changes in temperature (Δtemp) primarily drive changes in atmospheric CO₂ levels (ΔCO₂), with ocean biochemistry and physics playing a key role—specifically through reduced CO₂ solubility in warmer seawater, leading to outgassing.
The phrase “Slam Dunk: Δtemp Drives Δco2, Ocean Biochemistry at Work” appears to refer to the argument that changes in temperature (Δtemp) primarily drive changes in atmospheric CO₂ levels (ΔCO₂), with ocean biochemistry and physics playing a key role—specifically through reduced CO₂ solubility in warmer seawater, leading to outgassing.
CO₂ solubility in seawater follows Henry’s Law, where the amount of dissolved gas is proportional to its partial pressure in the atmosphere, but strongly inversely dependent on temperature.
Warmer water holds less dissolved CO₂, promoting outgassing to the atmosphere (like a warmed soda releasing fizz).
The temperature sensitivity is ~4% increase in seawater pCO₂ per 1°C warming under constant dissolved inorganic carbon.
Peter Smith explains in his Quadrant article Shunned by Sanctitudinous Science. Excerpts in italics with my bolds and added images. Synopsis of Ivan Kennedy paper follows later.
When coffeeing with a group of conservative friends as I do on Fridays, one of our number, Professor Emeritus Ivan Kennedy, said something to the effect that there were no scientific alternative theories to the IPCC’s explanation of global warming except for his.
I was taken aback. Surely, even within my limited knowledge, William Happer (Princeton) and Richard Lindzen (MIT) hypothesise that the effect of CO2 on warming progressively declines. Nobel Prize winner Dr John Clauser hypothesises that reflective cumulus clouds created by water vapour, engendered by modest warming, act as a thermostat to keep global temperatures down. You can read about it here if you wish. So what is going on?
Let me start by dismissing the canard that global warming is an invention. Sure, maybe the so-called ‘homogenisation’ of past land and sea temperature data has artificially steepened the warming record since the 1940s. But, for all that, the NOAA satellite data since the end of 1979 shows that the temperature in the sub-troposphere has trended up by about 0.7⁰C between December 1979 and December 2024. As this data has been compiled by Roy Spencer and John Christy (sceptical scientists) at the University of Alamba in Huntsville, we can safely assume it is trustworthy.
So the climate has warmed. Now should come the scientific fun. Competing theories jostling to best explain the data. No such fun. Blaming exploitative Western man has proved to be a sacrosanct hypothesis.
Sacrosanctity and science don’t mix. Many past theories propounded by scientific giants have eventually failed the test: Ptolemy’s geocentric theory of the solar system; Aristotle’s theory of gravity, even Newton’s. Yet a tenuous theory of the climate concocted by relative mediocrities, which hasn’t come close to accurately predicting global temperatures, is holy writ. Risible, except that political and celebrity buy-in is undoing progress wherever it results in the replacement of reliable with unreliable energy. Think of Australia as a quintessential case study.
Happily, despite powerful and well-funded forces out to cancel dissenters, maverick scientists keep on stirring the pot. Which brings me back to Prof. Kennedy and his collaborators. Their hypothesis can be found here. In lay terms it goes like this:
The increased concentration of CO2 in the atmosphere since the 1960s has been caused by warming not the reverse. Other things equal, emissions by mankind of CO2 are all absorbed by the land (hence the greening) and by the oceans. Thus, on this account, there is no material net increase of CO2 in the atmosphere from fossil fuel emissions. Ergo, such emissions cannot be the cause of warming. It is true that warming has occurred, and that atmospheric CO2 has risen. The underlying chain of events is as follows.
Warming, perhaps through solar activity, promotes the precipitation of calcium carbonate (limestone) in surface sea water, absorbing CO2 from the atmosphere in the process. In turn, the absorbed CO2, magnified by calcium carbonate precipitation, acidifies surface sea water. The acidification then results in the emission of CO2 into the atmosphere in autumn and winter. This emission of CO2 is greater than the absorption, precisely because of the continuing acidification in the warming water.
In the end we see increased atmospheric CO2 and warming. It is easy to draw the wrong conclusion. Indeed, the IPCC has done so.
I see the point about Kennedy’s hypothesis being singularly different from other alternative hypotheses. Lindzen’s and Happer’s hypothesis, and Clauser’s, embrace the foundational proposition of the received theory, albeit in muted form. Namely, that man-made CO2 is adding to atmospheric CO2, thereby having a greenhouse effect. Kennedy’s hypothesis does not embrace that proposition.
Whether Kennedy is right (or Lindzen and Happer or Clauser) is by the way. Alternative hypotheses are in the skeptical scientific tradition of searching for theories which better explain the facts than does the received theory. That is particularly important in this case. The received theory is upending life as we know it, while being shielded from rival theories by money, politics and pseudo-religiosity.
Why do atmospheric carbon dioxide levels rise and fall seasonally measured on Mauna Loa? This study explores the thermal acid-calcification (TAC) hypothesis, suggesting that seasonal temperature shifts in surface seawater trigger acid pH-driven CO₂ emissions caused by calcification. Using oceanographic data, we modeled how temperature affects dissolved inorganic carbon including CO₂, bicarbonate, and carbonate.
Our findings reveal that warming waters absorb atmospheric CO2 by promoting calcium carbonate formation, acidifying seawater and boosting CO₂ release to the atmosphere in late autumn and winter, when atmospheric CO₂ becomes highest. The model predicts a net annual CO₂ rise of 2 ppmv, driven by calcification rather than land-based processes. Seasonal pH swings of 0.04 units corroborate this mechanism. The TAC hypothesis indicates that continued ocean warming, not just fossil fuels, contribute to rising CO₂ levels, calling for deeper investigation into marine carbon dynamics.
The Keeling Curve for atmospheric pCO2 in parts per million by volume
Fig. 1. The Keeling curve of atmospheric CO2 partial pressure at 3200 m on Mauna Loa, Hawaii. Data from Dr. Pieter Tans, NOAA/ESRL and Dr.Ralph Keeling, Scripps Institution of Oceanography.CC BY-SA
The very stuff of plant life on Earth in photosynthesis as well as in the structural basis of all living creatures, we are told by the United Nations Intergovernmental Panel on Climate Change (IPCC) (2) that the continuing rise of CO2 in the Keeling curve shown in Figure 1 now threatens global catastrophe from global warming. Such a paradoxical contrast for good and bad lacks credibility, given the longevity of life on Earth.
Transfers of CO2 out of the ocean surface in winter versus that entering in summer
We propose that a quasi-equilibrium exists between a falling pH value in surface water, favoring CO2 emisssion. Falling pH values in the surface water of the oceans have been an enigma, invisible to scientific view until recently after the year 2000. Our logic is supported in our articles (3, 4) where we describe the basis for the thermal acid-calcification (TAC) hypothesis, also using data cited from others. Acidic calcification is thermodynamically favored in warming surface seawater, particularly in northern oceans in spring and summer with shallow mixing zones and higher temperature ranges. This raises the fugacity or potential pressure of CO2 in seawater to its peak value in summer when the pCO2 in air is minimal, causing its forceful emission into air in the next autumn reaching a maximum pCO2 in late winter (Fig. 1, seasonal variation insert).
Fig. 2. Thermal acid-calcification model for seasonal and longer-term generation of the Keeling curve. The Thermal model (3), showed calcification is favored by increase in temperature giving decreasing pH values in summer, reversing in cooler conditions to more alkaline pH in winter. Note that precipitation of CaCO3 in spring to summer removes CO32- that is replaced from HCO3 – with more acidity, provided by absorption of CO2 from air up to October. However, as the pH falls the steady state concentration of [CO2} increases favoring photosynthesis.
Acid calcification is essential for phytoplankton
Any process of strong acidification of surface seawater will raise the concentration of carbon dioxide as [CO2] available to phytoplankton for photosynthesis. Bicarbonate cannot be a direct substrate for photosynthesis although the presence of the enzyme carbonic anhydrase speeds up its interconversion with CO2. Our published modeling analysis confirmed that CaCO3 precipitation is strongly favored by warmer temperatures (Table 1). Indeed, all the reaction equilibria in seawater are displaced to the right in Figure 2 acidifying the water, although the equilibrium between CO2 concentration and pCO2 in air favors a lower concentration [CO2} in water in summer, compared to winter, when it is greatest. Our results even confirmed that the formation of CaCO3 as calcite is predicted to increase in summer as water becomes warmer (Table 1b).
Thus, we can expect more limestone formation in summer if the carbonate concentration reaches a sufficient level, favored by added warming. The decline in average pH values in surface seawater to about 8.05 from pH 8.20 could explain the increased pCO2 in the atmosphere of 140 ppmv since 1800 as a matter of dynamic equilibrium. Caused by calcification, this would require a simultaneous equivalent deposition of limestone as sediment, though only an increase of about 10 μmoles per kg of surface seawater, or a net 1 mg per kg each year. This is a key prediction for experimental testing of the TAC hypothesis.
This fully reversible calcification equation moves towards acidification in summer and reverses to alkalinization in winter. The psi factor is a variable function of the range of seasonal changes in temperature. However, the greatest thermodynamic potential to emit CO2 in seawater by acidification of bicarbonate (HCO3-) is when the pH value is lowest, the conversion of bicarbonate to CO2 generating the greatest difference between CO2 fugacity in seawater and that in air in midsummer in northern hemisphere waters. The seasonal variation near Mauna Loa in atmospheric pCO2 is about 6 ppmv whereas the long-term increase in the Keeling curve year by year is one third of this, about 2 ppmv suggesting that in spring and summer the CO2 absorbed in about 2 ppmv, less than that emitted in autumn and winter.
Fig. 5. Rates per square meter in global carbon cycling between land water, the atmosphere, and the ocean, illustrating the pH-acidification hypothesis. Emissions and absorptions shown are average moles per square meter of the Earth, for a mixing ratio of 420 ppmv in 2021 shown in the central column bridging land and ocean. The land acidification values are derived elsewhere (11), assuming photosynthesis is equal to respiration. The terrestrial area of Earth is 1.48×10¹⁴ m-2 , the ocean’s area is 3.62×10¹⁴ m2 , 5.101 x10¹⁴ m2 in total., represented as a mean value in the central air column.
Discussion
Limestone as a product of calcification is regarded as a biogeochemical product, given that phytoplankton and other marine organisms enhance its rate of production, if nutrients are available (3). In particular, the extracellular carbonic anhydrase apparently speeds the reversible dehydration of CO2, forming bicarbonate and hydrated hydrogen ions (H+) controlling pH. This article emphasizes that the reversible dehydration of CO2 in surface seawater allowing transfer between aqueous and gaseous phases is most rate limiting of all, that carbonic anhydrase may even assist in autumn and winter, transferring CO2 to the atmosphere.
More significantly for managing climate change, if fossil fuel emissions are being largely absorbed by sequestration into the ocean surface and by ‘greening’ photosynthesis on land and in the ocean (11), the implications of this aspect of the TAC hypothesis for carbon-zero policies and renewable energy are profound.
The thermal acid-calcification hypothesis predicts that global warming acidifies the ocean surface by increasing calcification causing pCO2 to increase, independently of fossil emissions.
Furthermore, this represents a striking illustration of the Le Chatelier principle, the carbon cycle on Earth responding intelligently to changing climate. The hope that carbon dioxide removal as sequestration (14), either biologically, chemically or geologically, by burial after capture, will prove futile.
The uncertainty of the current IPCC paradigm regarding climate change and the role of fossil emissions of CO2 in warming is large, lacking scientific evidence. A plausible alternative hypothesis offered here as the true cause of the increasing Keeling curve needs to be investigated urgently. This new model would still give predictively increasing emissions from the ocean in the complete absence of fossil fuel emissions because the acidification from calcification is purely a function of surface warming, from whatever cause.
Changes in CO2 follow changes in global temperatures on all time scales, from last month’s observations to ice core datasets spanning millennia. Since CO2 is the lagging variable, it cannot logically be the cause of temperature, the leading variable. It is folly to imagine that by reducing human emissions of CO2, we can change global temperatures, which are obviously driven by other factors.
A recent article at LAist titled “The poor are in a very bad state: Climate change accelerates California’s cost-of-living crisis,” claims that climate change is increasing the cost of living in California. This is false. Climate policies in California are accelerating the cost of living much more than any modest warming.
The first example the LAist post gives is the fire outbreak from January 2025 in the Los Angeles area, particularly the Eaton fire, which “accelerated the decade-long displacement of tenants […] from Altadena due to rising housing costs.”
This is certainly something that happens, if a neighborhood is burned down it will make already high housing costs impossible to overcome because, simply, the houses are gone. And poorer people will struggle to rebuild. Nothing unprecedented about that.
LAist blames these fires on “an unusual lack of rain, a condition blamed on climate change,” and then backed this assertion up by referencing attribution studies: “Using weather data collected since 1950, scientists ran simulations showing the conditions that dried out the foothills were 35% more likely because of global warming.”
This is nonsense. Not only are attribution studies junk science, as discussed by previous Climate Realism articles here, here, and here, but the conditions that led to the dryness that contributed to the Eaton fire and others at the same time were not due to climate change.
The high, dry wind phenomenon that made the conditions very dangerous and prone to out of control wildfires in the Los Angeles area is so common it has its own name: The Santa Ana winds. These winds are well documented and not historically unusual, though the winds from that particular month were very strong, with some record high wind gusts.
Santa Ana winds are most common during the winter months, and cause vegetation to dry out rapidly, even if there was enough rain beforehand. In fact, there was a lot of burnable vegetation in the area at the time, a high fuel load, because the previous winter seasons had been wetter, and contributed to more plant growth. This means that when the winds came, they dried out a lot of fuel for fires when they were started by arson, in the case of the nearby Palisades fire.
Data does not indicate that the Santa Ana winds are getting more severe or common due to climate change, though there are some studies suggesting they could get weaker, but that has not appeared in data yet.
Several Climate Realism posts go into more detail about the Los Angeles fires, none of the available evidence points to climate change.
LAist pointed to more than just wildfire, saying that “[r]ising temperatures, the clearest impact of climate change, are driving up home energy costs.”
They went on to say that last year was the hottest summer on record for California, and every “day above 95°F increased the chance that the power to low-income households would be disconnected, as energy bills inch up an additional $20 to $30 a month, according to a 2022 UCLA study.”
Data from the National Oceanic and Atmospheric Administration (NOAA) do not show that California’s number of extremely hot days is increasing beyond what earlier parts of the 20th century saw, particularly the 1930s. (See figure below)
Looking at Los Angeles county alone, the trend is different, with more higher temperature days in recent decades, however this can be attributed to the Urban Heat Island effect, which is not a climate issue, but is due to human activity via urbanization.
LAist also pointed at drought and flooding as weather conditions that are getting worse in California due to climate change, but both of these are also incorrect or misleading. Annual precipitation data shows no long term trend for the state, nor does the number of extreme precipitation events. Drought is a bit more complicated, since water needs are also taken into account. California, especially around Los Angeles, is a very dry state. Most of the climate zones are mediterranean or desert, both naturally dry. Meanwhile, the population and expansion of agriculture (like vineyards) have been expanding and demanding more water. Even if meteorological drought is not worsening, meaning the amount of rainfall and snow the state is getting, increasing demand on groundwater and reservoirs will put a strain on state water supplies. But drought itself is natural for the state, and long term—especially paleontological—data show that repeated lasting droughts are not unusual.
Interestingly, the article authors begrudgingly admit that “California’s policies to discourage fossil fuel use add to costs,” saying that power bills and fuel costs are higher in California as the state attempts to “wean itself off oil and gas.”
This is the largest and most obvious reason for the high cost of living in the state, not a three-degree change in average temperature over more than a hundred years. High costs of electricity make it harder for the poor to afford sufficient air conditioning, and those costs rise much more rapidly than the average yearly temperature. A report by the Institute for Energy Research shows how over-reliance on expensive renewables like wind and solar have driven up costs across the board, and now California has the second highest electricity rates in the country, surpassed by only Hawaii, and pays more than double the national average. California is also the second highest in electricity importing, despite having ample natural resources in the form of natural gas.
The real cause of financial pain for the poor in California is not climate change, but the pursuit of climate policy.
LAist is simply pursuing a climate alarmist angle in this story, while downplaying the larger and frankly blatant influences on the state’s cost of living crisis. California is known for having some of the best climate regions in the world, the easiest to live in, and that has not changed. What has changed is the population, and the insidious growth of climate policies by state leadership, prioritized over public welfare.
California’s high cost of living stems primarily from a severe housing shortage, driven by restrictive land-use policies, local zoning laws, and delays from the California Environmental Quality Act (CEQA)—often used to block or delay new development.
Climate-related policies contribute indirectly to costs, particularly in energy, but they are not the main driver of unaffordability compared to housing supply constraints.
California’s median home price hovered around $870,000–$900,000 in late 2025, with forecasts predicting a rise to about $905,000 in 2026.
Monthly mortgage payments for a mid-tier home exceed $5,500, requiring an annual household income over $220,000 to qualify—more than double the state’s median household income of around $102,000.
This makes homeownership unaffordable for most residents.
Critics highlight CEQA as a key barrier: it enables lawsuits that delay projects, increasing costs and deterring builders.
Studies and reports note that CEQA has blocked or slowed infill housing and transit-oriented developments, exacerbating the supply shortage.
Recent 2025 reforms streamlined CEQA for urban infill projects to accelerate building and reduce costs. Other factors include high construction costs, limited land availability in desirable areas, and post-pandemic price surges.
Out-migration reflects this: California saw net domestic losses of over 200,000 people in 2024–2025, largely due to housing costs pushing residents to states like Texas.
California pursues ambitious climate goals, including renewables mandates (RPS), cap-and-trade, and building decarbonization.
These policies raise electricity rates—second highest in the continental U.S.—through investments in renewables, grid upgrades, and wildfire mitigation.
Critics argue that reliance on intermittent sources like solar/wind, plus regulations discouraging fossil fuels, drives up bills more than modest warming would.
However, analyses (e.g., from NRDC and legislative reports) indicate recent rate hikes stem mainly from wildfire liabilities, grid maintenance, and utility costs—not directly from clean energy mandates.
Policies like zero-emission building rules add upfront costs but can increase property values long-term, with programs aiding low-income households.
Climate impacts (e.g., hotter summers raising AC use, wildfires increasing insurance) add “hidden costs” to living expenses, worsening affordability for lower-income residents.


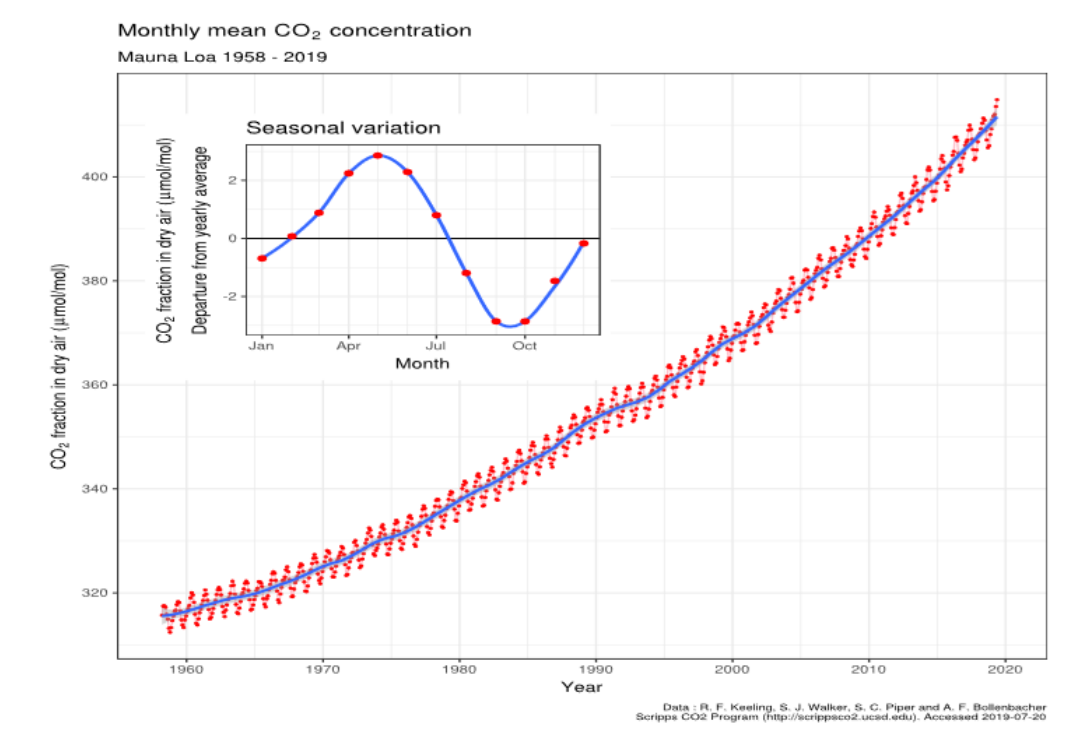
You must be logged in to post a comment.