Global warming, climate change, all these things are just a dream come true for politicians. I deal with evidence and not with frightening computer models because the seeker after truth does not put his faith in any consensus. The road to the truth is long and hard, but this is the road we must follow. People who describe the unprecedented comfort and ease of modern life as a climate disaster, in my opinion have no idea what a real problem is.
Climate comedy turn Jim Dale continues to tour the Gaiety Halls of broadcast media, delighting audiences with his own word-salad English and his knack for getting most facts wrong. Fans were not disappointed by an extended performance, here, start around 2hr 38 mins, last week on Mark Dolan’s TalkTV show when he falsely claimed Costa Rica had reached Net Zero and the polar ozone hole had closed.
Climate comedy turn Jim Dale continues to tour the Gaiety Halls of broadcast media, delighting audiences with his own word-salad English and his knack for getting most facts wrong. Fans were not disappointed by an extended performance, here, start around 2hr 38 mins, last week on Mark Dolan’s TalkTV show when he falsely claimed Costa Rica had reached Net Zero and the polar ozone hole had closed. Readers might be advised not to organise drinking parties around Jim’s much-cherished appearances. If a shot is taken every time the great entertainer gets a climate or Net Zero fact wrong, you’d be Brahms and Liszt quicker than you could say Julia Hartley-Brewer.
A number of countries are already at Net Zero carbon emissions, claimed Dale, and he gave Costa Rica as an example. Sorry Jim, treble Guaro Sours all round: Costa Rica is nowhere near Net Zero. In fact, the Carbon Action Tracker notes that the current government is sending “worrying signals that the full implementation of the climate policies and measures necessary to meet Costa Rica’s own targets could be deferred”. Key electric public transport projects have been paused or downscaled, while the current President has announced his opposition to an oil moratorium, along with an intention to explore Costa Rica’s hydrocarbon reserves. For some time, Costa Rica has presented itself as a poster country for eco-tourism and sustainability, but it was never near Net Zero. There comes a time when all the virtue signalling has to stop. Hard reality seems to have bitten the territory, as it has every other country taking a serious look at the stupidity of the Net Zero fantasy.
Put down the liquor bottle (just for a very short while): our climate clot got it partly right when he said two or three countries had hit Net Zero. One country often mentioned is Bhutan, a landlocked territory the size of Belgium in the eastern Himalayas. Mountains give Bhutan huge hydroelectric power, while 93% of the land is covered in carbon-dioxide-absorbing forest. Meanwhile, about half the population of 800,000 is involved in subsistence farming. As a future model for Net Zero, it leaves a lot to be desired.
Perhaps Jim could explain on his next much-awaited guest slot why Bhutan, a Net Zero country seemingly perfect in every respect, requires foreign aid of $13.7 billion over the next decade for “mitigation” costs to keep it on the straight and narrow Net Zero path. Sustaining its contribution and ambitions are said in its third Nationally Determined Contribution report to the UN to require “continued and predictable” international financial support.
Of course it does. Not a bad little earner for a country with an annual GNP of just over $3 billion. The cynical might be forgiven for reading into its words a threat along the lines of: cough up or the trees get it.
Time to refresh our glasses again, as our comedic clown then told Mark Dolan that the South Pole ozone hole had closed or, to put it in Jim’s word-salad English: “The ozone layer was a perfectly tenable thing that occurred and the hole closed because we got out of aerosols that managed that actually.” Alas, the hole has not closed, despite a 35-year ban on aerosol-using chlorofluorocarbons (CFC) gases. The thinning, rather than a hole, appears to be a largely natural event that changes thickness on an annual, seasonal basis.
A recently published science paper by three New Zealand-based scientists noted that the three years 2020–2023 witnessed the re-emergence of large, long-lived holes over Antarctica. The scientists observed that in the eight years to 2022, five showed similarly large temporary holes occurring in the spring months. In 2023, the European Space Agency said the hole was one of the biggest ever recorded, measuring 26 million sq kms. Perish the thought that banning CFCs didn’t make much difference – surely all those Nobel science prizes were not handed out in vain for a totemic environmental scare that proved such an inspiration for all the subsequent attempts to induce mass climate panic? Except when Jim unwisely brings it up, you don’t hear much about the ozone hole these days, with activists quietly extending its supposed disappearance to around 2060.
Your correspondent has a few tips to offer if readers ever need to handle Jim in a public debate. The first task is to stop him constantly interrupting and shouting over you. This is best done by first listening to what he has to say and, at the first sign of trouble, demanding the same courtesy be extended when it is your turn to speak. Last May, I found myself with him on TalkTV with the excellent ringmaster Ian Collins – here, the entertainment starts at around 35m 30s. It worked reasonably well, despite the overwhelming temptation at one point to burst out laughing when Jim claimed the source of his climate information was NASA, “who send people to the Moon and Mars”. Extra fun can be inserted into the proceedings by noting that Dale is on record as wanting to jail climate ‘deniers’. At my prompting, Ian Collins asked him if this was true and the ensuing word-salad explanation was a pure delight. Only Jim can explain in his special language that it is not quite like that, while at the same time suggesting that it is precisely like that.
The market for data-free climate scares is starting to dry up across mainstream media. Gone are the days when the BBC’s Esme Stallard could give us her “climate change could make beer taste worse”. No more shall we see Georgina Rannard make the obvious mistake of putting a date on impending doom as she did in 2023 with a ‘scientists say’ article warning that the Gulf Stream warm currents “could collapse as early as 2025”. Perish the thought, but soon only Jim Dale might be left to keep the nation amused with his carry-on climate catastrophising routine.
Chris Morrison is theDaily Sceptic’s Environment Editor. Followhim on X.
Jordan Peterson explains good reasons not to trust where Carney claims to be heading, contrary to his longstanding commitments and priorities. The first video explores Carney’s stated principles in contrast to Canadian heritage. For those who prefer reading I provide a transcript with my bolds and added images.
What Carney’s Background Tells Us About His Future Steps
So, what do we say about Carney’s experience and his resume?
Well, the real question is, what is he aiming at?
Right, so he’s got a stellar educational background and this vast experience on the international side. But the question is, what has he concluded from that?
And what has he done in consequence?
And what is he planning to do in the future?
Now, I read Carney’s book Values very, very carefully. And so, the reason I want to walk you through that is because that’s his carefully thought through statement of principles and aims.
And so, it’s useful to take a person at his word on the written side. And so, I think we can derive from values what Carney’s values are, what values he thinks Canadians do and should hold, what we can conclude about what he’s already done for Canada and on the international stage, and where things are headed in the future. And so, now, the first, I’m going to take Carney’s Values book apart in two ways.
The first thing I want to tell you is what he thinks Canadians’ values are. Okay, so he’s setting himself up as an arbiter of the Canadian ethos. And to do that in his book, in the first couple of chapters, and then at the end of the book, he tells us all what makes Canada the country that it is.
And so, we want to delve into that. All right.
So, Carney’s conclusion with regards to Canada’s core values are a leftist, utopian, globalist view of the Western tradition.
So, he believes, for example, that the core Canadian values are: ♦ fairness and equity, ♦ resilience and adaptability, ♦ sustainability and responsibility, and ♦ community and cooperation.
Okay, so the first thing I’d like to do, those are all terms that sound positive and that could, in principle, bring people together on the basis of a vision. Fairness and equity, resilience and adaptability, sustainability and responsibility, community and cooperation.
But the first thing I’d like to point out to all of you who are listening is that although Carney claims that those are core Canadian values, that claim is not correct.Those are core globalist, socialist, utopian, net zero promoting environmentalist values.
But the core Canadian values are actually derived from the Judeo-Christian, Western, broadly Western, and English common law tradition.
And so, I’m going to outline what those are, just so you can see the contrast between those values, which are the true Canadian values, and Carney’s values, which have this patina or aura of high-flown positive emotion, but bear little relationship to the genuine historical reality and do not describe the values that made Canada the wealthy, free, productive, Western democracy that it is.
So, Canada is actually founded on the principles of individual liberty and rights, the rule of law, equality and justice. And equality there doesn’t mean equality of outcome, and it doesn’t mean economic equality.
It means equality of value before the law, and equality of opportunity, and responsibility and order. And so, those are values that are very different than the value set that Carney is putting forward. And so, then you might ask, if Carney didn’t derive what he believes Canadian values to be from the historical reality of Canada, from what source did he derive his values? Now, you also might wonder why it’s important to even delve into this.
And well, the first conclusion we could draw is that Carney wouldn’t have written a whole book about values if he didn’t think that it was important to delve into values. And he certainly wouldn’t have written a book revealing his own values if he didn’t think it was important to communicate to Canadians and people around the world what he thinks Canadian values and his values are and should be. So, my focus on values, although I certainly believe, as he does, that values are fundamentally important, I’m focusing on values because that’s the focus that Carney himself chose.
All right, so this is where we can link the facts of his resume to an analysis of his genuine motivations. So, let’s first look in more detail at how Carney translates his core values into the beginnings of policy. All right, so Carney in his book Values outlines his support for three of what I regard as the least credible ideas that have emerged on the international landscape and the intellectual landscape in the last 20 years.
So, first of all, he’s an explicit advocate of the diversity, equity and inclusivity principles that have destroyed the modern universities, that have corrupted our judiciary and our political institutions, and that have allowed the liberals to smuggle, the modern federal liberals, to smuggle in what’s essentially a relatively radical leftist agenda under the guise of classical liberalism.
Diversity, inclusivity and equity the DEI holy trinity is a political policy movement predicated on the idea that Western society, and that would include Canada, is a corrupt patriarchy in its essence that marginalizes a variety of groups and purposefully so delegitimizing them, and that the appropriate response to that is to segregate and identify people on the basis of their group identity, and that would include race and sex and gender and all the other isms, all the other ism identities that you may have heard in the last 10 years, to divide people on the basis of those identities and to privilege the marginalized, to bring them to the center.
Now, some of that presumption derives from postmodern philosophy and some of it is essentially Marxist in its orientation, and so Carney’s derivation of Canadian values, when the pedal hits the metal, let’s say, or the rubber hits the road, the manner in which Carney translates his interpretation of Canadian values is the same manner that the radical leftists in the Democratic Party, for example, in the United States translated the same value propositions, and that’s to become an advocate for diversity, equity, and inclusivity, and to assume that human beings should be divided on the basis of their race and their sexual identity and their gender, etc., and that our culture is essentially oppressive at its core.
And so, I believe that idea to be discreditable across multiple dimensions of analysis, and it’s certainly the case that it was roundly rejected by the American electorate in the last election cycle.
And you can also see that the Democrats themselves in the United States are backpedaling rapidly on the DEI front because they realized that it’s a losing game in the short, medium, and long run.
And so, the first thing we might note is that when Carney is trying to formulate policy, one of the sets of policies that he put forward include this discreditable and divisive DEI formulation that’s been part and parcel of the maneuvers by intellectuals to tilt the entire political world in a radically revolutionary and leftist direction.
The second video goes into the economic and environmental dimensions of Carney’ vision.
And That’s The Utopian Vision Of Carney
So, with regards to this promised utopia of a new future, one of the things Carney says, for example, after he talks about the fact that 75% of our fossil fuel resources will have to be left in the ground, is this promised new magical utopia of renewable jobs, especially for places like Alberta. Now, he says that if we unleash innovation in the private sector, that all the problems that are associated with the transition to net zero will somehow be solved.
So, let’s see what’s happened in countries where that’s actually being attempted.
So, I think we should talk about Germany and the UK. So, Germany has been more green, arguably, than Canada, let’s say, for the last 10 years. And they’ve shut off their nuclear plants, and they’ve made a transition to renewables.
And so, what’s the consequence of that? Well, one consequence is that German energy prices are now five times as expensive as they are in the US. And then you might say, well, that’s a small price to pay for saving the planet, but then we could take that apart. So, Germany is rapidly de-industrializing and their economy is tanking.
And all the industrial production that they no longer manage is only shifting to other places in the world, like China and India. So, it’s not like it’s going away, it’s just not happening in Germany. And they’re increasingly dependent on renewables, solar and wind.
And Germany isn’t one of the world’s sunniest countries and it’s also susceptible to what they call wind drought. So, there are long periods of time where the solar arrays and the windmills aren’t producing any electricity. And like zero electricity is not very much electricity.
Now, why is that a catastrophe? It’s like, well, do you want your refrigerator on or off or even more to the point, do you want to be able to go to the hospital and make sure that there’s electricity when you’re having emergency surgery, et cetera? And there are signs, for example, that places like Australia that have been moving down the renewable pathway are facing the imminent threat of rolling blackouts. And that could easily happen in places like Germany. Okay, so now the problem with renewables is that we can’t store the energy.
We don’t have the battery technology and the battery infrastructure, not even close. And it’s going to be a long time before we do at least 20 years, maybe longer than that. And so, the question is, now, what do you have to do? Because renewable energy is so unreliable.
Sometimes this, like at night, the sun doesn’t shine in case you haven’t noticed and the wind stops blowing. And so then renewable production falls to zero. Now you have to have something to back that up.
And worse, you have to have something of the same size as the entire renewable grid, because otherwise it can’t handle the power demands. And so that means that as you switch to a renewable grid, you have to have another grid in place that has exactly the same capacities and it has to be not renewable. So, what that means is that when you build a renewable grid, you build it in addition to the preexisting grid.
And then you might say, well, if the renewable sources aren’t producing energy, you could just turn to nuclear, but there’s a couple of problems with that. First of all, you can’t turn a nuclear power plant on and off quickly, as you might well imagine. And the Germans, for example, scuttled their nuclear plants.
And so, what have they done? They’ve turned to coal burning plants. And the Germans don’t burn anthracite, which is high quality coal that doesn’t produce much particulate matter, which is like the dust pollution that would be associated with smog. And they burn lignite, which is low quality coal, and it produces a lot of particulate.
Plus it produces a lot of carbon dioxide. And so, what’s happened in Germany after 10 years of green idiocy is that their power prices are five times as expensive. They’re hyper-reliant on places like Russia and the Middle East for their fossil fuel production, not least because Canada was too daft to enter into an agreement with them.
And they pollute more per unit of energy produced than they did 10 years ago. Even if you accept the environmentalist argument that carbon dioxide overproduction is an existential crisis, which it isn’t, and you say, well, something substantial needs to be done to ameliorate the threat, you have to observe that when something substantial has been done, so that’s the creation, let’s say, of a renewable power grid, the consequence is not only that the atmosphere doesn’t improve with regards to carbon dioxide proportion, but that the pollution problem actually gets much worse as well as energy becoming more expensive and unreliable. And so what? That’s what you want Carney to do for Canada.
And for Canada, there’s not a country in the world that’s more dependent fundamentally for its existence on reliable energy, because Canada is uninhabitable without an unbelievably well-developed industrial and energy infrastructure just to keep us alive when it’s 40 bloody below. And then our economy is radically dependent on our natural resource production. Now, it shouldn’t be that dependent on natural resource production because we should be doing value-added investment, for example, refining our fossil fuel resources to a higher degree than we currently do.
Most of that’s done in the United States, and we should do things to ensure that we the proper transition into a technologically driven future. But Carney says absolutely nothing about any of that in his book, Values. And so, he just magically hand-waves and says, oh, well, if you unleash the private sector, there’ll be this magical net zero transformation, and everyone will have much more productive jobs and the planet will be much greener and we won’t need to rely on fossil fuels.
Well, we don’t just rely on fossil fuels for energy, folks. We rely on fossil fuels to make damn near everything that we make, including our agricultural products. And so, you also hear the net zero people claiming that agricultural production has to be slashed radically.
And so, you can imagine what that’s going to do to food costs if you haven’t noticed. And part of the reason for that is that the fertilizers that we use, ammonia, for example, are created out of fossil fuels. And so, you have no idea how much the entire economy, and so that’s your bread and butter and your house and your heating and your air conditioning and your travel and your vacations and your kid’s future.
That’s all dependent on the fossil fuel economy.
And so, Carney, there’s two tacks you can take to Carney. One is either he’s learned that his net zero preoccupation was wrong, which means every single thing he thought while he was being educated and while he had his highfalutin career, every single thing he thought was radically, not only wrong, but the opposite of the truth.
That’s one conclusion. Or he still thinks what he’s always thought, which is certainly what it seems to be in his book, Values. And certainly, seems to be the case with his continuing insistence that we have to hit net zero by 2050 and spend $2 trillion doing it.
The alternative conclusion to he was just radically wrong and has learned is that he hasn’t learned a damn thing. And it’s still his fundamental axiomatic presupposition that human being industrial production leading to carbon dioxide overproduction is an existential threat that should be everyone’s top priority for every financial decision that they make and that everything should be secondary to that.
And that implies that his claim to eliminate the carbon tax, for example, and to move Canada onto a more solid industrial footing in the future is just a lie.
So those are your options. Either he was completely wrong about everything for the last 20 years in the worst direction possible and has learned orthat he hasn’t learned a damn thing and is still sticking to exactly what he wrote in his book, Values, in 2021 and exactly what he’s indicated in all of his public pronouncements.
And he’s going to act as if he’s in favor of Canadian economic development, but he’s going to keep pursuing a net zero agenda because that’s priority number one.
And he hopes you peasants are too stupid to understand the reality of the situation that’s in front of you. And so that’s going to mean no flights for you and no clothes for you, maybe three changes of clothing per year. Nope, only a short haul flight every three years, for example, a radical reduction in the amount of meat that you eat, a radical reduction in private car ownership.
And you might think, well, that’s paranoid conspiracy theory, but you can go look at the documents of the C40 coalition of the top cities in the world and look at their aims for the next 20 years.
And you can decide if they’re on the same side as Carney or whether they’re on your side. And you can draw your own conclusion because if your presumption is that the planet is facing an environmental catastrophe because of carbon dioxide production and that that’s such an emergency that we have to do every possible thing we can with every financial decision, no matter how much it costs to ameliorate it, then there’s no limit whatsoever to the amount of power that you’re willing to expend to make that happen.
And we know what’ll happen because it’s already happened to Germany and the UK and it’s happened to a large degree to Canada. And there’s no reason to assume at all that Mark Carney is a leopard who’s changed his spots. Quite the contrary.
This is a bad look for the climate movement. We have never seen this in the past 20-plus years — a lower point of the climate movement than it is currently. The entire climate agenda, within one year of Donald Trump getting to work, has now seen 250 actions against it. Both us and globally. The climate change campaign has just been decimated.
And I think Al Gore is the best metaphor for this. Gore, at the World Economic Forum, was reduced to heckling speakers. That’s about the simplest way of putting it.
Climate change takes a back seat at Davos – ClimateDepot.com executive editor Marc Morano argues that President Donald Trump has ‘obliterated’ the ‘climate agenda’ on The Bottom Line.
“Donald Trump hijacked the entire World Economic Forum meeting, but more importantly, he completely obliterated the entire climate agenda.” | @ClimateDepot reacts to the global climate hysteria taking at backseat in Davos this year with @dagenmcdowell & @BrianBrenbergpic.twitter.com/C2RNHdOaLf
“This is a bad look for the climate movement. We have never seen this in the past 20-plus years — a lower point of the climate movement than it is currently. The entire climate agenda, within one year of Donald Trump getting to work, has now seen 250 actions against it. Both us and globally. The climate change campaign has just been decimated.
And I think Al Gore is the best metaphor for this. Gore, at the World Economic Forum, was reduced to heckling speakers. That’s about the simplest way of putting it.
And by the way, Al Gore went to COP30 in Brazil. I was at that as well. He ended up spending his time attacking Bill Gates because Gates is now saying climate isn’t a catastrophe. Gore said Bill Gates was acting ‘silly.’ So, you got Al Gore, attacking Bill Gates, and Al Gore now heckling the World Economic Forum. This is a bad look for the climate movement.”
This article examines Earth’s position in relationship to the Sun as well as solar activity in high spatial and temporal detail across the globe to better understand how the Sun influences weather and climate change.
This article examines Earth’s position in relationship to the Sun as well as solar activity in high spatial and temporal detail across the globe to better understand how the Sun influences weather and climate change.
Daily sunlight data across latitudes is compared with observed trends to give insight into why the climate changes.
Poleward advection of heat from the Equator is covered in detail and used to understand why more ocean heat is being retained in the high condensing zones of both hemispheres.
A simple matrix of Earth’s climate zones and annual seasons is shown to provide a coherent basis for comparing seasonal solar changes from period to period and even year-to-year to understand climate trends and seasonal weather shifts.
Introduction
Earth’s orbit around the barycentre of the solar system and the Sun’s movement relative to the barycenter causes a continually evolving geometric relationship between Earth and Sun.
The geometry of the relationship can be reduced to two variables at any point in time – the distance between their respective centres and the declination of Earth’s equatorial plane to the line between Earth and Sun.
These two variables can be used to calculate the solar electro-magnetic radiation (EMR) reaching the top of Earth’s atmosphere (ToA) and its zenith angle at any latitude on Earth for any specified time.
Distance Earth to Sun
NASA JPL provides daily declination and distance data through the Horizons portal. Chart 1 shows how the daily distance between Earth and Sun has changed relative to the corresponding day in 1920 for the period 1980 to 2030.
The step every 4 years is a result of the calendar reset on leap years. The change in distance influences the intensity of the sunlight reaching Earth according to the inverse of the distance squared. Chart 2 displays how the ToA zenith sunlight changes relative to the corresponding day in 1920 solely due to the changing distance. The solar constant used for this chart is 1361W/m².The gradual daily change in solar intensity over the 50 year interval shown in Chart 2 is primarily due to the varying orbit of the Sun while larger and longer term changes are due to the precession of Earth’s orbit around the barycentre of the solar system. Perihelion occurred on 3rd January 2026 at 147099917km. Aphelion will occur on 6th July 2026 at 152087757km.
Declination of Earth Equatorial Plane relative to Line to Sun
Earth’s axis is tilted relative to its orbital plane causing an observer on Earth to see the Sun daily zenith angle change over a yearly cycle. An observer on the Equator sees the Sun directly overhead on March equinox and September equinox. The maximum northern tilt of the axis toward the Sun occurs on the June solstice while the maximum southern tilt toward the Sun occurs on the December equinox.
Jupiter’s movement around the solar system is in an orbital plane that is not completely aligned with Earth’s orbital plane.
The consequence of this is that both the Sun and Earth move north and south relative to Earth’s average orbital plane. This out of plane variation in orbit results in slight variation of solar zenith declination to Earth’s surface to a greater degree than just the axis tilt relative to the line of the Sun in an annual cycle. Chart 3 shows the variation in daily declination angle from 1980 to 2030 relative to 1920.
Positive value of declination means the peak solar intensity is further north than 1920 for that day of the year and negative value means further south.
Solar Constant
The power output of the Sun is relatively stable but not quite constant. The power output has some similarity to the frequency of sunspots and sunspots have been used in the past as a proxy for the cyclic change in solar constant.
However, a satellite-based monitoring program was established in 2003 and operated to 2019 to provide actual data outside Earth’s atmosphere that was then corrected for Sun-Earth distance to arrive at a measured, distance corrected value for the solar constant.
Chart 4 includes the measured data as well as calculated values from correlation with the Solar magnetic field. This solar constant data series is known as SATIRE-S.
There is no gold standard for the prediction of solar activity but there is good correlation between solar activity and the variation in the velocity of the Sun relative to its average velocity. This is the basis for estimating the constant during SC26 that is forecast to peak in 2037 with slightly higher intensity than SC25.
Trends in Solar Intensity across Latitudes
Knowing the Sun-Earth distance, the declination and the solar constant on a daily basis provides sufficient data to hindcast and forecast the average ToA solar intensity for any latitude for any day. Chart 5 provides an example of the trend in maximum daily average solar intensity at 10N.
Chart 5 is the highest daily average ToA solar intensity for every year at 10N from 1920 to 2040. In 2025, the peak occurred on 18th April. There is an upward trend of 0.63W/m²/century. 10N is the latitude with the largest upward trend in maximum daily solar intensity.
Chart 6 shows solar intensity at 80S for day 295 of each year, which is the latitude and day with the greatest upward trend for daily average solar intensity due to its high sensitivity to changes in declination.
The warming trend of 6.42W/m²/century is the highest for any specific day of the year and any latitude, which happens to be day 295; usually 22nd October.
Chart 7 shows the trend in maximum and minimum solar intensity across the latitudes.
The data exhibited in Chart 7 lacks the hemispherical symmetry that is commonly expected of solar/orbit driven changes. All latitudes have upward trend in minimum solar intensity apart from the polar regions, where the minimum is always zero. All but the latitudes south of 45S have an upward trend with 10N the highest and well above 10S.
If anyone was looking for a cooling surface temperature trend, then the best place would be to look south of 45S per Chart 8.
Chart 8 shows the cooling trend in the Southern Ocean of 1.04C per century, which is consistent with the declining maximum solar intensity.
Chart 9 shows the day of the year for each hemisphere across the latitudes with the highest positive and negative trends.
Both polar regions have higher trends than the tropics with near symmetrical up and down trends in the hemispheres but not quite symmetrical between the hemispheres.
The southern hemisphere polar regions have larger up and down trend than the northern hemisphere.
Trends Driving Changes in Poleward Advection
Heat advection from the tropics to the poles is a significant factor responsible for observed weather, climate and climate change.
The seasonal variation in sunlight is the primary driver of the poleward advection of tropical heat. Advection is the result of heat being accumulated in the tropical zones of each hemisphere being transported poleward to cooler temperature and polar zones of each hemisphere.
In this example, peak solar intensity at 10N and 10S are taken as representative of tropical heat uptake and minimum solar intensity at 40N and 40S to be representative of the lowest temperature in the temperature zones that creates the thermal imbalance driving advection.
The following three charts, 10, 11 and 12 display the trends in both hemispheres for the maximum solar intensity at 10N and 10S: the minimum solar intensity at 40N and 40S and the difference for both hemispheres.
Aspects of these charts that are worth noting are:
All trends are up.
The maximum solar intensity at 10S is almost 20W/m² higher than 10N.
The minimum solar intensity at 40N is approximately 10W/m² higher than at 40S.
The difference in the SH is 30W/m² higher than the difference in the NH.
The difference in the NH is trending up almost 3 times faster than the trend in difference in the SH.
Given the baseline differences and trends, it is reasonable to expect that advection in the SH would be higher than the NH and both increasing.
The increasing ocean heat content predominantly in the temperate zones of both hemispheres is consistent with these changes in solar intensity per Chart 13.
The temperate zones over the oceans are net condensation zones.
The increasing precipitation caused by the increasing heat advection is deepening the thermocline and reducing heat loss from the oceans in these regions.
Surface Temperature Response
The surface temperature across hemispheres and specific locations are highly correlated over any annual cycle, allowing for thermal lag. Chart 14 provides the thermal response to monthly solar intensity for the respective hemispheres.
Once lagged, the temperature is well correlated with the solar intensity. However the NH is cooler season-for-season and has a higher response to lower range in solar intensity than the SH.
The NH temperature response would be 1.6 times the response of the SH for the same range in solar intensity.
Daily temperature readings are also well correlated to daily solar intensity for any selected location as Chart 15 shows for Low Head in northern Tasmania.
Low Head is at latitude 40S and it is noted that the correlation is not as good in the tropics and polar zones because these latitudes often experience surface temperature controlling processes due to water phase changes that reduce the linearity with solar intensity.
Forecasting Weather & Climate
Being able to hindcast and forecast daily sunlight and trends from past to well into the future provides a sound basis for understanding weather changes from year-to-year and longer-term trends.
For example, boreal winter 2025/26 was bound to have above trend snowfall because the NH had above trend solar intensity from March equinox to July solstice but below trend sunlight from September equinox to December solstice per Chart 16.
Compared to 1920, the range in solar intensity from the March equinox to September equinox at 50N increased by 12W/m² – essentially a higher sunlight than average summer followed by a lower sunlight than average winter.
From Earth’s perspective, the exposure to solar radiation can be classified into six latitudinal zones and four annual phases. For the purpose of comparison here, the Zones are:
Northern Hemisphere: Arctic 60N to 90N, Temperate 30N to 60N, Tropical 0N to 30N
Southern Hemisphere: Antarctic 60S to 90S, Temperate 30S to 90S, Tropical 0S to 30S
The annual phases are taken from December Solstice to March Equinox to June Solstice to September Equinox to December Solstice. The zones and phases can be visualised as a six by four matrix or a six by five matric to include the last phase of the previous year as in Matrix 1.
The values for heating and cooling are area averaged across all latitudes for the respective hemispheres. The value for advection in each hemisphere is the difference between the heating season and following cooling season.
Hence the reason for the preceding year SH Heating value being included in the matrix. The NH Advection of 4.35W/m² was above trend. Monsoon days is the number of days above 425W/m² on an area average basis for the tropical zone.
Oceans reach their sustainable limit of 30C at and above that solar intensity. Freezing days are based on days 220W/m² and below on an area average basis for the polar regions. Surface level ice and snow are observed below this solar intensity.
The larger increase in monsoon days in the NH is consistent with the higher upward trend in peak solar intensity at 10N compared with 10S.
However, the SH has a higher number of days in monsoon due to the higher solar intensity in the SH.
Matrix 2 provides the changes for 2026 relative to 2025.
Advection in the NH in 2026 will be lower than in 2025. However advection in the SH will be higher than 2025 as it follows the higher SH Heating in 2025. NH will have slightly milder summer compared to 2025 but noted that it is still above the 1980 to 2010 average by 0.81W/m².
Discussion
Determining the daily ToA solar intensity anywhere over Earth can be derived from three variables – distance, declination and solar constant.
All three can be determined for present, past and future with sufficient precision to be useful for understanding seasonal weather and climate trends. Observed climate trends are well correlated to seasonal and temporal changes in solar intensity.
Changes in weather from year-to-year are also readily related to the year-to-year changes in solar intensity.
Increasing global ocean heat retention is the most concrete evidence that Earth is in a warming trend.
Changes in seasonal solar intensity and corresponding increase in poleward advection in both hemispheres readily explain this warming trend.
Increasing poleward advection also explains the increasing snowfall across the NH with 2025/26 winter predicted to have above trend snowfall per Image 1 as an example of heavy snow. Year 2033 will rival 2025 for NH Heating and NH Advection and year 2037 will have higher NH Heating and higher NH Advection than 2025.
The NH has increasing maximum solar intensity across all latitudes and poleward advection will continue to increase with the difference in area average NH Heating and NH Cooling increasing by 5.1W/m² by 2500 over 1980 level.
By then, advection in the SH will be reducing from present level; down by 0.2W/m² in 1980. By the year 3000, NH advection will be 7.4W/m² above 1980 level while SH will be 3.7W/m² below 1980 level.
Rising maximum solar intensity in the NH will continue to cause increasing global average temperature even when the maximum intensity across the SH is declining. This is due to the higher thermal response of the NH compared with the SH.
The NH will only cool again once the ice starts advancing south. So far only Greenland is showing ice gains at altitude consistent with eventual re-glaciation of the NH. The central plateau has gained up to 2m this century.
Some observed weather phenomena such as the El Nino/La Nina phases of the Tropical Pacific may be better associated with subtle shifts in sunlight than generally considered.
Chart 17 is an example of exploring this possibility by looking at how convective cells compete across the Tropical North Pacific to cause reversal of trade winds in certain years.
The chart shows the difference in solar intensity at 20N 19 days before the September equinox and 10N 4 days before the equinox compared with the Nino34 index in December.
If the correlation has predictive value then the next El Nino phase will be established by December 2026.
Conclusion
Rapid human development has occurred during the current interglacial period of the northern hemisphere.
The SH has largely remained glaciated south of 60S. Historical evidence indicates NH interglacials persist for around 12,000 years, which is half the period of Earth’s orbital precession as shown in Chart 18.
Interglacials of the NH terminate when the peak solar intensity in the NH is increasing because liberating water from the ocean and depositing snow on land is an energy intensive process, requiring some 1400kWh per tonne of ice on land.
So, the oceans need to be warm to produce the atmospheric moisture.
The current interglacial has persisted for 9,000 years since sea level was within 20m of the present level. The peak solar intensity in the NH has been increasing since 1700. Careful examination of the historical evidence shows that temperature increases and sea level rises within 1000 years of the eventual rapid decline in sea level.
All the current climate trends are consistent with approaching re-glaciation of the NH within the current millennium. Accumulation of ice at altitude in high latitudes is an early indicator for the eventual ice accumulation down slope and at lower latitudes.
Energy security and hour-to-hour reliability of energy supplies will be vital for survival of human populations north of 40N living through an era of progressively harsher winters in coming decades and centuries.
The boreal winter of 2025/26 had above trend advection that caused record daily and monthly snowfall in numerous locations. The same conditions of higher than trend summer solar intensity followed by lower than trend winter solar intensity will not be repeated till 2033/34 and will be eclipsed in 2037/38.
The widely held belief that reducing carbon combustion will create perfect weather is a modern cargo cult perpetrated on poorly educated, gullible populations where they fail to examine and understand the evidence.
The Author
Richard Willoughby is a retired electrical engineer having worked in the Australian mining and mineral processing industry for 30 years with roles in large scale operations, corporate R&D and mine development.
A further ten years was spent in the global insurance industry as an engineering risk consultant where he developed an enduring interest in natural catastrophes and changing climate.
An article in the Carbon Brief (CB), “UK newspaper editorial opposition to climate action overtakes support for first time,” documents a clear shift towards climate realism in the United Kingdom: for the first time since CB began tracking editorials, more UK newspaper editorials are expressing skepticism towards the climate alarmist narrative and questioning the wisdom of various policies imposed to fight climate change, than are endorsing climate disaster claims and restrictions on energy use. Whatever one thinks of CB’s framing, the underlying trend it reports is real—and it aligns with a broader, global rise in climate realism.
An article in the Carbon Brief (CB), “UK newspaper editorial opposition to climate action overtakes support for first time,” documents a clear shift towards climate realism in the United Kingdom: for the first time since CB began tracking editorials, more UK newspaper editorials are expressing skepticism towards the climate alarmist narrative and questioning the wisdom of various policies imposed to fight climate change, than are endorsing climate disaster claims and restrictions on energy use. Whatever one thinks of CB’s framing, the underlying trend it reports is real—and it aligns with a broader, global rise in climate realism.
The figure below from CB clearly shows the shift.
Note that shift began in 2022, with the steepest drop in alarmist articles and the biggest increase in articles endorsing a more realistic assessment of climate change and climate policies beginning in 2024 with the crossover complete in 2025.
Internationally, The Heartland Institute’s expanding global footprint has played a visible role in that change. The formal launch of Heartland UK/Europe, described in “The Heartland Institute Solidifies Its Global Impact by Founding Heartland UK & Europe,” reflects growing demand across the United Kingdom and Europe for fact-based critiques of climate alarmism and policy overreach. Heartland UK/Europe’s leadership under Lois Perry has emphasized transparency, cost-benefit analysis, and the difference between measured climate trends and speculative worst-case modeling—messages that resonate with editors and commentators increasingly wary of net-zero orthodoxy.
That shift did not appear out of nowhere, it a clear result of the strategies that have been introduced by Heartland UK/Europe coupled with growing international skepticism over the need for costly and disruptive “climate action” policies.
The Heartland Institute hosts the World Prosperity Forum January 19–23 in Zurich, Switzerland, bringing together international leaders and policymakers to challenge the globalist, leftist agenda advanced each year at the World Economic Forum.
While the World Economic Forum promotes a centralized, top-down vision for the global economy, the World Prosperity Forum advances a prosperity-focused, freedom-focused vision rooted in free markets, individual liberty, and rising living standards.
In the United States, climate realism has gained ground as voters and policymakers have grown more skeptical of costly “net-zero” mandates that promised but failed to produce sweeping benefits, instead delivering higher energy prices and grid fragility. The rollback or weakening of major federal climate initiatives during the Trump years—combined with U.S. withdrawal from several symbolic international commitments—punctured the aura of inevitability that once surrounded global climate governance. Since then, debate has widened, and the assumption that “there is no alternative” to sweeping climate action has eroded.
It is notable that CB itself acknowledges in the article that most critical editorials are not disputing the existence of climate change, but rather questioning policy responses—what it labels “response scepticism.”
That distinction is central to the rise of climate realism. Factual websites such as Climate at a Glance and Climate Realism are filled with data-driven examples showing that many headline claims about worsening extremes, accelerating sea-level threats, or imminent tipping points are not supported by long-term observations. The result has been a growing willingness among editors to challenge whether expensive climate policies are justified by the evidence.
Carbon Brief frames this trend as a “backlash,” but another interpretation is that it reflects either or both the triumph of truth over falsehoods over time or a normal democratic correction. As claims of impending catastrophe collide with real-world outcomes—stable or improving human well-being, declining climate-related deaths, and resilient economies—media institutions are reassessing whether fear-based messaging still holds credibility. That reassessment is visible not only in the UK, but across Europe, North America, and beyond.
In that sense, the Carbon Brief article unintentionally underscores a positive development: facts are beginning to compete with fear. Climate realism—grounded in observed data, historical context, and economic reality—is no longer confined to a handful of dissenting voices. It is increasingly part of mainstream debate, amplified by organizations like The Heartland Institute and Heartland UK/Europe and reinforced by the growing body of evidence compiled at Climate at a Glance and Climate Realism. The world is noticing, and the media conversation is finally starting to catch up.
The curtain is falling on the world’s most expensive soap opera. For decades, a cast of unelected bureaucrats and subsidized academics fought to keep the production alive, but the audience has finally walked out. The climate- crisis clown show is over.
The curtain is falling on the world’s most expensive soap opera. For decades, a cast of unelected bureaucrats and subsidized academics fought to keep the production alive, but the audience has finally walked out. The climate- crisis clown show is over.
In early January, President Donald Trump formally withdrew the United States from the 1992 United Nations Framework Convention on Climate Change and severed ties with over 60 associated U.N. organizations. By ending support for the Intergovernmental Panel on Climate Change- the self-anointed arbiter of planetary truth – the U.S. stopped bankrolling the institutions that have long conspired to dismantle the economic sovereignty of nations.
Mainstream commentators are scrambling to frame this as a retreat into isolationism. But this represents a rational, economic calculation rooted in evidence rather than the hysteria of doomsday cults. What deserves attention, however, is that Trump is merely doing openly what Asia’s energy superpowers have been doing quietly for years.
Beijing long ago stopped pretending to care about the sensibilities of European climate activists. The Chinese Communist Party understands that power- both electrical and geopolitical – comes from hydrocarbons. China is outpacing the rest of the world in building coal-fired power plants at an unprecedented pace.
China is also securing energy lifelines beyond its borders. China National Chemical Engineering signed construction contracts worth $20 billion for the Ogidigbon Gas Revolution Industrial Park in Nigeria. Beijing-based Sinopec committed $3.7 billion to construct an oil refinery in Sri Lanka. Chinese financial institutions have lent $52 billion to Africa’s energy sector, with about half going to fossil fuel projects since the early 2000s.
China’s construction of the Kyaukphyu deep-sea port and Special Economic Zone in Myanmar serves as another telling indicator. Valued at approximately $7.3 billion for the port itself and $1.3 billion for an adjacent economic zone, this project will be a strategic bypass around the congested Malacca Strait – a chokepoint through which over 70% of China’s oil and gas trade passes.
The signal is unmistakable: China is not preparing for a post-hydrocarbon world. It is ensuring reliable, diversified supply chains for energy resources, especially oil and natural gas.
India, too, has quietly ended its flirtation with Western green agendas. Indian consumption of petrochemicals is set to grow by 6-7% annually. To meet this demand, India is aggressively expanding oil and gas exploration and refining capacity. In November alone, Indian processing of crude oil grew to 22.3 million metric tons, a 2.3% increase from the previous year.
Late last year, the Indian government auctioned blocks of coal with combined geological reserves of over 3 billion metric tons. India’s planning documents ignore natural gas as a “bridge fuel” and identify coal as the nation’s mainstay fuel.
Worldwide, there are 460 coal plants under construction. Another 500 have been permitted or are about to be, with an additional 260 new plants expected to be announced. The vast majority of all this activity is in China and India.
These nations are not “transitioning” from coal; they are cementing its dominance. Even Indonesia, which was once the poster child for the West’s “Just Energy Transition Partnerships,” has faced reality as it canceled the early retirement of the massive Cirebon coal-fired plant.
Trump’s withdrawal from the U.N.’s climate tyranny and the parallel actions of Asian energy giants are a recalibration of global priorities. Nations are reasserting the right to pursue policies rooted in their own economic interests rather than follow “international” edicts of a favored few. Governments and businesses are investing billions in extracting and transporting hydrocarbons. Ports, pipelines and refineries designed to function for decades are being built.
The Trump administration has simply ended American participation in a system that was already irrelevant to the actual decisions being made by the world’s major energy consumers.
In part, the narrative of an “energy transition” survived by being presented as inevitable. That sham has been exposed. A transition likely will occur someday, but only when new technologies prove to be affordable and reliable.
In the meantime, expect more exits, more quiet defiance, more recalibration. Climate rhetoric will continue to diminish as investments in hydrocarbons accelerate.
Originally published in Townhallon January 25, 2026.
Vijay Jayaraj is a Science and Research Associate at the CO2 Coalition, Fairfax, Virginia. He holds an M.S. in environmental sciences from the University of East Anglia and a postgraduate degree in energy management from Robert Gordon University, both in the U.K., and a bachelor’s in engineering from Anna University, India. He served as a research associate with the Changing Oceans Research Unit at University of British Columbia, Canada.
In this in-depth interview, economist and statistician Ross McKitrick discusses climate models, uncertainty, and whether the public climate debate is as scientifically balanced as often claimed. He also reflects on his role as a co-author of the recent U.S. Department of Energy report.
In this in-depth interview, economist and statistician Ross McKitrick discusses climate models, uncertainty, and whether the public climate debate is as scientifically balanced as often claimed. He also reflects on his role as a co-author of the recent U.S. Department of Energy report.
Professor Ross McKitrick, full professor of Economics and Finance at the University of Guelph in Climate: The Movie
Ross McKitrick stands out as one of the most well-known critics of mainstream climate science conclusions. He is a Canadian economist and serves as a full professor in the Department of Economics and Finance at the University of Guelph in Ontario, where he has been on faculty since 1996. With a strong background in econometrics and statistical methods, he has directed these skills toward examining climate datasets, temperature records, and the structure of climate models, often generating significant discussion and controversy in scientific circles.
Outside of his university role, McKitrick holds the position of Senior Fellow at the Fraser Institute, a prominent Canadian think tank. He is also affiliated with the Global Warming Policy Foundation (GWPF) in the UK, where he serves as a member of its Academic Advisory Council.
McKitrick first gained widespread attention by disputing the famous “hockey stick” reconstruction of global temperatures. He has consistently questioned whether mainstream climate models may exaggerate warming trends.
In mid-2025, McKitrick served as one of five members of the Climate Working Group (CWG), an independent panel of scientists convened by the U.S. Department of Energy. In July of that year, the group published a comprehensive 150-page report that aimed to review the conventional assumptions about the effects of greenhouse gas emissions on the U.S. climate.
1. How do you respond to the allegations that the recent DOE report in which you are a coauthor was produced to “manufacture a basis to reject” the accepted science on human-caused climate change and its impacts?
Our report overlaps quite a bit with the IPCC, and we don’t actually contest the basic scientific issues. What we were asked for specifically was a report that will look at some important topics that tend to be downplayed or overlooked in the public discussion. But we don’t reject the idea that CO2 is a greenhouse gas, for instance. We don’t reject the idea of there being climate change.
We look at things that go into a bit more detail. For instance, do climate models tend to over-predict warming? And we present evidence that, yeah, that is a pattern that shows up. Is CO2 associated with global greening and improved agricultural productivity? And yes, we present quite a bit of evidence on that point.
We talk about areas of natural variability in the climate that are often ignored in the public discussion and are downplayed by the IPCC. Our aim with the report is to expand the public discussion, not to shut it down or try to disparage climate science.
2. How much autonomy did you have in shaping the report’s key conclusions versus aligning with the collective views of the five-member Climate Working Group?
We had complete autonomy. When we were assembled, at first, we thought we might have some role in what was called the endangerment finding process, which was the EPA’s submissions regarding the 2009 endangerment finding. But right away they told us we’re not involved with that. That was a separate team. We didn’t have any contact with that group. We were just told, write a report on whatever you think is important.
So that’s what we did. We just worked as a group. We decided on the topics we wanted to write about. We wrote our report. The first draft then went through an internal review process at the Department of Energy. There were scientists from the Energy Department National Labs who made peer review comments on it. We revised the report in response to those. But we had absolutely no political oversight or direction from anyone in the administration.
3. You’ve said you’re not familiar with the EPA’s legal filings, yet that report is now cited in attempts to overturn the endangerment finding. How comfortable are you with the report being used in regulatory and legal contexts you did not help to shape?
That was a decision of the EPA staff. If they had asked us for input, I suppose we would have offered it. But we put out the report for people to use.
What we wanted to do was make sure that we’re putting forward what we think are valid scientific and economic arguments that should be part of any discussion around climate change. That was our aim, and I think we achieved that.
4. Was there any pushback from you or your co- authors on the scope or wording?
Sure, we exchanged drafts, and sometimes we agreed readily on wording, and other times we disagreed, and we had to argue it out among ourselves. But the final version reflected all five of us going through line by line and coming to an agreement on what it should say.
5. The DOE report has been criticized for allegedly cherry-picking data and omitting broader bodies of research. How did you decide which datasets and studies to include or exclude – and why should the public trust those criteria?
Well, let me say first, the report was put out. It’s a draft report; it was put out for public comment. So, we know that there are people on the other side who didn’t like our findings, and we received hundreds of pages, tens of thousands of comments.
Unfortunately, there was a lawsuit that was filed against the Department of Energy by some environmental groups, and there was a procedural error on the administration side. So, we weren’t set up in compliance with something called the Federal Advisory Committee Act, which meant they had to close our group down.
Individually, we’ve gone through these responses, including the accusations of cherry-picking or misrepresenting, and we’re preparing notes and responses. I hope that we will eventually be able to present the public with what would have been normally the second round of this, which is full responses to all the criticisms and revision of the report with the corrections where they’re necessary, but also the counterarguments to our critics.
I can give an example. For instance, where the critics were right, which is on the discussion of agricultural productivity: there’s no discussion in our report of the effect of extreme heat episodes on crop productivity. Well, that was an omission; we should have had something in there. I’ve looked through that material and made notes on what should have been said. It doesn’t change the overall conclusion. Historically, the gains in crop productivity due in part to CO2 fertilization are very real. So, the overall point still stands, but it still needs to be mentioned that people in the agricultural community need to work on resilience to increased episodes of extreme heat.
Another case where the critics, I believe, are not correct: we argue that it’s the low climate sensitivity models that do the best job of reproducing the last 50 years of the climate record. They said we looked at studies that support that, but they gave us other studies that they said don’t support that. I’ve looked at those other studies, and in fact, they all do support it. I don’t know why the critics seem to think that those other studies said something different. We could have used any one of the studies that they sent us. They all say the same thing. They may phrase the conclusion differently, but they all make the same point: the surface and troposphere warming record of the past 50 years is well reproduced by the low climate sensitivity models. The high sensitivity models project too much warming, and I think that’s a very important piece of information as people consider what to do with these 40 different models that paint very different pictures of the future. I think the fact that the low ECS models are doing the best job of reproducing the recent past is an important piece of information.
6. When is the second, revised report due?
At this point, there isn’t really a schedule to speak of. The situation- and it’ll sound very strange; I’m Canadian, so the U.S. legal proceedings seem very strange to me- is that in response to a ruling from the court, the Department of Energy disbanded the Climate Working Group and has given an undertaking to the court that our work is completed, and we’re respecting that ruling.
What we need to do as individual members: we’re still free to write, speak, and talk about climate change. So we’re just trying to figure out individually how to proceed. My hope is that at some point this year, in the early part of the year, we will be able to complete this work and present a complete response to the main scientific criticisms and responses that we received. I know the other members of the working group were very keen to do this, because obviously we want to defend our work, but also because some people put a great deal of effort into critiquing our report, and so they deserve to see a constructive outcome of that process.
7. Did the group attempt any formal uncertainty quantification that’s comparable to methods used in IPCC or national climate assessments?
Well, looking at precipitation, John Christy and I had previously co-authored a paper using econometric methods to evaluate the uncertainty of trends in averages and extremes, and that publication came out, I think, about five years ago. So, we updated the data set, expanded the geographical coverage, and used the same methods that are drawn from the peer-reviewed econometrics literature.
Similarly, looking at the discrepancy between models and observations in the troposphere, that was work that John and I published in the climate literature. We updated those data sets for the purpose of the report so that we could present the most updated possible material. But in those cases, we were using public data sets and standard econometric methods; we weren’t inventing any new methodology.
8. If you could amend one section of the report in response to the widespread scientific critique it has received, what would you change?
Well, I think eventually, when we do get the revised material out in whatever form that comes, let’s see: on the economics material, one of the criticisms there was that in presenting the Nordhaus integrated assessment modelling results, I focused on how close the temperature outcome is between the unregulated and the optimally regulated path. A critic pointed out that that’s true, while the emissions paths diverge more than I had discussed, so that’s something that I should have picked up on and introduced.
Then there are other extensions to integrated assessment modelling that more formally represent uncertainty and risk aversion. I’ve since digested that material and written up summary discussions of it. So that’s, again, an example where the critics made valid points. We covered a lot of material, and we only had about six weeks to do it, so you can’t expect to cover everything. But people have pointed to stuff that should have been in the report, and I think in the end, what we add in response to the critics leads us to a report that does an even better job, in my view, of what we set out to do, which was to expand the discussion around climate change and present people with a more complete picture of what the debates are and what the data is showing.
9. Why was the group given only six weeks to work on a such a substantial issue?
Out of our control. I think what they had in mind- we’d have been happy to have six months to a year to work on it- but that was the remit. Now, like I say, the idea was: draft is going to go out, there’s going to be a public comment period, and then there’d probably be about a four-month period where we’re dealing with the comments and preparing a revised report and a set of responses to all the criticism. So, the whole process would have ended up taking upwards of a year. The lawsuit threw all that off the rails, and so that’s why things seem to come to an abrupt end. But I think originally the idea was the whole process- draft, comments, revisions- would have been a much longer and slower process had the group been given about six months or a year of time.
10. How do you think the report would have turned out if the group had been given six months or more to prepare it?
We would probably have still had the same table of contents, in the sense that these were the topics we wanted to talk about. More time would have given us the opportunity to consult with other people, including people who eventually became critics. Also, bear in mind, we heard from a lot of people who were quite supportive of our report and endorsed our treatment of these issues.
Personally, if the lawsuit hadn’t come along, we were looking forward to the comment, review, and revision stage. When you do a big project like this, you can’t expect to cover everything. It’s a huge field, there are many experts, and of course, there are going to be people out there who know a great deal more about a specific topic than any of us do. So, they’re the ones we wanted to address a topic and then get their feedback, whether supportive or critical.
When I got involved in it, I knew that putting the initial report out is actually a small part of the whole project. The big part is going to be processing all the responses, dealing with the public comment pùeriod, and the professional criticisms. That would really be where we come up with the final work product that we’re aiming for. So, if we’d been given more time, that wouldn’t necessarily have resulted in the ideal outcome. The key really was the comment process and the revision process—the whole peer review process.
Ironically, the environmental groups that sued the Department of Energy, their complaint was that our report didn’t go through a type of peer review they thought we should have. But it was a lawsuit that has so far prevented that process from being completed. It’s one of these unintended consequences of the court system.
I do think, in those areas where I’ve gone through the criticisms and looked at the literature they said we should have covered, that our basic message still holds up quite clearly and, in some cases, is even stronger. Now we can say that this represents not just the five of us, but the wisdom of a larger community, including the whole peer review community.
11. What’s the most common misunderstanding among your critics about what the report actually claims – and what’s the most common misunderstanding among your supporters?
That it’s an attack on climate science- it’s a ridiculous thing to say. I think anyone who spent any time reading the report would realize that it’s not an attack on climate science. We rely heavily throughout the report on the IPCC reports. We cite the National Climate Assessment reports. But we also believe that there are important topics and discussions that are downplayed or ignored that really should be put on the table for discussion. That’s what we’re trying to do: we’re trying to make the discussion completer and more comprehensive, not attack it.
12. Why do you claim that the U.S. Clean Air Act is not a good framework for greenhouse gas policies?
It was set up to deal with local urban air pollution issues. The framework of the Clean Air Act divides the country into attainment and non-attainment zones and authorizes the EPA administrator to prescribe local emission requirements on power plants and motor vehicles in order to get non-attainment zones into attainment, meaning get specific types of air pollution down to a criterion level. That whole framework doesn’t make any sense at all for a globally mixed greenhouse gas like carbon dioxide.
There’s no such thing as a non-attainment or attainment zone for carbon dioxide. You’re looking at a uniform level that’s mixed into the troposphere, and there’s no rule that you can prescribe for motor vehicles or power plants in the United States that’s going to unilaterally change the global CO2 concentration, much less change the local climate. So, if your concern is that there’s too much warming in the city of Philadelphia, that doesn’t tie to cars and power plants in the Philadelphia area. That’s a local effect of a globally mixed phenomenon.
For that reason, it was the Clean Air Act- which, clearly in my view, I’m not a lawyer- was set up to deal with urban air pollution issues and has been very effective for that. But it’s just the wrong framework for thinking about carbon dioxide and global climate issues.
13. Climate models are central to the IPCC’s projections, but you’ve raised concerns about their limitations. How well do you think these models, and the IPCC’s methods for quantifying uncertainty, reflect the true risks of future climate change- and are there alternative empirical approaches or data sources you believe should play a larger role?
I don’t put a lot of weight on the IPCC’s statements about confidence. They tend to be very subjective, and some of them don’t make a lot of sense. For instance, we pointed out that the IPCC has accepted that it’s very clear that climate models as a group put way too much warming in the troposphere, and they cite lots of papers, including papers I’ve co- authored that show that, and yet they assign it only medium confidence. And yet, they assign very high confidence to other issues where the evidence basis is quite weak. Some of those statements, it seems to me, tend to be subjective and put in there for rhetorical purposes—to try to emphasize messages rather than communicate the actual strength of quantitative information.
Now, I don’t know what the alternative would be; it’s difficult to summarize large, complex topics in a meaningful way. But I think specifically the IPCC has used a very poor methodology for attribution. I think the optimal fingerprinting methodology is extremely flawed, and I’ve published papers explaining why. I think it tends to miss the role of natural variability in a systematic way and overstate the role of anthropogenic forcing, and they’ve assigned way too much confidence to the results of that.
Also, the IPCC- and this goes back 20 years now- tends to put out families of emission scenarios that include an upper tail that should not be there, that historically don’t validate against the data, and just in terms of the storyline behind them, doesn’t make sense. They get very cagey when pressed on why they have these emission scenarios that are just not credible. I think it’s because it gives them the rhetorical advantage of being able to put out a range of warming projections and then say it’s going to be six degrees or something like that. By the time that appears in a newspaper or a public setting, people lose the subtlety that this is an extreme upper end, and they think the IPCC is actually projecting that much warming.
That’s a case where I think the way they handle the range of uncertainty around emission scenarios ends up serving to mislead the public discussion rather than center it on the most realistic and plausible outcomes.
14. How do you assess the cost-effectiveness of current climate policies, and are there specific approaches you believe could achieve emissions reductions more efficiently?
Well, that’s a big topic. Cost-effectiveness, I would say, is not achieved in general by most of the climate policies we’re familiar with, especially things like renewables—solar and wind. It’s just, in my mind, a terrible tragedy how much the world has spent on those power systems, and we get almost no useful electricity, or a tiny amount, at an extremely high cost.
Then things like the EV mandate: these issues are playing out in Canada the way they’re playing out in so many other countries around the world. Governments seem too willing to allow corporate interests that see this as an opportunity for making a lot of money by selling the government on a technology that requires the government to back it up with regulatory force. EVs would have a presence in the automobile market, the technology is improving, and there will be people who want EVs and prefer them to gas-powered cars. But these mandates are trying to force that through way ahead of schedule. It’s very profitable for certain automakers and the industries that support them, but it’s very costly for consumers and harmful to the traditional auto sector.
So that is not a cost- effective approach, and it doesn’t even reduce emissions very much. EV mandates have minimal effect on greenhouse gas emissions for all the costs.
The economic approach- and one of the points I tried to get across in the economics chapter- is more concerned with sending a price signal into the market as best we can concern the social cost of CO2 emissions and then stepping back and letting the market respond to that price signal. Because of the role fossil fuels play around the world, and the necessity of energy, there won’t be a big response in terms of emissions. It’s very expensive to reduce fossil fuel use, and with current technology, we just don’t expect to see a lot of short-term reduction in emissions.
Down the road, it might get cheaper. There might be a way to decouple CO2 emissions from fossil fuel use. There isn’t at present, but there might be. We have decoupled particulates, sulfur, and carbon monoxide from fossil fuel use, but we haven’t figured out how to do that with carbon dioxide yet. Once we do, lower-cost options will appear, and that’s when you would see much more cost-effective approaches to dealing with CO2 emissions.
So, the economic reasoning here has always been: for the time being, we’re just going to have to learn to live with it, hope it doesn’t become a crisis, and assume that there will be technological improvements, maybe in the latter half of the century, that make the problem easier to solve.
15. What are your thoughts on the net-zero mandate?
On the net-zero mandate, I think it’s, at best, a very misguided attempt by politicians to look like they’re doing something heroic, even though they have no idea how they would actually implement it. At worst, I think geopolitically it is causing Western countries to seriously weaken their industries and capacities. It’s creating an opening for some hostile governments, including Beijing, to establish a presence around the world in other countries that weren’t able to get financing for their own power plants and fossil fuel development, because the net-zero agenda in the West caused the money to disappear for those projects. This allowed the government of China to take control of a lot of developing countries in a way that I think is hostile to those countries’ interests.
16. Do you think economists are systematically better or worse than physical scientists at reasoning about deep uncertainty- and what blind spots does your own discipline bring to climate questions?
Economists, I will say, have an advantage in that the average economist has a lot more training in quantitative methods, econometrics, and statistics than the average physical scientist. One of the reasons I got into publishing in climate science journals was that there were a lot of issues where the methods being used are really drawn from economics and econometrics, but they weren’t being used very competently in physical science journals. I think economists do a better job of statistical reasoning and statistical analysis.
As far as reasoning about deep uncertainty, everybody grapples with issues around trying to say something sensible about things that might or might not happen 100 years from now. Economists are used to studying something- namely the global economy- that has changed really dramatically, so we know that today’s technology isn’t necessarily going to be the same as tomorrow’s technology. We know that incomes and standards of living can change dramatically over 100 years. Physical scientists, on the other hand, are studying systems that tend to be very stable and not change a whole lot, so they are very alert to anything that looks like it has changed appreciably over the last 50 years or so.
For economists, I suppose our blind spot would be that if you tell us the world could warm a couple of degrees and that could have a lot of big effects, we would, in the first instance at least, just shrug and say, okay, well, we can live with that. The progress of income and technology means that we probably won’t really notice the change very much when we think about everything else that’s going to change over the next 100 years. Physical scientists, by contrast, would be a lot more alert to the potential for harmful surprises and unprecedented changes.
17. How do you distinguish between methodological skepticism and motivated skepticism in your own decision-making- especially when results align with your priors?
I am not entirely familiar with the terms, but I think what you’re getting at would be: methodological skepticism is just what you expect scientists all to have- they want to challenge conventional wisdom and test how strong the evidence is. I guess motivated skepticism would refer to more of a partisan attitude- that you want to score points for your side and downgrade the other side. I would assume that everybody is susceptible to the latter.
Everybody involved, including in the physical sciences and the hard sciences, gets wedded to their paradigm and preferred way of looking at things. In some cases, you have people who have built their whole career on a certain theory, and so if data comes out that seems to contradict their theory, they’ll be the ones who try to attack it. To my mind, there’s nothing wrong with that as long as everybody’s analysis is transparent.
I think the real key in the end is: when you put out your work, do you release your data, do you release your methods, do you write it up in such a way that readers can see exactly what you did? That gives the reader the chance to evaluate your work. Motivated reasoning on its own is not necessarily a problem if it leads you to the right answer. It becomes a problem if it leads to deceptive practices- if you’re trying to hide it by not releasing your data, or you’re fabricating things.
That’s where we have to be on guard. In my case, I try to be very conscientious about releasing my own data. I would say that things have improved in climate science, but there’s still a lot of papers out there where I read a paper and want to check the author’s work, and it’s very hard to find their data, or they’ve posted it in a way that you can’t really use it, or you need to ask them for special software to make it workable. I think that’s still a problem in a lot of scientific areas, including climate.
18. What institutional incentives most distort climate research today: funding structures, publication bias, media framing, or political demand for certainty?
My observation is that here in Canada, the grant funding agencies have moved away from just open-ended, curiosity- driven grants. They’re much more prescriptive. There’ll be specific topics that they want to see studied, and the announcement will tend to build the conclusions right into the research design.
For instance, it’s fairly common now to see federally funded research grant competitions centered around how to reduce greenhouse gas emissions or measuring the harmful impacts of climate change on society. When you announce a grant like that, you’ve presupposed the kind of work that you’re willing to support, rather than just letting scientists propose the topic and get funding based on the quality of the proposed research. So, granting agencies are a problem.
Journals: you can still get stuff published, even if it goes against the narrative. But I have, over the years, including in recent times, had experiences where the journal editors- even if your results point very strongly to, for instance, carbon dioxide not being a dominant role in temperature change- some journal editors just say, “Don’t phrase it like that; try to downplay that.” They don’t want to- one just said, “This is settled physics; I don’t want to open that can of worms.” Even though the results said what they said, that was the editor putting limits on how we could describe the results.
At the same time, there are enough journals and editors out there that, if you keep at it, you can find editors that will let you publish your results, if they are solid and pass peer review. So, I don’t accept the view that there’s nothing but gatekeeping out there in climate science. There’s some, but I don’t think it’s any worse than other disciplines.
19. Do you believe think tanks- on either side of the climate debate- have made it harder for the public to understand uncertainty honestly? Please include organizations you’ve worked with in your answer.
There are different types of think tanks. I mean, advocacy organizations, like environmental groups, for instance, that don’t really aspire to be called a think tank- they’re more lobbyists and advocacy activist groups. I think they have done a lot to muddy the waters with extreme language.
I would also point out the Secretary- General of the United Nations. I think he’s the most irresponsible voice on this issue in the world. He makes absolutely crazy statements. When the IPCC- 6 assessment report came out, he said it was a “code red” alarm and all these things that the report supposedly was warning people about, and it didn’t say any of that. He was just making it up. I would begin with him- Guterres. I think he’s highly irresponsible.
When he does things like that, and climate scientists don’t step up and correct the record, I guess they’re in a difficult spot, but that’s where I think they should be more active in policing that side of the issue.
The think tanks that I’ve been involved with tend to be focused on economic policy issues. There’s a strong overlap between the economics work that comes out of think tanks and what’s in the economics literature. Here, I think it can come as a surprise for people to realize that the mainstream economics profession, over my lifetime- I’ve been at this since the early ’90s- has never really endorsed aggressive climate policy. I’ve never seen much interest in economics in the net-zero agenda, just because the costs and benefits don’t line up that way. So, the economic analysis that I’ve done through think tanks tends to follow very closely what’s going on in the peer-reviewed economics journals.
The think tank world, especially in the United States, is huge. There’s an awful lot of them, and some are very focused on science issues, some are focused more on energy and the power grid. If you’re in a country that doesn’t have a lot of, think tanks, it looks like these are big, powerful groups with a lot of influence. But in reality, there’s so many of them that no one think tank tends to drive the whole process—they’re all kind of countering each other.
20. Is there a climate policy you oppose not because it’s ineffective, but because it violates a principle you believe economists should defend- even if emissions fall?
Well, this would apply more broadly than just climate policy. The economic mode of thinking about public policy, which I support, is that we should look for policy options that interfere as little as possible with people’s autonomy. Especially if you have a case where two policies will achieve the same outcome- one through voluntary market measures, and one that requires the government to dictate consumption decisions and daily activities of the population- we would far prefer the first one. Even if they achieve the same outcome, just allowing people autonomy is an end in itself.
In the case of climate change, this is a very vivid issue, because economists have long been drawn to the idea that you can address this issue with pricing, with a market mechanism, preferably a carbon tax. Once it’s there, you stand back and let people make their own decisions about how they respond. Some people may respond by cutting their fossil fuel use a lot, and some people may not cut their fossil fuel use much at all and instead pay a higher fee. But you let them make that decision.
Unfortunately, policymakers -even in Canada, where in principle they supported a carbon tax- as soon as the carbon tax was in place, decided they weren’t willing to keep their hands off the economy. They brought in over 100 other policies that try to prescribe daily decisions down to what kind of light bulb you can buy, what kind of washing machine you can buy, what kind of car you can buy, and rules around the insulation you need in your house- the list goes on and on.
Economists don’t like that because it tends to be very inefficient. The cost ends up going through the roof, and you don’t accomplish much more. But intuitively, most people also realize at a certain point that we don’t like this because it’s intrusive and feels like social control. And if it’s not actually accomplishing anything, then it’s even more objectionable.
21. What do you think mainstream climate scientists misunderstand most about economists’ critiques- and what do economists misunderstand most about climate scientists’ constraints?
In my experience, climate scientists just don’t appreciate the downside of limiting access to fossil fuels. Or maybe they think that somehow, we could easily replace them or sustain our standard of living without them- but that is not the case.
As far as what economists perhaps don’t understand about the physical sciences, well, there’s a long list. Most economists don’t really know a whole lot about meteorology, climatology, climate modeling, or what the basic data sets are. If there is one particular issue that climate scientists probably wish economists knew more about, it would be the possibility for nonlinearities and certain unexpected changes in the climate system due to its chaotic nature.
22. Are there aspects of mainstream climate science you now think deserve more serious re-evaluation?
Yes- attribution, optimal fingerprinting. I think there’s a lot of just wrong results in the literature. The IPCC embraced a methodology that even a lot of its practitioners didn’t understand, and they just liked the fact that it kept generating positive results without looking into whether it was a valid statistical method. I think that needs serious re- evaluation. We said that in the DOE report. The responses- hardly anyone commented on that. The one person who filed some responses didn’t try to defend it; they said, “Well, we have some other methods that we use now.” But I’ve looked at the other methods, and I think they’re just as bad, and in some ways worse. They get into some more complex time series econometrics issues that I don’t think climate science journals are really equipped to deal with at this point.
Another issue is extreme weather attribution. That’s somehow become a mainstream topic. Here again, it’s a methodology that got embraced right away without any serious look at its deficiencies, and the fact that it keeps generating what look like positive results rather than the practitioners asking whether they like it because it keeps telling them what they want to hear. I think they should be much more cautious.
Now, there are some people in the extreme event field who are very cautious. One of the criticisms we got in the DOE report was that we were critical about the focus on the World Weather Attribution group- they’re a huge public relations machine and get a lot of media attention. Some of our critics said, “We don’t paint us all with the same brush. We’re not all like that.” And they’re right: there are a lot of people in the extreme weather analysis field who are very cautious and don’t rush to conclusions in that way.
But I think the dominant players now in the extreme event attribution field are going to make a similar mistake- similar to the hockey stick graph, similar to optimal fingerprinting- grabbing hold of a methodology they don’t really understand because they like the results it gives them.
23. In your experience, how much of U.S. climate policy is driven by scientific evidence versus political or economic considerations?
Very little. I think if this were a situation where you could fully address the problem at a very low cost, people would just defer to the scientific advice and go with that. In the case of chlorofluorocarbons, when it emerged that they were destroying the ozone layer, there was also an inexpensive solution. There were substitute products that addressed the issue. There was no real commercial interest in the old CFCs, so it didn’t really cost anything to say, “All right, we’ll just take a precautionary approach, ban these CFCs, and mandate that you have to use the alternative.” There were some costs, but really pretty small, and no one really noticed. That would be a case where the scientific findings, for all their uncertainty, were used to guide the outcome.
The problem with climate, though, is that it really ties into the use of fossil fuels. Whether you’re an oil-producing country or not doesn’t really matter- every country is using oil, gas, and coal, and is dependent on fossil fuels for their economic standard of living. It’s inevitable that people are going to dispute the policy decisions intensely, and there will be a lot of politics in that.
It’s also the case that the science is just a lot more uncertain. The debate isn’t whether carbon dioxide is a greenhouse gas; the debate is how big an effect it has on the climate and how much harm it would really do if it does happen. Those are much more difficult questions, and those gaps of uncertainty are going to get filled in with a lot of politics.
24. Looking back, what did Climategate reveal about the norms of climate science—like data sharing or peer review- that genuinely needed reform?
People put way too much stock in the term “peer reviewed.” I think it might have been a public perception that if something appeared in a peer- reviewed journal, that meant a whole team of reviewers had gone over it and made sure there were no errors. Part of the surprise for people with Climate Gate was to realize that no, that’s actually not how peer review works. Very rarely do peer reviewers actually look at the data or try to replicate the analysis. It can be quite a cursory review.
Another surprise for people, I think, was that the Intergovernmental Panel on Climate Change- up to that point- the rhetoric had been that this is thousands of the world’s top scientists, and they all go very carefully over the evidence and come to an agreement on what it all means. What you could see was, no, it’s little pockets of scientists that work on different parts of the report, and they just decide among themselves what they want to say. If there’s counter- evidence, they have a lot of authority to just ignore the stuff they don’t like. I think it gave people, in that sense, a more realistic look at how large reports like that actually come together.
25. Have you ever received funding from the petroleum industry to support your research?
No. Most of my research- I don’t get funding at all. I’m at a point now where I just use public data sets and R, which is free software, so it doesn’t cost anything to do it. I don’t have to hire research associates or assistants.
The funding I’ve received over the years came from the federal government, the Social Sciences and Humanities Research Council. I did actually once get a grant from a George Soros- funded group, surprisingly enough. It was the Institute for New Economic Thought, and they liked a project proposal I submitted, so I got funding from them- but that was just the one time.
No, I haven’t had external research funding for a long time, because, as I said, I don’t run a lab, I don’t have employees, and I don’t need any funding.
26. Stripping away the politics, what does the hockey stick episode show about the strengths and limits of paleoclimate reconstruction?
A point that Steve and I tried to make was that the methodology was flawed. It was just wrong, and yet a lot of scientists used it. They reused Mann’s flawed principal component algorithm, and I think because they liked the results, it generated a nice- looking hockey stick for them. The IPCC took that result, even though there were other reconstructions in the literature at the same time that didn’t show the same result, but they ignored those. They emphasized the hockey stick and promoted it heavily.
That whole episode, I think, revealed- well, you used the term motivated reasoning earlier- and I think it revealed that in the leadership of the IPCC, there is motivated reasoning going on. They have a narrative they want to promote, and they are very alert for studies that support the story they want to tell. Sometimes motivated reasoning leads you to the right answer, but that was a case where they ignored counter- evidence and used a flawed study where the data didn’t really support the conclusion, so it led them astray.
27. Your research has often questioned higher estimates of climate sensitivity. Based on current evidence, what do you consider the most robust range for climate sensitivity, and why?
Well, on sensitivity, I defer to someone like Nic Lewis, who is much more knowledgeable about the statistical analysis. In the work that John Christy and I have done, we framed it more in terms of which models can reproduce the observed climate changes. The answer is the models that have the lowest sensitivity. Even there, if you look at the mid-troposphere, there’s still too much warming and too much amplification with altitude.
Based on that analysis, I would say the models with the lowest climate sensitivity- right now in the range of about 1.8 to 2.5 °C- are the ones that seem to get the right answer. That’s where I think we should be looking in terms of understanding the overall sensitivity of the climate system.
In the DOE report, we discussed various arguments about why the climate system may be more sensitive than the models show, because future pattern effects could emerge that amplify sensitivity. I think that’s an important line of research, but we also pointed out that the main pattern effect being discussed is a temperature gradient in the tropical Pacific. There, the historical data runs opposite to what the models show- the gradient isn’t strengthening the way the models say it should. Going through the responses, critics conceded that this is what the data show but argued it might change in the future. I think, okay, I’m open to that, but it’s a pretty weak argument at this point.
An article in the New York Times last month on Harold Hamm was in the long tradition of Big Oil, Big Politics, Big Corruption. “The Oilman Who Pushed Trump to Go All In on Fossil Fuels” (December 12, 2025) was authored by Eric Lipton and Rebecca F. Eliott.
“Will Rebecca F. Eliott dare investigate the other side of her favored arguments and dare again, alter her perspective? Will her readers and the New York Times allow her to do so? The times are a changing….”
Eliott’s bio is titled “I cover energy for The New York Times” and reads in part:
“Many of my stories explore how energy shapes — and is shaped by — politics and economic policy…. I joined The Times in 2024 from The Wall Street Journal [and] … The Houston Chronicle…..”
The biased, superficial article prompted me to write this letter to Eliott. Dated December 14, 2025, I have not heard back.
Hello Rebecca:
I just read with interest your article on Harold Hamm, which is in the tradition of ‘big oil politics.’ I have covered this narrative in many books and articles since the 1970s (see MasterResource and type your search term).
You should consider doing another piece on the intellectual movement behind Chris Wright (et al.), which comes from Alex Epstein, who as the “first philosopher of energy” has sharpened the arguments for the free-market, human-betterment narrative. Also, Robert Bryce. I think these two (and me) will not fit the narrative of Big Oil Politics…. Ditto for the Institute for Energy Research (IER), which I founded out of my house back in 1989 (a ‘think bucket‘).
In your research, you should read about my opposition to Enron’s ‘green’ energy policies (I worked there for 16 years). What is crucial is understanding the principled view of free-market capitalism versus political capitalism (same website).
The classical-liberal intellectual movement has long been in the wilderness with climate issues, which replaced Peak Oil, Peak Gas, and (yes), a flirtation with global cooling (question ‘ExxonKnew’ in this regard).
I hope this is of interest to understand the major changes now underway with U.S. and global energy policy.
Best wishes, – Rob Bradley
P.S. The major global energy issue, in my view, should be privatization of the subsoil (mineral rights), not climate change. Royalties for the masses, not the (corrupt, crony) State.
The saying is that you can lead a horse to water but you cannot make it drink. Will Rebecca Eliott dare investigate the other side of her favored arguments and dare again, alter her perspective? Will her readers and the New York Times allow her to do so? The times are a changing….
They are going to come out of the woodwork, but fortunately, a nice trap was set for them over a month ago, using weather from over 40 years ago.
Just before the Ice Age scare of the 70s turned into Gore’s Global Warming Apocalypse.
From 1984-1985. You can not find a better set up. And that I showed it dozens of times laid the trap they are already walking into.
I love this. Remember how much I was tweeting about the similarities to late December 1984 and the wicked cold that invaded in January? Look at this: deviations from normal December 26–30, 1984, and 2025,
followed by a cold wave in January in both years. Weatherbell.com subscribers and our commercial clients probably got sick of me talking about it, but it’s wild how close the pattern was. There was no “climate change” talk back in 1985. It started a few years later, and in fact, 1985 was at the tail end of the ice age scare. The fact is, the same kind of setup occurred—plenty of warmth over the Arctic, something that has happened from time to time—and we saw it clearly in our August winter forecast.
The threat of a cold winter looms. Plenty of blocking is expected over the Arctic. A prominent Alaskan ridge should lead to plenty of cold air. Another cold period from Thanksgiving to Christmas is on the table. The heart of the winter looks coldest relative to average. (From the August 29, 2025, forecast bullet points.)
It was occurring a lot back in the 70s and 80s. And that was not climate change then.
I love using analogs. They pop into my head when I see something, way in advance. They don’t always work, but when you set something up and you see the dominoes fall, you realize you have an advantage on long-range forecasts that didn’t understand the way this winter was going to average out—by huge swings and extremes. And now the cold is having its day (it’s been in the Northeast all year), and it’s not going to leave overall. Looks like an American Pie February (made me shiver with each forecast I’d deliver).
To hit something like that needs divine intervention. How else would I somehow go to an analog that turned out so close? And think about that. The great lesson of the weather is you learn awe and humility in the face of the creation because you see these examples and they pop into your head. Yet you have people who had no idea this was even on the table—or that there were such strong similarities to the same kind of setups from the past (in this case, 1985 stood out)—now coming on and claiming it’s climate change. Just like I truly believe that some of my better days and my ability to remember things have something to do with the mission God gave me in the weather, I can also recognize the opposite when know-nothings come out and blame something without having any idea that it happened before. Ignorance and arrogance on display every time someone blames climate change for things that happened before and can be used to set up what you see now. If truth is a trait of God, what is outright deception on a matter like this a trait of?
When you hear someone blaming climate change for this—when it has happened before and we showed last month why we had an example that we had to watch for—you know they are coming from a point of deception (they know and just lie) or ignorance. It’s one or the other, but in both cases, it’s not the truth.


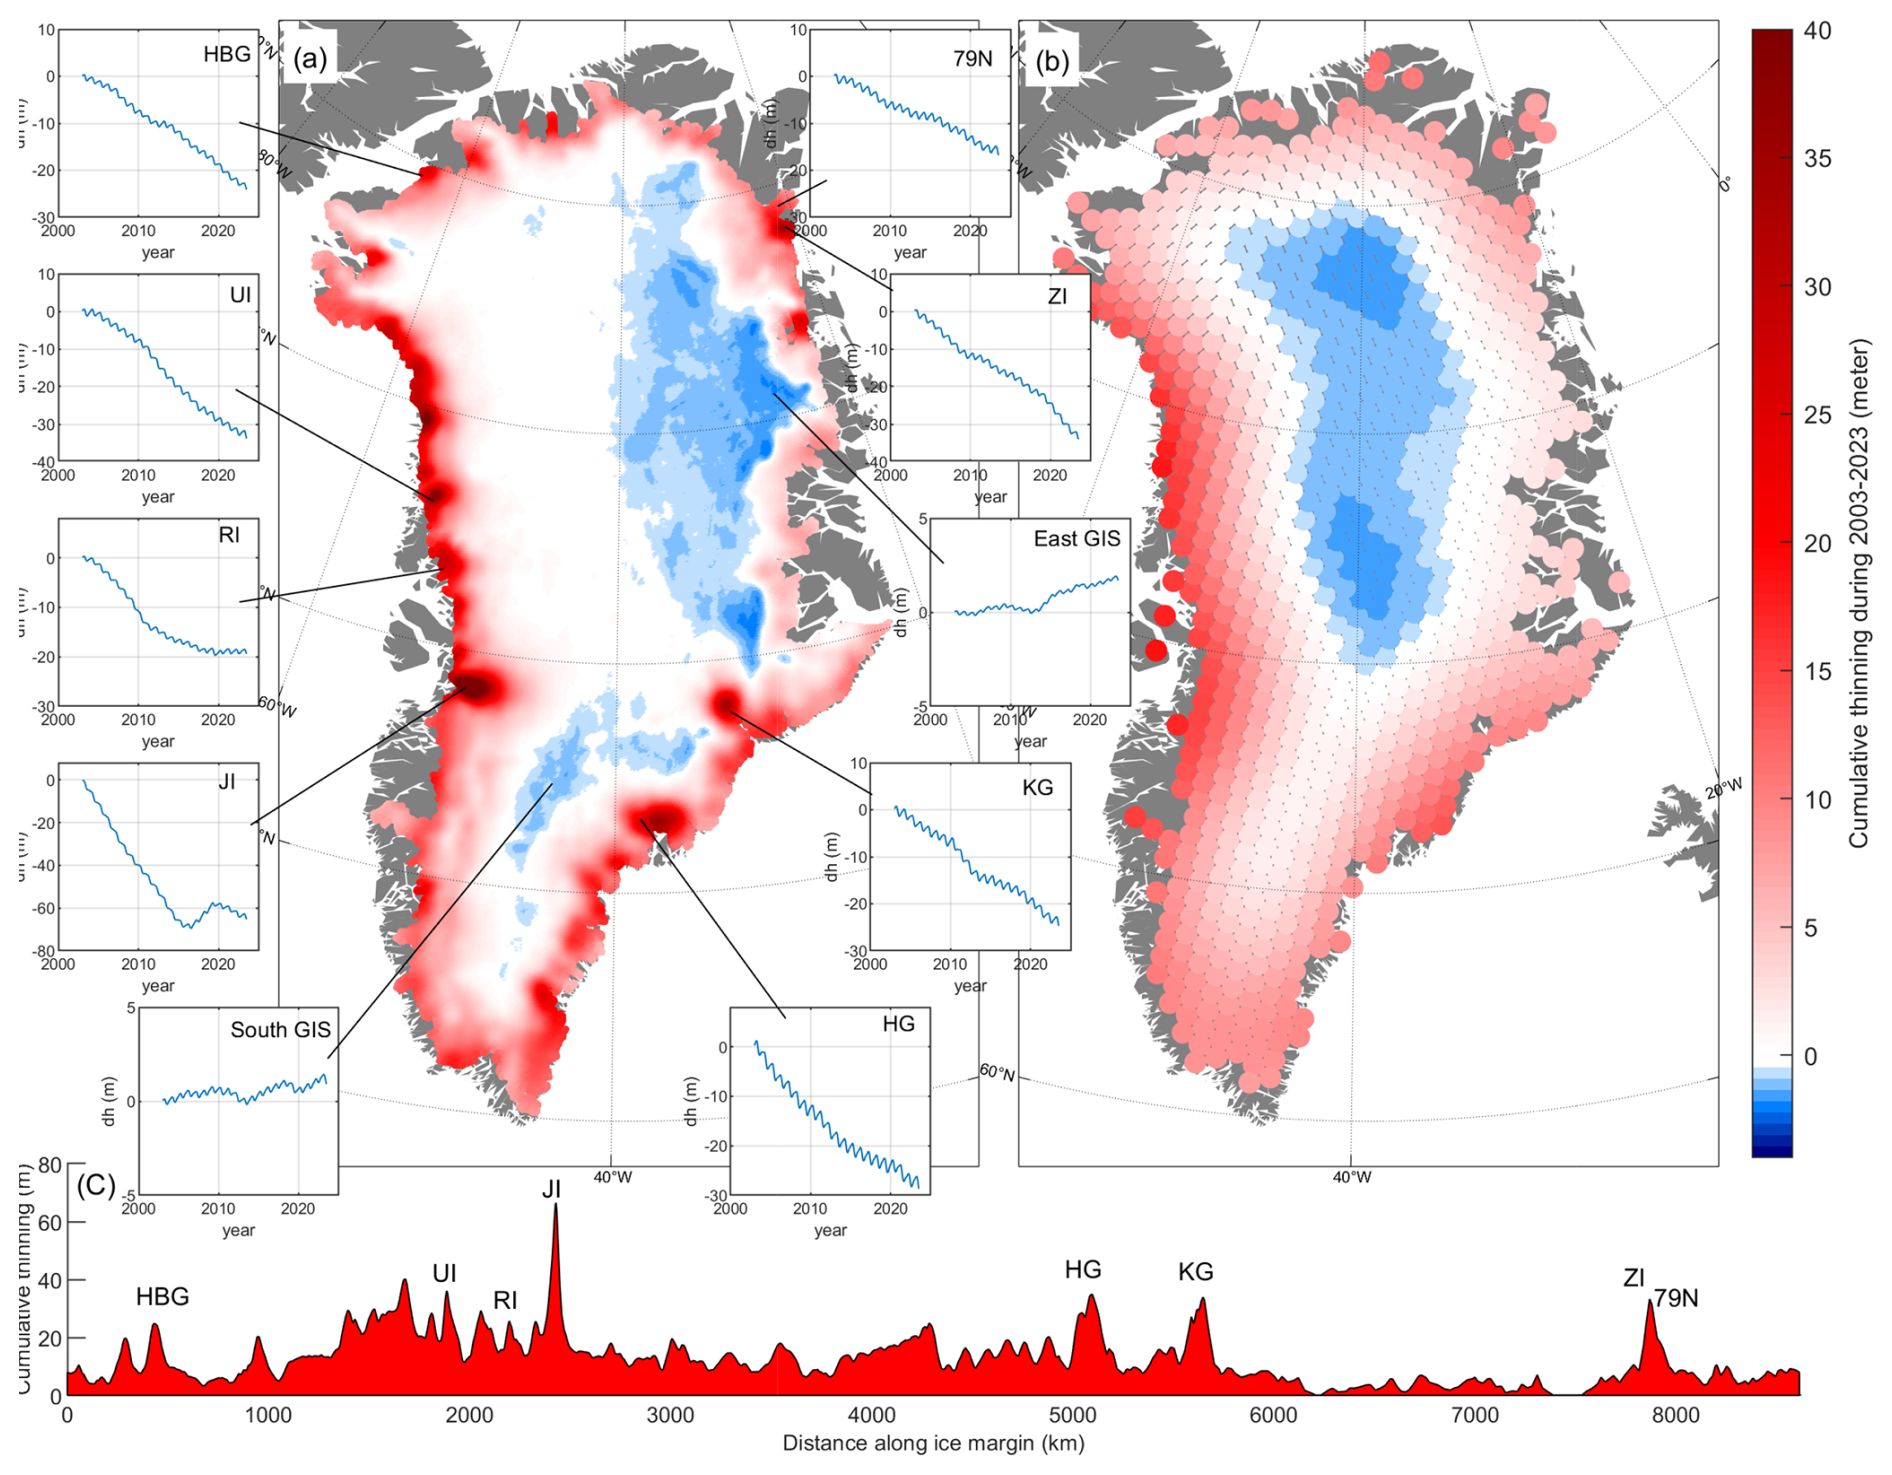
You must be logged in to post a comment.