Ancient Wall in Morocco Rewrites North African History: 5,000-Year-Old Farming Hub Linked to Mediterranean Trade and Climate Resilience

History is being rewritten at an archaeological site in Morocco: Discovery of an ancient wall at Oued Beht.

Oued Beht and climate impacts center on how the siteโ€™s location in northwestern Morocco buffered it against broader North African aridification during the later Holocene, enabling a major Final Neolithic farming complex (c. 3400- 2900 BC) while much of the Sahara and other regions dried out.

A panoramic view of rolling hills and fields at sunset, with a river winding through the landscape and the sea visible in the distance.
AI generated by Grok

History is being rewritten at an archaeological site in Morocco: Discovery of an ancient wall at Oued Beht.

Researchers working at the Oued Beht site in northwestern Morocco have uncovered what they describe as the earliest known large- scale construction of a probably defensive nature in North Africa outside the Nile Valley. The multiphase ditch, rampart, and wall system dates to roughly 4,000- 3,500 years ago (equivalent to the Bronze Age in the western Mediterranean).

The structure cuts across a narrow section of the ridge between the river and a ravine, protecting the southern tip of the site (an รฉperon barrรฉ or barred spur). Earlier notes of earthworks and walls go back to the 1930s, but new 2023 excavations and radiocarbon dating have clarified its age and nature.

Building it required significant planning, coordination, and labor, pointing to more complex and organized societies in the Maghreb than previously assumed. It may relate to competition over land, resources, or control of movement rather than external invaders.

This builds on earlier work at the same site, which revealed a large Final Neolithic agricultural complex (around 5,400- 4,900 years ago), likely the earliest and largest of its kind in Africa outside the Nile Valley. That phase included farming (barley, wheat, livestock), craft production (thousands of polished stone axes, decorated pottery), and activity across at least 10 hectares.

The ridge saw renewed use in the medieval period (11th-13th centuries AD), with the defensive structure rebuilt, a nearby hamlet or farm, and a cemetery.

The discoveries challenge the long-held view that the later prehistory of the Maghreb was poorly understood or relatively isolated. Evidence suggests northwestern African communities were connected to wider Mediterranean networks (including southern Iberia) and participated in processes of social transformation, settlement shifts toward more defensible locations, and possibly more formalized leadership.

The findings come from a 2023 study published in Libyan Studies by researchers including Giulio Lucarini, Cyprian Broodbank, and Toby C. Wilkinson (reposted via The Conversation on phys.org, dated September 15, 2026). Ongoing work at the site continues to fill gaps in North African prehistory.

Bronze Age Maghreb trade involved exchange networks linking northwest Africa (primarily Morocco, with less evidence from Algeria and Tunisia) to the western Mediterranean, especially southern Iberia, from roughly the late 3rd millennium BC through the 2nd- early 1st millennium BC. These connections predate intensive Phoenician activity (from c. 800 BC) and challenge older views of the Maghreb as isolated or sparsely occupied before later historical periods.

Recent excavations at sites such as Oued Beht and Kach Kouch in northwest Morocco have been key to rewriting this picture. Trade appears to have been bidirectional, involving raw materials, finished goods, pottery styles, technologies, and possibly livestock or people, facilitated by the short crossing of the Strait of Gibraltar and coastal/maritime routes.

Key Evidence and Goods

African ivory and ostrich eggshell: A major export from the Maghreb to Iberia. North African elephant ivory use intensified in the Maghreb from around 4000 BC (linked to Saharan population movements and the end of the African Humid Period). Exchange networks with the Iberian Peninsula remained active at least until the end of the Early Bronze Age. Ostrich eggshell also appears in Iberian Copper Age and Bronze Age contexts. These materials indicate Maghreb communities supplied high-value exotic goods that supported social differentiation on both sides.

Pottery and material culture parallels: Painted pottery traditions at Oued Beht (Final Neolithic, c. 3400-2900 BC, with later activity) show similarities to southern Iberian styles. Bell Beaker- related ceramics (including Maritime styles) and other forms appear in Moroccan sites such as Kehf el Baroud. At Kach Kouch, handmade pottery includes forms with clear Iberian resemblances, pointing to shared stylistic and possibly technological exchange.

Metals: Local metallurgy evidence is limited in the Maghreb during much of the Bronze Age. A tin- bronze fragment from Kach Kouch (radiocarbon-dated c. 1110- 920 BC, with ~9.4% tin) is among the earliest known in North Africa west of Egypt; its chemical signature raises the possibility of imported tin (potentially European) or finished metal, as no clear local production infrastructure has been identified at the site. Other metal objects include copper items and later iron. Flat axes resembling Early Argaric (southern Iberian) types further suggest exchange. Iberia itself had copper and tin resources that fed broader Mediterranean networks.

Other indicators: Possible African cattle genetic influence (mtDNA haplotype T1) in Iberian Bronze Age remains supports livestock or population movement. Modeling of least- cost paths for ivory transport highlight a strong southwestern Iberia- Morocco corridor and additional links along Mediterranean North African shores. Defensive architecture at Oued Beht (c. 4,000- 3,500 years ago) and settlement shifts may reflect intensifying competition or control over resources and routes amid these interactions.

Major Sites

Oued Beht (Khรฉmisset Province, Morocco): Large Final Neolithic agricultural complex (c. 3400- 2900 BC; earliest and largest of its kind in Africa outside the Nile Valley) with later Bronze Age activity, including the earliest confirmed large- scale (likely defensive) wall/ditch/rampart system in North Africa outside Egypt. It functioned as a production hub (polished stone axes, pottery) with clear western Mediterranean ties.

Kach Kouch (near Oued Laou, northwest Morocco): Earliest known Bronze Age settlement in the Maghreb (outside Egypt). Occupation phases include sparse early evidence (c. 2200- 2000 BC, contemporary with the Iberian Copper/Bronze transition), a stable farming village (c. 1300- 900 BC) with wattle- and- daub houses, silos, and mixed agriculture/livestock, and a later phase (c. 800- 600 BC) showing local continuity alongside Phoenician- influenced innovations (wheel-thrown pottery, iron, hybrid architecture). Pottery and the early bronze object highlight pre- Phoenician Mediterranean links.

Nature and Scale of Networks

Exchange was likely community-based or small-scale rather than highly centralized long- distance commerce of the later eastern Mediterranean type. The Maghreb participated in processes paralleling those in southern Iberia (e.g., Argaric societies with fortified hilltop settlements, metallurgy, and hierarchies, c. 2200-1550 BC). Connections extended into Atlantic and broader western Mediterranean circuits involving metals, amber, and other goods, though Maghreb evidence remains sparser due to historically limited research.

By the Late Bronze/Early Iron Age transition, networks intensified, setting the stage for Phoenician integration without simple replacement of local communities. Overall, these findings show northwest Africa as an active agent in western Mediterranean dynamics rather than a peripheral zone. Ongoing excavations continue to refine the picture, with many gaps remaining especially outside Morocco.

Neolithic agriculture in the Sahara developed within the context of the African Humid Period (roughly 14,800- 5,500 years ago, or ~12,800- 3,500 BCE), when the region was a โ€œGreen Saharaโ€ of grasslands, savannas, lakes, and rivers supporting diverse flora, fauna, and human populations. Unlike the Near Eastern Neolithic model of sedentary village farming with domesticated cereals and animals, the Saharan pathway emphasized mobile pastoralism combined with intensive gathering and limited cultivation of wild plants, with full plant domestication emerging later and mainly along the southern margins (Sahel).

The Green Sahara enabled early Holocene hunter- gatherer- fisher communities (with pottery appearing by ~8,000- 7,000 BCE in places) to expand widely. A mid- Holocene arid event (~8.2 ka) and progressive drying after ~5,500- 5,000 years ago drove adaptations: increased mobility, reliance on livestock, and eventual southward migrations into the Sahel as the desert expanded. Pastoralism may even have temporarily delayed full desertification in some models by altering vegetation and fire regimes.

Domestic cattle, sheep, and goats appeared by the early to mid- 7th millennium BP (around 6,000- 5,000 BCE or earlier in some eastern/central sites).

  • Early evidence comes from the Tadrart Acacus (Libya; Takarkori and Uan Muhuggiag, ~8,300- 8,000 cal BP), Nabta Playa (Egypt), and other central/eastern sites.
  • Dairying is chemically confirmed by the 5th millennium BCE in the central Sahara (lipid residues on pottery).
  • A distinctive โ€œcattle cultโ€ is visible in rock art, cattle burials/tumuli, and ceremonial sites.

This multi- resource pastoralism (herding plus hunting, fishing, and plant gathering) became the dominant strategy across much of the Sahara by the mid- Holocene, contrasting with Near Eastern sedentary farming. Populations peaked with pastoral expansion before collapsing with aridification.

True domesticated cereal agriculture was not central to most Saharan Neolithic economies. Wild grasses (sorghum, millets such as Pennisetum, Panicum, Echinochloa, Brachiaria, etc.) were intensively gathered and processed (evidenced by abundant grinding stones and pottery).

Key findings include:

Wild cereal use and possible pre- domestication cultivation: At Nabta Playa (Egyptian Western Desert), carbonized wild sorghum and millets date to ~8,000 BP. At Takarkori rockshelter (Acacus, Libya), long sequences show gathering of wild sorghum and millets from the Early Holocene, with morphological changes suggesting cultivation without full domestication over millennia (especially after ~4,800 BCE for some small millets). Hundreds of thousands of wild cereal seeds indicate managed stands selected for โ€œweedinessโ€ traits useful in fluctuating environments.

Domestication of African crops: Pearl millet (Pennisetum glaucum / Cenchrus americanus) shows a western Sahara/Sahel origin, with domestication processes underway by the 5th- 4th millennium BCE in northern Mali/Mauritania areas and fully domesticated forms spreading by the 3rd- 2nd millennium BCE. Sorghum (Sorghum bicolor) domestication evidence appears in eastern Sudan (Butana Group pottery impressions, 4th millennium BCE), with wild exploitation earlier across the Sahara and Sahel. These were suited to mobile pastoralists due to low water needs.

Near Eastern cereals: Emmer wheat and barley (of Southwest Asian origin) appear earlier than previously thought in Nubian/Sudanese Neolithic contexts (~7,000 years ago at sites like R12 and Ghaba cemeteries via phytoliths and dental calculus starch), and in the Fayum/Merimde by ~5,000 BCE, but these are more tied to Nile Valley developments than core Saharan ones.

Near Eastern cereals: Emmer wheat and barley (of Southwest Asian origin) appear earlier than previously thought in Nubian/Sudanese Neolithic contexts (~7,000 years ago at sites like R12 and Ghaba cemeteries via phytoliths and dental calculus starch), and in the Fayum/Merimde by ~5,000 BCE, but these are more tied to Nile Valley developments than core Saharan ones.

Other early plant evidence includes possible early watermelon (Citrullus lanatus) domestication signals in the Acacus (~5,500 BP).

Key Sites

  • Nabta Playa (Egypt): Multi- phase settlements with hearths, dwellings, cattle remain, wild sorghum/millets, pottery, and later megalithic structures (including a possible calendar circle) and cattle cult features. Early herding from ~8,700- 7,800 BCE phases.
  • Tadrart Acacus / Takarkori (Libya): Exceptional organic preservation showing long- term wild cereal management alongside early pastoralism and dairying.
  • Gobero, Adrar Bous, Tรฉnรฉrรฉ (Niger/central Sahara): Burial grounds and pastoral sites reflecting population dynamics and livestock introduction.
  • Southern margins (e.g., Tilemsi Valley, Mali; Tichitt tradition, Mauritania; Gajiganna, Chad Basin): Where domesticated millet agriculture became established as pastoralists moved south with aridification (from ~3rd- 2nd millennium BCE).

Broader Implications and Transition

The Saharan Neolithic represents an independent African trajectory: pottery- using foragers becoming mobile pastoralists who managed wild plants, rather than a direct shift to village farming.

As the Sahara dried (~5,000- 3,000 BCE), groups migrated southward, contributing livestock, knowledge, and eventually cereal farming to Sahelian and sub- Saharan societies. Oasis agriculture (with techniques like foggaras) developed much later (e.g., Garamantian period, ~1st millennium BCE- AD).

Research continues to refine timelines through archaeobotany, lipid analysis, genetics, and modeling, highlighting human resilience and the role of climate in shaping African food production systems.

The Maghrebโ€™s later Neolithic farming complexes (e.g., Oued Beht) partly reflect interactions and population movements linked to these Saharan dynamics.

Oued Beht and climate impacts center on how the siteโ€™s location in northwestern Morocco buffered it against broader North African aridification during the later Holocene, enabling a major Final Neolithic farming complex (c. 3400- 2900 BC) while much of the Sahara and other regions dried out.

Oued Beht sits on a limestone- marl- conglomerate ridge (170- 210 m above sea level) on the Zemmour plateau, overlooking the perennial Oued Beht river (which flows year- round from the Middle Atlas).

The area today is a semi- arid Mediterranean bioclimatic zone, with average annual rainfall around 481 mm near Khรฉmisset (mostly in winter months) and marked inter-annual variability. It is currently used for cereal farming.

The northwest Maghrebโ€™s position, between Atlantic and Mediterranean weather systems and near the Atlas range, provided more reliable moisture than interior North Africa.

This significantly moderated the aridification that intensified across much of northern Africa from the fourth millennium BC onward (linked to the end of the African Humid Period / Green Sahara). As a result, the region remained viable for agriculture when many Saharan and Sahelian areas saw population declines, increased mobility, or abandonment.

Excavations show a farming community with domesticated barley (notably naked barley), wheat, and peas, plus wild olive and pistachio (xerophytic species adapted to drier conditions). Livestock were kept, and there is evidence of plant processing (grinding stones) and storage (numerous deep pits/silos). Wild plant exploitation and a perennial river water source further supported the economy.

Geoarchaeological observations include:

  • Soil profiles with carbonate accumulation and translocation (from evaporation, root activity, and wetting and drying cycles).
  • Pits left open and episodically infilled by natural processes, such as after heavy rains (sharp boundaries, clay coatings, planar voids).
  • Ridge edges prone to rain- induced erosion, with colluvium and evidence of landscape stability alternating with erosion episodes.

These features indicate a climate with seasonal rainfall variability and occasional intense rains, consistent with a Mediterranean regime that supported intensive agriculture without requiring the more extreme adaptations seen farther south or east.

During the main Final Neolithic phase, activity focused on the larger, more open northern part of the ridge. By the early- to- mid second millennium BC (Bronze Age), focus shifted to the narrower, more defensible southern ridge, marked by the construction of a multiphase ditch, rampart, and wall system (the earliest confirmed large- scale defensive architecture of this type in North Africa outside the Nile Valley). This may reflect social changes, resource competition, or responses to environmental and social pressures, though direct climate causation is not established.

Regionally, Moroccan Neolithic sequences show climate influences: arid signals around 6.3 ka cal BP and the 4.2 ka event are linked to shifts in mobility, Saharan population movements toward more favorable rims (including the Maghreb), and changes in settlement patterns. Oued Behtโ€™s success during the Final Neolithic highlights local climatic advantages that allowed continuity and complexity when broader aridification was underway.

Oued Beht, North Africa, and the 4.2-kiloyear event

The 4.2- kiloyear event (also called the 4.2 ka BP event) was a major Holocene climate episode of widespread aridification and cooling that began around 2200 BCE (approximately 4,200 years ago) and lasted roughly a century or more (often spanning the 22nd century BCE).

It is one of the most severe climate disruptions of the Holocene and marks the formal start of the Meghalayan stage. Proxy records (lake sediments, speleothems, pollen, marine cores, and dust fluxes) show intensified drought across much of North Africa, the Middle East, the Red Sea, the Arabian Peninsula, and parts of South Asia, with associated societal stresses.

In North Africa the event is generally recorded as a phase of increased aridity:

  • Reduced monsoon strength and enhanced evaporation.
  • Lower Nile floods in Egypt (around 2150 BCE), which contributed to famine, social disorder, and the collapse of the Old Kingdom.
  • Dry signals in Morocco (e.g., Tigalmamine in the Middle Atlas) and Algeria.
  • Broader evidence of hydrological instability, dust deposition, and vegetation shifts.

The expression was regionally variable.

The expression was regionally variable. Some northwestern sites show cooler/more humid intervals or complex โ€œW-shapedโ€ patterns rather than uniform megadrought, influenced by Saharan dynamics and Mediterranean westerlies.

Overall, the event accelerated the long- term drying trend that followed the end of the African Humid Period.

Oued Behtโ€™s main occupation phases do not coincide directly with the peak of the 4.2 ka event, but the siteโ€™s chronology and regional context are relevant:

Final Neolithic phase (c. 3400โ€“2900 BC / roughly 5,400โ€“4,900 years ago): This is the major farming complex (earliest and largest agricultural site known in Africa outside the Nile Valley). It clearly predates the 4.2 ka event. The northwest Maghrebโ€™s position, between Atlantic and Mediterranean weather systems and near the Atlas Mountains, provided more reliable rainfall and buffered the region against the progressive aridification that affected much of northern Africa from the fourth millennium BC onward. This climatic advantage helped sustain intensive cereal agriculture (barley, wheat, peas) and livestock herding at the site.

Bronze Age phase (defensive wall, ditch, and rampart system dated to roughly 4,000- 3,500 years ago / early-to-mid second millennium BC): This overlaps with or immediately follows the 4.2 ka event. Activity shifted from the open northern ridge to the more defensible southern tip, accompanied by the earliest confirmed large- scale defensive architecture of this type in North Africa outside Egypt. Researchers interpret the constructions as responses to increasing competition over land, resources, or movement corridors rather than external invasion. While publications on Oued Beht do not explicitly attribute the shift to the 4.2 ka event, the timing aligns with broader Mediterranean social transformations (e.g., the rise of fortified Argaric settlements in southern Iberia, c. 2200- 1550 BC) and the climatic stresses of the period.

In short, Oued Beht illustrates resilience in a relatively protected Maghreb microenvironment during the broader aridification of North Africa.

The Final Neolithic farming hub thrived before the 4.2 ka peak, while the later defensive architecture appears during the climatic and social upheavals of the early second millennium BC.

Ongoing research at the site and regional paleoclimate proxies continue to refine these connections.

Claim: The Trump Administration is Shutting Out Climate Refugees

โ€œโ€ฆ thereโ€™s little hope of a new system to help those forced from home by climate impacts โ€ฆโ€

Hurricanes in Honduras are nothing new. I feel sorry for someone getting sick from mosquitoes, but if greens hadnโ€™t worked so hard to ban DDT, mosquitoes would not be a problem.

From Watts Up With That?

Essay by Eric Worrall

โ€œโ€ฆ thereโ€™s little hope of a new system to help those forced from home by climate impacts โ€ฆโ€

โ€˜Every day itโ€™s more barriersโ€™: how the US is shutting out climate refugees

Oliver Milman
Wed 10 Jun 2026 23.00 AEST

As the US shuts its doors to most refugees, thereโ€™s little hope of a new system to help those forced from home by climate impacts

Trump targets migrants from countries hit most by climate shocks

Millions of people around the world are having their lives upended by floods, storms and heatwaves worsened by the climate crisis. Those forced to flee their home countries, however, are finding that the door to the US is more firmly shut than ever.

โ€ฆ

But those who have managed to get to the US through other means after being displaced in this way now find themselves in an even more precarious position following Donald Trumpโ€™s immigration crackdown, with little hope of a new system to help others forced from their homes by climate impacts.

For some, that pathway to the US has been particularly perilous. When Hurricane Mitch crashed into Honduras, killing 7,000 people, one affected family surveyed the unsalvageable ruins of their home and realized they had a lifeline โ€“ to move to the US.

โ€ฆ

โ€œThere were bodies and dead animals floating in the water, the house was messed up, the furniture was all gone โ€“ doors, windows gone. It was so, so sad,โ€ said Evelyn. โ€œI got sick because of the mosquitoes and didnโ€™t have any services to rebuild the house because our country is very poor. My uncle and aunt were just like, โ€˜OK, just bring the kids over here, donโ€™t stay. Itโ€™s dangerous.โ€™โ€

โ€ฆ

โ€œI was invited to come here and be part of this country and now all of a sudden you try to make me go back after establishing a life here?โ€ said a doctor from Sudan, who moved to the US several years ago and did not want to be named. The doctor faces the prospect of deportation under a new Trump administration edict that has blocked all entry to the US from Sudan and dozens of other countries.

โ€ฆ

โ€œIt was always hot, no rain,โ€ said another man, from Somalia and now applying for asylum in the US, about the drought in his own country. Somalia, like Sudan, has been racked by civil war.

โ€ฆ

Some Democratic lawmakers have in recent years attempted to introduce a climate-related visa that would cover people fleeing extreme weather disasters. However, with the political mood swinging strongly against migrants, advocatesโ€™ hopes of reform have dwindled, even as the number of displaced has ballooned.

โ€ฆRead more: https://www.theguardian.com/us-news/2026/jun/10/climate-change-crisis-refugees

None of this is evidence the world faces a climate crisis.

Hurricanes in Honduras are nothing new. I feel sorry for someone getting sick from mosquitoes, but if greens hadnโ€™t worked so hard to ban DDT, mosquitoes would not be a problem.

According to the Lancet, extensive DDT spraying in the 1950s and 1960s in Sri Lanka reduced Malaria cases to just 17 in 1963. Think about that โ€“ from millions of cases down to just 17 cases of Malaria. From spraying one chemical. DDT is ridiculously easy to make, its bucket chemistry โ€“ a two step reaction which requires low cost, easy to obtain chemicals, and a few bags of supermarket ice. Even if Honduras didnโ€™t want to use it all the time, they could keep a few tons handy for emergencies, if the world wasnโ€™t so paranoid about DDT.

As for Somalia, that place has been locked in a civil war since the dictator Mohamed Siad Barre was overthrown in 1991. But just down the road, a breakaway province of Somalia called Somaliland, which most of the world for some obscure reason refuses to recognise, has created an island of relative stability.

From what Iโ€™ve pieced together from watching documentaries, Somaliland formed when a bunch of warlords agreed to stop killing each other and started encouraging commerce and tourism. Obviously there must be more to it than this, but nobody is talking. They have the best balanced national budget in the world, because nobody will lend them money, since they are not an officially recognised nation. I watched an interview once with the finance minister, he said โ€œif another minister sends me a request for money, and we donโ€™t have the money, I just send it backโ€.

Donโ€™t get me wrong, Iโ€™m not about to book a holiday ticket to Somaliland. Itโ€™s still a pretty dangerous part of the world, Al Shabaab and other cruel militant groups have a presence there. The government requires visitors to hire an armed escort if they want to venture outside of big cities. But compared to what is happening elsewhere in Somalia, Somaliland is a tranquil oasis โ€“ and if walking on the wild side is your thing, the Somaliland government is doing everything in their power to attract a rising number of tourists and entrepreneurs.

Why isnโ€™t the climate change which is messing up Somalia also messing up Somaliland? Maybe because Somaliaโ€™s problems are not caused by climate change? Maybe the insanity which is messing up Somalia is because of surging addiction to khat, a meth like stimulant which causes paranoia and mental illness, unpredictable mood swings and uncontrolled violence in heavy users. But pinning Somaliaโ€™s problems on climate change fits the alarmist narrative better than the likelihood that Somaliaโ€™s problems stem from an out of control substance abuse crisis. Interestingly Somaliland also has high rates of khat usage, but somehow manages to keep the social problems mostly under control. Perhaps this is the difference between good governance and an absence of governance.

That doctor from Sudan, I understand why nobody would want to be sent back to Sudan. Sudan has been a horror show for decades. When a group of student protestors in 2019 demanded better governance and an end to violence, the drug crazed lunatics in uniform deployed by what passes for Sudanโ€™s government gang raped the young women. I would not want to be forced to travel to a place where such wicked things happen. But again, this has nothing to do with climate change. Khartoum where this atrocity happened is at a similar latitude and has a similar climate to parts of Somaliland.

I donโ€™t know why greens are so obsessed by allowing mass migration of climate refugees. Perhaps they are just so desperate to believe in the fake climate crisis, they need to see climate refugees, even if there are no climate refugees.

Arctic Ice Recovering 2025ย Yearend

Sea ice extent is the total area of ocean covered by at least 15% sea ice, measured daily via satellite passive microwave sensors (e.g., NSIDC Sea Ice Index). It differs from sea ice area (which accounts for actual ice concentration) or volume/thickness. Extent is a key climate indicator because it reflects seasonal freeze/melt cycles and long-term changes driven by warming.

Aerial view of an orange and blue ship surrounded by extensive sea ice in a bright, sunlit Arctic landscape.

Sea ice extent is the total area of ocean covered by at least 15% sea ice, measured daily via satellite passive microwave sensors (e.g., NSIDC Sea Ice Index). It differs from sea ice area (which accounts for actual ice concentration) or volume/thickness. Extent is a key climate indicator because it reflects seasonal freeze/melt cycles and long-term changes driven by warming.

Seasonal cycle: Arctic sea ice grows in winter (maximum typically in March) and melts in summer (minimum in September).

Units: Million square kilometers (kmยฒ).

A map of the Arctic region displaying major geographic features including the Arctic Ocean, Canadian Archipelago, Greenland, and surrounding seas like Beaufort Sea and Chukchi Sea, with labeled areas of sea ice.
Maps | National Snow and Ice Data Center

From Science Matters

Byย Ron Clutz

A playful illustration featuring four cartoon polar bears celebrating the year 2025, with the bears wearing colored crowns and holding party noisemakers against a light blue background.

The Arctic ice extents are now fully reported for 2025, ending the year below average despite a higher rate of growth through December.

Line graph showing Arctic ice extents for December, comparing data from 2025, 2024, and 19-year averages, with axis labels for days and ice extents in million square kilometers.

Note MASIE 2025 started 1M km2 (or 1 Wadham) below the 19 year average, but cut the deficit to 428k km2, or a gap of 3%. SII v.4 tracked lower than MASIE during December, drawing closer the last week. The chart below shows the distribution of ice extent across the Arctic regions at yearend 2025.

Region2025365Day 365 Average2025-Ave.20243652025-2024
 (0) Northern_Hemisphere1261167613039302-42762612435177176499
 (1) Beaufort_Sea10710701070458612107100169
 (2) Chukchi_Sea966006964771123596598917
 (3) East_Siberian_Sea10871371087133410871370
 (4) Laptev_Sea89784589784148978450
 (5) Kara_Sea867623887208-19585876527-8904
 (6) Barents_Sea254882423978-169096345715-90832
 (7) Greenland_Sea6685505956587289157453794013
 (8) Baffin_Bay_Gulf_of_St._Lawrence768306982649-214343982716-214409
 (9) Canadian_Archipelago854931853618131385487853
 (10) Hudson_Bay1256284121569540589922416333868
 (11) Central_Arctic31743543206560-322063207164.49-32811
 (12) Bering_Sea350519403002-52483325489.9325029
 (13) Baltic_Sea1403131873-1784315271.77-1241
 (14) Sea_of_Okhotsk366812393742-2692930294163871

The major deficits are in Barents Sea and Baffin Bay (Atlantic basins), along with smaller losses in Bering and Okhotsk (Pacific basins).

A detailed map of the Arctic region highlighting various basins and seas, including the Canada Basin, Greenland Basin, and Barents Sea, with labeled geographic features.

Some years ago reading a thread on global warming at WUWT, I was struck by one personโ€™s comment: โ€œIโ€™m an actuary with limited knowledge of climate metrics, but it seems to meย if you want to understand temperature changes, you should analyze the changes, not the temperatures.โ€ That rang bells for me, and I applied that insight in a series of Temperature Trend Analysis studies of surface station temperature records. Those posts are available under this heading.ย Climate Compilation Part I Temperatures

This post seeks to understand Arctic Sea Ice fluctuations using a similar approach: Focusing on the rates of extent changes rather than the usual study of the ice extents themselves. Fortunately, Sea Ice Index (SII) from NOAA provides a suitable dataset for this project. As many know, SII relies on satellite passive microwave sensors to produce charts of Arctic Ice extents with complete coverages going back to 1989.  Version 3 was more closely aligned than Version 4 with MASIE, the modern form of Naval ice charting in support of Arctic navigation. The SII User Guide is here.

There are statistical analyses available, and the one of interest (table below) is called Sea Ice Index Rates of Change (here). As indicated by the title, this spreadsheet consists not of monthly extents, but changes of extents from the previous month. Specifically, a monthly value is calculated by subtracting the average of the last five days of the previous month from this monthโ€™s average of final five days. So the value presents the amount of ice gained or lost during the present month.

These monthly rates of change have been compiled into a baseline for the period 1980 to 2010, which shows the fluctuations of Arctic ice extents over the course of a calendar year. Below is a graph of those averages of monthly changes up to and including this year. Those familiar with Arctic Ice studies will not be surprised at the sine wave form. December end is a relatively neutral point in the cycle, midway between the September Minimum and March Maximum.

Graph illustrating the monthly Arctic ice change rates from 1980 to 2025, showing average extent change in million square kilometers throughout the year.

The graph makes evident the six spring/summer months of melting and the six autumn/winter months of freezing.  Note that June-August produce the bulk of losses, while October-December show the bulk of gains. Also the peak and valley months of March and September show very little change in extent from beginning to end.

The table of monthly data reveals the variability of ice extents over the last 4 decades, with gains in blue cells and losses in red cells.

Table showing Arctic sea ice extent changes from 1978 to 2025, highlighting monthly gains and losses with color coding for better visibility.

The values in January show changes from the end of the previous December, andย by summing twelve consecutive months we can calculate an annual rate of change for the years 1980 to 2025.

Graph showing annual Arctic ice changes in million square kilometers from 1990 to 2025, with a fluctuating line representing annual extent changes.

As many know, there has been a decline of Arctic ice extent over these 40 years, averaging 70k km2 per year. But year over year, the changes shift constantly between gains and losses, ranging up to +/- 500k km2, (2024 being exceptional). Since 1989 the average yearend gain/loss is nearly zero, -0.049k km2 to be exact.

Moreover, it seems random as to which months are determinative for a given year. For example, much ado was printed about 2023 losing more ice than usual June through September. But then the final 3 months of 2023 more than made up for those summer losses, resulting in a sizeable gain for the year.

As it happens in this dataset, October has the highest rate of adding ice. The table below shows the variety of monthly rates in the record as anomalies from the 1980-2010 baseline. In this exhibit a red cell is a negative anomaly (less than baseline for that month) and blue is positive (higher than baseline).

A table showing monthly anomalies of Arctic ice extent from 1979 to 2025, with gains highlighted in blue and losses in red.

Note that the  +/ โ€“  rate anomalies are distributed all across the grid, sequences of different months in different years, with gains and losses offsetting one another.  As noted earlier,  in 2023 the outlier negative months were June through September where unusual amounts of ice were lost.  Then unusally strong gains in October to December resulted in a large annual gain, compared to the baseline. The bottom line presents the average anomalies for each month over the period 1979-2025.  Note the rates of gains and losses mostly offset, and the average of all months in the bottom right cell is virtually zero.

A final observation: The graph below shows the Yearend Arctic Ice Extents for the last 35 years.

Graph showing yearend sea ice extent in million square kilometers from 1989 to 2025, illustrating a decreasing trend over time.
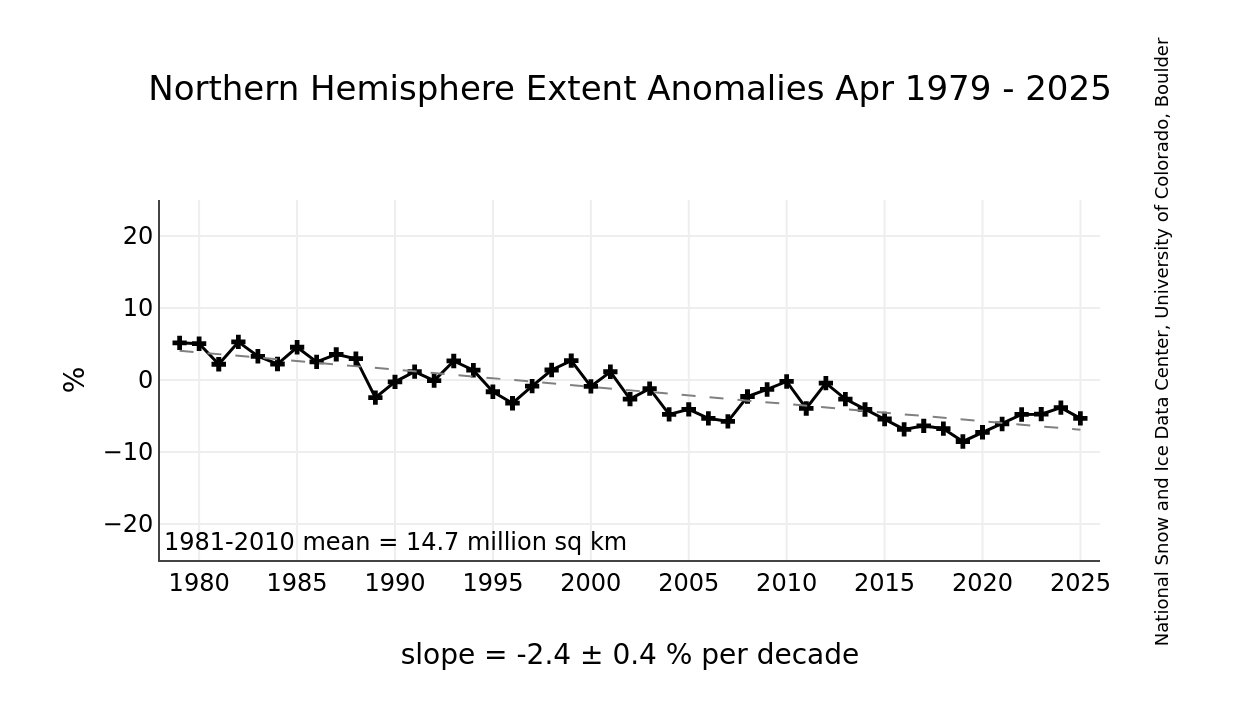
Graph illustrating the Northern Hemisphere sea ice extent anomalies from December 1978 to 2025, showing a decline in percentage over the decades.
Sea Ice Index Daily and Monthly Image Viewer | National Snow and Ice Data Center

Year-end Arctic ice extents (last 5 days of December) show three distinct regimes: 1989-1998, 1998-2010, 2010-2025. The average year-end extent 1989-2010 is 13.4M km2. In the last decade, 2011 was 13.0M km2, and six years later, 2017 was 12.3M km2. 2021 rose back to 13.0  2024 slipped back to 12.2M, and 2025 is back up to 12.4M. So for all the the fluctuations, the net is virually zero, or a loss of one tenth of a Wadham (0.1M) from 2010. Talk of an Arctic ice death spiral is fanciful.

These data show a noisy, highly variable natural phenomenon. Clearly, unpredictable factors are in play, principally water structure and circulation, atmospheric circulation regimes, and also incursions and storms. And in the longer view, todayโ€™s extents are not unusual.

Graph showing the reconstructed Arctic sea ice extent from 1900 to 2013, with marked trends and annotations.
The graph shows a reconstruction of September Arctic sea ice extent (the summer minimum) from ~1900 to ~2013, based on work by Alekseev et al. (2016), as presented in Connolly et al. (2017).

It uses red bars for year-to-year values (reconstructed pre-1979, satellite-observed post-1979).

A blue trend line is overlaid.

The annotation points to a low point around the 1930sโ€“1940s and accuses “alarmists” of starting trends from ~1979 (satellite era) while “ignoring” earlier lows.

There was a significant dip in sea ice during the Early Twentieth Century Warming (ETCW, ~1920sโ€“1940s), with extent roughly comparable to (or only slightly higher than) recent lows. This suggests natural variability played a big role, and modern decline isn’t unprecedented.

The method relies on a statistical relationship between summer Arctic surface air temperatures (from weather stations) and satellite-era sea ice extent. They essentially used temperature data as a proxy to “back-calculate” ice extent before direct observations.

This reconstruction is not mainstream.

A cartoon depicting a polar bear next to an out-of-order ice machine, saying, 'Oh, look... the ice maker's workin!' A person in winter clothing holds a sign that reads, 'The Earth has a fever.'

2024 Arctic Ice Beats 2007 by Half aย Wadham

Why is this important?ย  All the claims of global climate emergency depend on dangerously higher temperatures, lower sea ice, and rising sea levels.ย  The lack of additional warming prior to 2023 El Nino is documented in a postย UAH June 2024: Oceans Lead Cool Down.

From Science Matters

Byย Ron Clutz

The graph above shows September daily ice extents for 2024 compared to 18 year averages, and some years of note. Day 260 has been the lowest daily ice extent on average for the last 18 years.

The black line shows on average Arctic ice extents during September decline 358k km2 down to 4.5M Km2 by day 260. The average increase from now on is 490k km2 up to 5.0M km2 end of September.  2024  tracked a little lower than the 18-year average in the second week reaching a low of 4.49M km2 on day 255, before going above average on day 260. 

SII was reporting deficits as high as 0.5M km2 (half a Wadham) compared to  MASIE early in September.  For some reason, that dataset has not been updated for the last five days.  2023 bottomed out at 4.1M while 2007 daily minimum hit 4.0M, ended ~ 0.5M km2 in deficit to average and 535k km2 less than MASIE on day 260.  2020 ice on day 260 was ~740k km2 in deficit to average.

Why is this important?  All the claims of global climate emergency depend on dangerously higher temperatures, lower sea ice, and rising sea levels.  The lack of additional warming prior to 2023 El Nino is documented in a post UAH June 2024: Oceans Lead Cool Down.

The lack of acceleration in sea levels along coastlines has been discussed also.  See Observed vs. Imagined Sea Levels 2023 Update.

Also, a longer term perspective is informative:

The table below shows the distribution of Sea Ice on day 260 across the Arctic Regions, on average, this year and 2007. At this point in the year, Bering and Okhotsk seas are open water and thus dropped from the table.

Region2024260Day 260 ave2024-Ave.20072602024-2007
 (0) Northern_Hemisphere45813274524401569264045776535551
 (1) Beaufort_Sea304967491931-186963481384-176416
 (2) Chukchi_Sea36045616736119309522527337929
 (3) East_Siberian_Sea353456252958100498311353145
 (4) Laptev_Sea16079213557425218235869-75076
 (5) Kara_Sea031612-3161244067-44067
 (6) Barents_Sea014610-146107420-7420
 (7) Greenland_Sea165965191196-25230333181-167216
 (8) Baffin_Bay_Gulf_of_St._Lawrence5312629745233812670326423
 (9) Canadian_Archipelago228869274428-455592255263344
 (10) Hudson_Bay16924595-29032270-578
 (11) Central_Arctic29508612929452214092665243.87285617

The overall surplus to average is 57k km2, (1.3%).  The major deficit is in Beaufort, offset by large surpluses in Chukchi and East Siberian seas. 

Illustration by Eleanor Lutz shows Earthโ€™s seasonal climate changes. If played in full screen, the four corners present views from top, bottom and sides. It is a visual representation of scientific datasets measuring ice and snow extents.

Supreme Court to decide whether climate studies will be required for Infrastructure projects

The U.S. Supreme Court June 24 agreed to take up a case that may ultimately determine whether critical infrastructure projects โ€“ from transportation to transmission of energy โ€“ will require climate impact analyses before that can go forward.

Plans by a public-private partnership to construct an 88-mile-long rail line in eastern Utah connecting oil producers in the area to a nationwide rail network were put on hold, when the D.C. Circuit Court of Appeals, siding with environmental activists, ruled that local officials had not given the projectโ€™s climate impacts adequate consideration, and that more studies were needed.

From CFACT

By Bonner Cohen, Ph. D.

The U.S. Supreme Court June 24 agreed to take up a case that may ultimately determine whether critical infrastructure projects โ€“ from transportation to transmission of energy โ€“ will require climate impact analyses before that can go forward.

Plans by a public-private partnership to construct an 88-mile-long rail line in eastern Utah connecting oil producers in the area to a nationwide rail network were put on hold, when the D.C. Circuit Court of Appeals, siding with environmental activists, ruled that local officials had not given the projectโ€™s climate impacts adequate consideration, and that more studies were needed.

Upon completion, the Uinta Basin Railway would enable an additional 350,000 barrels of oil a day to be shipped to markets nationwide, including all the way to refineries near the Gulf of Mexico. Currently, the oil produced in rural Utah is carried on tanker trucks, a far more expensive and less energy-efficient way of bringing the product to market.

But the proposed rail line hit a roadblock last year, when the D.C. Circuit Court ruled that the Surface Transportation Boardโ€™s environmental approval of the project was rushed and violated federal law. The court said the board should have studied the impact of the drilling and transporting more oil along the entire route, stretching thousands of miles to the Gulf Coast. https://apnews.com/article/supreme-court-utah-uinta-basin-railway-oil-d6dfb030e7176d8bfed30906ad839981

Recognizing the threat such an expansive view of the Surface Transportation Boardโ€™s authority poses to their rail line and other infrastructure projects, the developers, investment firm DHIP Group and the Seven County Infrastructure Coalition, a body of eastern Utah officials, petitioned the Supreme Court to intervene.

โ€œDe-facto Environmental Policy Czarโ€

โ€œBy requiring an agency to consider any environmental effect that it has the power to prevent, no matter the limits of its regulatory authority, the D.C. Circuit rule turns each agency into a โ€˜de-facto environmental-policy czar,โ€™โ€ the coalition argued in its petition. https://www.supremecourt.gov/docket/docketfiles/html/public/23-975.html

Environmental groups, along with Colorado Sen. Michael Bennett (D) are vehemently opposed to the project, citing the rail lineโ€™s effect on climate change and the possibility of a spill in the Colorado River.

โ€œItโ€™s disappointing the Supreme Court took up this case but the appellate court decision on this destructive project is sound and should ultimately stand,โ€ Wendy Park, a senior attorney at the Center for Biological Diversity, said in a statement.

It takes four justices for the Supreme Court to agree to hear a case, and getting that number is seen as a good sign by the rail lineโ€™s backers. But before the high court hands down a ruling, it will likely have to revisit a 2004 case, Department of Transportation v. Public Citizen. That ruling said that, under the National Environmental Policy Act (NEPA), an agency need not assess an environmental impact if it lies outside the agencyโ€™s jurisdiction. In the 20 years since the opinion was handed down, some federal courts have adhered to a narrow interpretation of the ruling, limiting environmental reviews to areas where an agency has congressionally defined regulatory authority. Other courts, such as the D.C. Circuit Court, have taken a more expansive view of an agencyโ€™s authority.

Keith Heaton, director of the Seven County Infrastructure Coalition, says the Supreme Court needs to provide better guidance when it comes to this key provision of NEPA. โ€œWhat the Washington court ruled was that we needed to look more at upstream and downstream environmental impacts but the D.C. Circuit Court didnโ€™t define what that meansโ€ฆThereโ€™s nothing to prevent anyone anywhere from coming back after we do more work to say you didnโ€™t do this in this place,โ€ he told BASINNOW.com. https://www.basinnow.com/scic-director-supreme-court-to-hear-uinta-basin-railway-case/

Another Opportunity to Rein in the Administrative State

Crippling the infrastructure needed for the extraction and transport of fossil fuels is a key component of the transition to green energy. Now that the Supreme Court has agreed to take up the case of the Utah rail line, the opportunity presented to climate activists by NEPA may be cut off. In recent decisions โ€“ West Virginia v. EPA, Sackett v. EPA, and Loper Bright Enterprises v. Raimondo (overturning of Chevron deference) โ€“ the court has curtailed federal agenciesโ€™ power to regulate beyond what Congress specifically authorized. This bodes well not only for the Utah rail line, but also for other construction projects around the country threatened by being tied up in knots by agencies overstepping their authority.

The case will be heard this fall, with a ruling expected to be handed down in June 2025.

Antarctic Sea Ice Varies, Itโ€™sย Complicated

Sea ice around Antarctica is affected by a host of complex factors,
including shifts in ocean currents and sea and air temperatures.

From Science Matters

Byย Ron Clutz

Antarctic sea ice concentration on June 27, 2023, with white representing solid ice and dark blue representing open ocean. The median ice edge for 1981โ€“2010 is drawn in orange. (Credit: Map by NOAA Climate.gov, based on data from the National Snow and Ice Data Center)

One of the more measured current reports of Antarctic sea ice is at Discoverย Antarctic Sea Ice Reaches a โ€œRecord-Smashing Lowโ€.ย  Excerpts in italics with my bolds.

The sea ice extent is nearly a million square miles
below the long-term average for late June.

Some scientists believe that what weโ€™veย seen since 2022 may beย signaling a significant and potentiallyย long-lasting change.ย Asย Ted Maksym, a climate scientist andย polar oceanographer at the Woods Holeย Oceanographic Institution, put it in a recent story in Wired:

โ€œNow thereโ€™s this question about: Have we got intoย a regime shift? A few of usย are sort ofย speculatingย that that may be true, where the variability in Antarctic sea ice has changed and weย might see these low sea ice extents for some time.โ€

But Maksym also says he and his colleagues are โ€œwatchingย with bated breathโ€ย to see if things will return to normal โ€” and they could. Scientists just donโ€™t know.

Thatโ€™s because theย Antarctic is a very different environment than the Arcticย โ€” in a way thatย complicates drawing firm conclusions. The latter consists of an ocean surrounded by land, whereas the former is a giant landmass surrounded by oceans.

Sea ice around Antarctica is affected by a host of complex factors,
including shifts in ocean currents and sea and air temperatures.
Given how remote, forbidding and large Antarctica is,ย observationsย of these factors have been relativelyย sparse. Moreover, the record ofย satellite observations of sea ice dates only to 1979,ย making it difficult to separate out a human-caused signal from natural variability. And the sparseness of data, and the complexity of myriad factors, have made modeling of Antarctic sea ice very challenging.

Bottom line: Scientists havenโ€™t seen anything like whatโ€™s been happening to Antarctic sea ice inย the past two years. But it willย take time to know whether a dramatic shift truly has occurred,ย and more research to tease out the role of anthropogenic climate change in whatโ€™s happening.

Background Annual Cycle of Antarctic Sea Ice

Firstly, the annual minimum average is ~2.5 M km2 vs. an average maximum of ~17.5 M km2.ย  So the sea ice extent each year nearly disappears.ย  Secondly, since 2010, some years were well above the 1981-2010 average, and obviously there were likely many prior years below average.ย  Which suggestsย this may be a return to the mean, or not,ย as the experts say.

Previously, Antarctic Sea Ice Grew Steadily

Robot Sub Finds Surprisingly Thick Antarctic Sea Ice Nov. 24, 2014

Antarcticaโ€™s ice paradoxย has yet another puzzling layer.ย Not only is the amount of sea ice increasing each year,ย but an underwater robot now shows the ice isย also much thickerย than was previously thought, a new study reports.

The discovery adds to the ongoing mystery of Antarcticaโ€™s expanding sea ice.ย According to climate models, the regionโ€™s sea ice should be shrinking each year because of global warming.ย Instead, satellite observations show the ice is expanding, and the continentโ€™sย sea ice has set new records for the past three winters.ย At the same time, Antarcticaโ€™s ice sheet (the glacial ice on land) is melting and retreating.

Measuring sea ice thickness is a crucial stepย in understanding whatโ€™s driving the growth of sea ice, said study co-authorย Ted Maksym, an oceanographer at the Woods Hole Oceanographic Institution in Massachusetts. Climate scientists need to know if the sea ice expansion also includes underwater thickening.

โ€œIf we donโ€™t know how much ice is there is, we canโ€™t validate the models we use to understand the global climate,โ€ Maksym told Live Science.ย โ€œIt looks like there are significant areas of thick ice that are probably not accounted for.โ€

The Antarctic sunlight illuminates the surface of the sea ice, intensifying the effect of the fracture lines, Oct. 2003. (NSIDC, University of Colorado)

Theory:  Climate Change Increases Antarctic Sea Ice Extent

From AP Oct. 10, 2012ย Increase in Antarctic ice may be sign of climate change.ย  Excerpts in italics with my bolds.

While the Arctic is open ocean encircled by land,ย the Antarcticย โ€” about 1.5 times the size of the U.S. โ€”ย is land circled by ocean, leaving more room for sea ice to spread.ย That geography makes a dramatic difference in the two polar climates.

The Arctic ice responds more directly to warmth.ย In the Antarctic, the main driver is wind,ย Maksym and other scientists say. Changes in the strength and motion of winds areย now pushing the ice farther north, extending its reach.

Those changes in wind areย tied in a complicated way to climate change from greenhouse gases,ย Maksym and Scambos say. Climate change has created essentially a wall of wind that keeps cool weather bottled up in Antarctica, NASAโ€™s Abdalati says.

And the wind worksย in combination with the ozone hole,ย the huge gap in Earthโ€™s protective ozone layer that usually appears over the South Pole. Itโ€™s bigger than North America.

Itโ€™sย caused by man-made pollutants chlorine and bromine,ย which are different from the fossil fuel emissions that cause global warming. The hole makes Antarctica even cooler this time of year because theย ozone layer usually absorbs solar radiation, working like a blanket to keep the Earth warm.

And that cooling effect makes the winds near the ground stronger and steadier,
pushing the ice outward, Scambos says.

University of Colorado researcher Katherine Leonard, who is on board the ship with Maksym, says in an email that the Antarctic sea ice isย also getting snowier because climate change has allowed the air to carry more moisture.

Does Sea Ice Growth or Decline Negate or Confirm Climate Change?  No.

From LA Times August 29, 2014 Does Antarctic sea ice growth negate climate change? Scientists say no.  Excerpts in italics with my bolds.

This year,ย Antarctic sea ice has expanded its frigid reach with unprecedented speed,ย setting records in June and July. By the time spring punctures the long Antarctic night, 2014 stands a decent chance of topping 2012 and 2013, which each broke records of maximum total ice extent.

In fact, since scientists started makingย satellite observationsย in the late 1970s, they have watchedย winter sea ice around Antarctica swell slowly but indisputably, despite predictions that it should shrink.

This poses a puzzle that climate scientists struggle to explain:
How can sea ice grow in a warming world?

Climate skeptics have pounced on this apparent discrepancy, citing it as proof that climate change isnโ€™t real, or at least that scientists donโ€™t completely understand it. Butย those who study Antarctic sea ice say their curious observations shouldnโ€™t shake anyoneโ€™s confidence. Dramatic changes in temperature, sea level and extreme weather around the world areย proof enough the planet is warming,ย they say; the only question is how these changes affect the Antarctic as they ripple through the climate system.

โ€œClimate is a complicated thing,โ€ said Ted Maksym,ย an oceanographer at the Woods Hole Oceanographic Institute in Massachusetts.ย โ€œUnderstanding how these kinds of changes play out in different regions is tricky business.โ€

The westerly winds blow fierce and constant around Antarctica,ย isolating the continent in a kind of permanent polar vortex. Scientists think they exert the most direct control over the state of Antarctic sea ice.

Ice requires cold temperatures to form, andย winds help it growย by blowing it around the polar ocean. When the ice moves, new water is exposed to the chilly air, creating an opportunity to make more ice.

But itโ€™sย notย quiteย as simple as more wind, more ice.

โ€œIt makes no sense to talk about a circumpolar average,โ€ Stammerjohn said. โ€œThereโ€™s so much regional variability.โ€

Theย Ross Sea,ย which faces New Zealand, has seen a dramatic increase in peak ice extent and 80 more days of ice cover since 1979, when satellites began tracking changes. But along the Antarctic Peninsula, which stretches toward the tip of South America, the ice-covered season in theย Bellingshausen Seaย is three months shorter than it was 35 years ago.

Scientists say sea ice and continental ice areย probably responding to the same forces โ€” namely, changes in ocean circulation and winds.ย However, they also influence each other.ย Sea ice helps bufferย ice shelves, the floating tongues of glacial ice that dam the ice sheets and keep them from spilling irreversibly into the sea. Itย also keeps warm ocean waters trappedย beneath a frozen lid, insulating the ice sheet from their destructive heat.

In the long run, however, scientists expect Antarctic sea ice to decline everywhere.
That it hasnโ€™t done so yet suggests thereโ€™s still much to learn about the region.

Antarctic Sea Ice Grows to All-Time Record High: NSIDC October 09, 2014

Claim: Climate Impacts Could Lead to More Authoritarian Governments

Climate alarmists would love us to accept their assertion that climate change is driving migration. But given the failure of hot nations like Singapore to depopulate, in my opinion their claims are less than convincing.

From Watts Up With That?

Essay by Eric Worrall

Russian Population Density Map. By Kartoshka1994 – Own work, CC BY-SA 3.0,ย link

According to climate researcher Joel Millward-Hopkins, Trump, Putin and Bolsonaroโ€™s rise to power was helped by Global Warming.

Why the impacts of climate change may make us less likely to reduce emissions

Published: June 30, 2023 8.51pm AEST
Joel Millward-Hopkins
Postdoctoral Researcher in Sustainability, University of Leeds

The wildfires raging across Canadaโ€™s south-eastern province of Quebec are unprecedented. A warm, dry spring allowed the tinder to accumulate and lightning storms in early June lit the match, dramatically escalating 2023โ€™s fire season.

โ€ฆ

One might hope, at least, that as these increasingly acute effects of climate change are felt by wealthy, high-emitting countries, people will be persuaded to act with the conviction necessary to avert the climate crisis, which threatens the lives of millions and the livelihoods of billions.

However, as I argued in a recent paper, the hope underlying this assumption could be misplaced. As the effects of warming are felt more substantially, we may instead vote into power people committed to making the problem worse. 

โ€ฆ

Right-wing politicians have successfully exploited the narrative around these issues which climate change is inflaming: immigration, economic inequality and global insecurity. Their promises to reverse falling living standards for a selection of the public, relieve stress on (underfunded) public services and protect the nation from external threats invariably involve appeals to close borders and scapegoat migrants. 

These leaders are also anti-environmentalist. Donald Trump, Vladimir Putin and Jair Bolsanaro have fetishised traditional industries such as coal mining, abandoned global challenges in favour of national pursuits and are openly sceptical of, or outright deny, human influence on the climate.

โ€ฆ

The absence of a global consciousness and a willingness to cooperate, which is inherent to this politics, would make maintaining a safe climate almost impossible.

โ€ฆRead more: https://theconversation.com/why-the-impacts-of-climate-change-may-make-us-less-likely-to-reduce-emissions-207385

There is zero evidence people are migrating because of global warming.

Affluent hot countries like Singapore, Brunei and the United Arab Emirates have some of the most difficult citizenship procedures on the planet, because so many people want to live there permanently. They accept guest workers in droves, people who are eager to make some money, but you really need to get in with the right people, or invest a lot of money, to have any hope of settling in such places permanently.

Brazil has a problem with skilled emigration, but that mostly kicked off after they elected a communist President. Nobody with other options wants to be trapped in the next Venezuela.

What about climate damage in cold countries? Like Canadians, most Russians live in a thin strip near the Southern Border. Russia has a serious problem with depopulation in the North, a resource rich region they are keen to develop. Even Russians mostly donโ€™t like Siberian winters.

If global warming was directly hurting Russia, or Canada for that matter, large numbers of people would be migrating to the far North to escape the global warming.

Russia does have a lot of immigration, surprisingly, but I would argue this is mostly economic. The Russian economy might be a mobster run basket case from the perspective of Wealthy westerners, but for immigrants from truly poor countries, Russia offers migrants the opportunity to mostly eat regularly, which is more than many of them had back in their home country. Whatever mistreatment they receive at the hands of their Russian employers, many choose to stay, often overstaying their visas and paying bribes to Russian police to avoid deportation.

Climate alarmists would love us to accept their assertion that climate change is driving migration. But given the failure of hot nations like Singapore to depopulate, in my opinion their claims are less than convincing.