Methane Madness Strikes Again

This concern about methane is nonsense.
Water vapour blocks all the frequencies that methane does
so the presence of methane adds nothing

From Science Matters

By Ron Clutz

The latest comes from Australia by way of John Ray at his blog Methane cuts on track for 2030 emissions goal.  Excerpts in italics with my bolds and added images.

Australia’s methane emissions have decreased over the past two decades, according to a new report by a leading global carbon research group.

While the world’s methane emissions grew by 20 per cent, meaning two thirds of methane in the atmosphere is from human activity, Australasia and Europe emitted lower levels of the gas.

It puts Australia in relatively good stead, compared to 150 other signatories, to meet its non-binding commitments to the Global Methane Pledge, which aims to cut methane emissions by 30 per cent by the end of the decade.

The findings were revealed in the fourth global methane budget, published by the Global Carbon Project, with contributions from 66 research institutions around the world, including the CSIRO.

According to the report, agriculture contributed 40 per cent of global methane emissions from human activities, followed by the fossil fuel sector (34 per cent), solid waste and waste­water (19 per cent), and biomass and biofuel burning (7 per cent).

Pep Canadell, CSIRO executive director for the Global Carbon Project, said government policies and a smaller national sheep flock were the primary reasons for the lower methane emissions in Australasia.

“We have seen higher growth rates for methane over the past three years, from 2020 to 2022, with a record high in 2021. This increase means methane concentrations in the atmosphere are 2.6 times higher than pre-­industrial (1750) levels,” Dr Canadell said.

The primary source of methane emissions in the agriculture sector is from the breakdown of plant matter in the stomachs of sheep and cattle.

It has led to controversial calls from some circles for less red meat consumption, outraging the livestock industry, which has lowered its net greenhouse gas emissions by 78 per cent since 2005 and is funding research into methane reduction.

Last week, the government agency advising Anthony Albanese on climate change suggested Australians could eat less red meat to help reduce emissions. And the government’s official dietary guidelines will be amended to incorporate the impact of certain foods on climate change.

There is ongoing disagreement among scientists and policymakers about whether there should be a distinction between biogenic methane emitted by livestock, which already exists in a balanced cycle in plants and soil and the atmosphere, and methane emitted from sources stored deep underground for millennia.

“The frustration is that methane, despite its source, gets lumped into one bag,” Cattle Australia vice-president Adam Coffey said. “Enteric methane from livestock is categorically different to methane from coal-seam gas or mining-related fossil fuels that has been dug up from where it’s been stored for millennia and is new to the atmosphere.

“Why are we ignoring what modern climate science is telling us, which is these emissions are inherently different?”  Mr Coffey said the methane budget report showed the intense focus on the domestic industry’s environmental credent­ials was overhyped.

“I think it’s based mainly on ideology and activism,” Mr Coffey said.

This concern about methane is nonsense.
Water vapour blocks all the frequencies that methane does
so the presence of methane adds nothing

Technical Background

Methane alarm is one of the moles continually popping up in the media Climate Whack-A-Mole game. An antidote to methane madness is now available to those inquiring minds who want to know reality without the hype.

Methane and Climate is a paper by W. A. van Wijngaarden (Department of Physics and Astronomy, York University, Canada) and W. Happer (Department of Physics, Princeton University, USA) published at CO2 Coalition November 22, 2019. Below is a summary of the more detailed publication. Excerpts in italics with my bolds.

Overview

Atmospheric methane (CH4) contributes to the radiative forcing of Earth’s atmosphere. Radiative forcing is the difference in the net upward thermal radiation from the Earth through a transparent atmosphere and radiation through an otherwise identical atmosphere with greenhouse gases. Radiative forcing, normally specified in units of W m−2 , depends on latitude, longitude and altitude, but it is often quoted for a representative temperate latitude, and for the altitude of the tropopause, or for the top of the atmosphere.

For current concentrations of greenhouse gases, the radiative forcing at the tropopause, per added CH4 molecule, is about 30 times larger than the forcing per added carbon-dioxide (CO2) molecule. This is due to the heavy saturation of the absorption band of the abundant greenhouse gas, CO2. But the rate of increase of CO2 molecules, about 2.3 ppm/year (ppm = part per million by mole), is about 300 times larger than the rate of increase of CH4 molecules, which has been around 0.0076 ppm/year since the year 2008.

So the contribution of methane to the annual increase in forcing is one tenth (30/300) that of carbon dioxide. The net forcing increase from CH4 and CO2 increases is about 0.05 W m−2 year−1 . Other things being equal, this will cause a temperature increase of about 0.012 C year−1 . Proposals to place harsh restrictions on methane emissions because of warming fears are not justified by facts.

The paper is focused on the greenhouse effects of atmospheric methane, since there have recently been proposals to put harsh restrictions on any human activities that release methane. The basic radiation-transfer physics outlined in this paper gives no support to the idea that greenhouse gases like methane, CH4, carbon dioxide, CO2 or nitrous oxide, N2O are contributing to a climate crisis. Given the huge benefits of more CO2 to agriculture, to forestry, and to primary photosynthetic productivity in general, more CO2 is almost certainly benefitting the world. And radiative effects of CH4 and N2O, another greenhouse gas produced by human activities, are so small that they are irrelevant to climate.

Transmission of shortwave solar irradiation and long wavelength radiation from the Earth’s surface through atmosphere, as permitted by Rohde [2]. Note absorption wavelengths of CH4 and N2O are already covered by H2O and CO2.

Radiative Properties of Earth Atmosphere

On the left of Fig. 2 we have indicated the three most important atmospheric layers for radiative heat transfer. The lowest atmospheric layer is the troposphere, where parcels of air, warmed by contact with the solar-heated surface, float upward, much like hot-air balloons. As they expand into the surrounding air, the parcels do work at the expense of internal thermal energy. This causes the parcels to cool with increasing altitude, since heat flow in or out of parcels is usually slow compared to the velocities of ascent of descent.

Figure 2: Left. A standard atmospheric temperature profile[9], T = T (z). The surface temperature is T (0) = 288.7 K . Right. Standard concentrations[10], C {i} = N {i}/N for greenhouse molecules versus altitude z. The total number density of atmospheric molecules is N . At sea level the concentrations are 7750 ppm of H2O, 1.8 ppm of CH4 and 0.32 ppm of N2O. The O3 concentration peaks at 7.8 ppm at an altitude of 35 km, and the CO2 concentration was approximated by 400 ppm at all altitudes. The data is based on experimental observations.

If the parcels consisted of dry air, the cooling rate would be 9.8 C km−1 the dry adiabatic lapse rate[12]. But rising air has usually picked up water vapor from the land or ocean. The condensation of water vapor to droplets of liquid or to ice crystallites in clouds, releases so much latent heat that the lapse rates are less than 9.8 C km−1 in the lower troposphere. A representative lapse rate for mid latitudes is dT/dz = 6.5 K km−1 as shown in Fig. 2.

The tropospheric lapse rate is familiar to vacationers who leave hot areas near sea level for cool vacation homes at higher altitudesin the mountains. On average, the temperature lapse rates are small enough to keep the troposphere buoyantly stable[13]. Tropospheric air parcels that are displaced in altitude will oscillate up and down around their original position with periods of a few minutes. However, at any given time, large regions of the troposphere (particularly in the tropics) are unstable to moist convection because of exceptionally large temperature lapse rates.

The vertical radiation flux Z, which is discussed below, can change rapidly in the troposphere and stratosphere. There can be a further small change of Z in the mesosphere. Changes in Z above the mesopause are small enough to be neglected, so we will often refer to the mesopause as “the top of the atmosphere” (TOA), with respect to radiation transfer. As shown in Fig. 2, the most abundant greenhouse gas at the surface is water vapor, H2O. However, the concentration of water vapor drops by a factor of a thousand or more between the surface and the tropopause. This is because of condensation of water vapor into clouds and eventual removal by precipitation. Carbon dioxide, CO2, the most abundant greenhouse gas after water vapor, is also the most uniformly mixed because of its chemical stability. Methane, the main topic of this discussion is much less abundant than CO2 and it has somewhat higher concentrations in the troposphere than in the stratosphere where it is oxidized by OH radicals and ozone, O3. The oxidation of methane[8] is the main source of the stratospheric water vapor shown in Fig. 2.

Future Forcings of CH4 and CO2

Methane levels in Earth’s atmosphere are slowly increasing.  If the current rate of increase, about 0.007 ppm/year for the past decade or so, were to continue unchanged it would take about 270 years to double the current concentration of C {i} = 1.8 ppm. But, as one can see from Fig.7, methane levels have stopped increasing for years at a time, so it is hard to be confident about future concentrations. Methane concentrations may never double, but if they do, WH[1] show that this would only increase the forcing by 0.8 W m−2. This is a tiny fraction of representative total forcings at midlatitudes of about 140 W m−2 at the tropopause and 120 W m−2 at the top of the atmosphere.

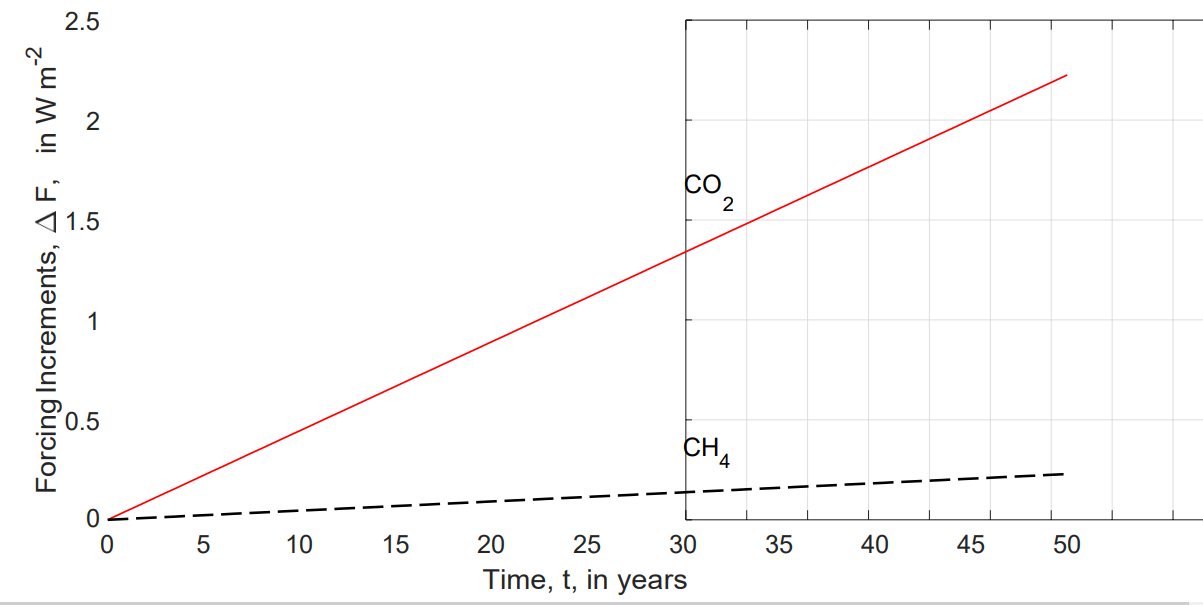
Figure 9: Projected mid-latitude forcing increments at the tropopause from continued increases of CO2 and CH4 at the rates of Fig. 7 and Fig. 8 for the next 50 years. The projected forcings are very small, especially for methane, compared to the current tropospheric forcing of 137 W m−2.

The per-molecule forcings P {i} of (13) and (14) have been used with the column density Nˆ of (12) and the concentration increase rates dC¯{i}/dt, noted in Fig. 7 and Fig. 8, to evaluate the future forcing (15), which is plotted in Fig. 9. Even after 50 years, the forcing increments from increased concentrations of methane (∆F = 0.23 W m−2), or the roughly ten times larger forcing from increased carbon dioxide (∆F = 2.2 W m−2) are very small compared to the total forcing, ∆F = 137 W m−2, shown in Fig. 3. The reason that the per-molecule forcing of methane is some 30 times larger than that of carbon dioxide for current concentrations is “saturation” of the absorption bands. The current density of CO2 molecules is some 200 times greater than that of CH4 molecules, so the absorption bands of CO2 are much more saturated than those of CH4. In the dilute“optically thin” limit, WH[1] show that the tropospheric forcing power per molecule is P {i} = 0.15 × 10⁻²² W for CH4, and P {i} = 2.73 × 10⁻²² W for CO2. Each CO2 molecule in the dilute limit causes about 5 times more forcing increase than an additional molecule of CH4, which is only a ”super greenhouse gas” because there is so little in the atmosphere, compared to CO2.

Methane Summary

Natural gas is 75% Methane (CH4) which burns cleanly to carbon dioxide and water. Methane is eagerly sought after as fuel for electric power plants because of its ease of transport and because it produces the least carbon dioxide for the most power. Also cars can be powered with compressed natural gas (CNG) for short distances.

In many countries CNG has been widely distributed as the main home heating fuel. As a consequence, in the past methane has leaked to the atmosphere in large quantities, now firmly controlled. Grazing animals also produce methane in their complicated stomachs and methane escapes from rice paddies and peat bogs like the Siberian permafrost.

It is thought that methane is a very potent greenhouse gas because it absorbs some infrared wavelengths 7 times more effectively than CO2, molecule for molecule, and by weight even 20 times. As we have seen previously, this also means that within a distance of metres, its effect has saturated, and further transmission of heat occurs by convection and conduction rather than by radiation.

Note that when H20 is present in the lower troposphere, there are few photons left for CH4 to absorb:

Even if the IPCC radiative greenhouse theory were true, methane occurs only in minute quantities in air, 1.8ppm versus CO2 of 390ppm. By weight, CH4 is only 5.24Gt versus CO2 3140Gt (on this assumption). If it truly were twenty times more potent, it would amount to an equivalent of 105Gt CO2 or one thirtieth that of CO2. A doubling in methane would thus have no noticeable effect on world temperature.

However, the factor of 20 is entirely misleading because absorption is proportional to the number of molecules (=volume), so the factor of 7 (7.3) is correct and 20 is wrong. With this in mind, the perceived threat from methane becomes even less.

Further still, methane has been rising from 1.6ppm to 1.8ppm in 30 years (1980-2010), assuming that it has not stopped rising, this amounts to a doubling in 2-3 centuries. In other words, methane can never have any measurable effect on temperature, even if the IPCC radiative cooling theory were right.

Because only a small fraction in the rise of methane in air can be attributed to farm animals, it is ludicrous to worry about this aspect or to try to farm with smaller emissions of methane, or to tax it or to trade credits.

The fact that methane in air has been leveling off in the past two decades, even though we do not know why, implies that it plays absolutely no role as a greenhouse gas.  (From Sea Friends (here):

More information at The Methane Misconceptions by Dr. Wilson Flood (UK) here.

Another Episode Of Cleaning The Augean Stables

Our estimable Charles the Moderator, who gets my eternal thanks for keeping the hits happening here on WUWT, asked me to take a look at a new paper yclept Multivariate Analysis Rejects the Theory of Human-caused Atmospheric Carbon Dioxide Increase:The Sea Surface Temperature Rules by Dai Ato, an independent researcher in Japan. Seems it’s been getting some play. I’ll refer to this paper as Ato2024.

Carbon dioxide readings at the Mauna Loa Observatory in Hawaii have reached what atmospheric scientist Ralph Keeling calls a “psychological threshold” of 400 parts per million. The amount of carbon dioxide in the atmosphere has been steadily increasing since near-constant measurements began at the observatory in 1958.

From Watts Up With That?

Guest Post by  Willis Eschenbach (@weschenbach on eX-Twitter)

Our estimable Charles the Moderator, who gets my eternal thanks for keeping the hits happening here on WUWT, asked me to take a look at a new paper yclept Multivariate Analysis Rejects the Theory of Human-caused Atmospheric Carbon Dioxide Increase:The Sea Surface Temperature Rules by Dai Ato, an independent researcher in Japan. Seems it’s been getting some play. I’ll refer to this paper as Ato2024.

I wasn’t far in before alarms went off. The study conducted a multivariate analysis using publicly available data to examine the impact of sea surface temperature (SST) and human emissions on atmospheric CO₂ levels.

It concluded that SST was the independent determinant of the annual increase in atmospheric CO₂ concentration. Human emissions were found to be irrelevant in the regression models.

And most revealingly, it says:

Furthermore, the atmospheric CO₂ concentration predicted, using the regression equation obtained for the SST derived from UK-HADLEY centre after 1960, showed an extremely high correlation with the actual CO₂ concentration (Pearson correlation coefficient r = 0.9995, P < 3e-92).

BZZZZT!! Whenever I get an r-value that high, I know for a fact that I’m doing something very wrong … I’ll get back to that.

First, let me start with one of the three variables in their analysis, which are SST, CO2, and emissions. Here are three reconstructions of SST since 1854 by three different groups.

Figure 1. Global monthly average sea surface temperatures (SSTs). Yellow area at the right is the portion of the record analyzed by Ato.

While there are some differences, overall the pattern is clear. There was SST warming from ~ 1850 to about 1870, cooling to ~ 1910, warming to ~ 1940, cooling to ~ 1965, and warming since then.

Looking at that, I can see why Ato doesn’t want to use the full record—it doesn’t support his claim that SSTs are the independent determinant of atmospheric CO2 levels. The CO2 data (Figs. 2 and 3 below) looks nothing like that.

So how does he justify the cutoff? Well, the Mauna Loa CO2 measurement data starts about 1960. However, it can be extended back beyond that using the ice core CO2 records. Here’s what that looks like.

Figure 2. Mauna Loa and ice core measurements of the background atmospheric CO2 levels, 1000-2010AD. Data: Ice Cores Mauna Loa

Ato2024 says that the ice core records are not accurate. However, this is belied by the close agreement of the ice core records with each other and with the Mauna Loa measurements as shown above.

Below is a closer view of the recent end of the data since 1850, corresponding to the time frame of the sea surface temperatures (SSTs) in Figure 1.

Figure 3. As in Figure 2, but post-1850 data only

As a result of the good agreement of the ice cores both with each other and with the Mauna Loa data, I see no problem in taking that as a good reconstruction of the post-1850 CO2 levels.

The problem, of course, is that the pre-1960 ocean temperatures do not look anything like the pre-1960 CO2 levels … and this disagreement totally falsifies Ato2024. So he is obliged to ignore it.

Next, how did he get such a great correlation, 0.9995, between SST and CO2 in the post-1960 data? In part the answer lies in what he looked at. Here’s the Mauna Loa post-1960 CO2 record he used. Note that he didn’t use the monthly data, just the annual data. Makes it easier to get a higher Pearson correlation coefficient “r”.

Figure 4. Mauna Loa Observatory CO2 observations, along with the linear trend line.

The recent increase in CO2 is a very slowly accelerating curve which is nearly a straight line. This leads to many false correlations because such a curve is easy to replicate as we’ll see below. This is a recurring problem in climate science.

But that’s just the first problem. The main problem is the procedure that he used. Here’s the description from the paper.

Note that the symbol delta (∆) in the equations means “change in”. So ∆CO2 is the change in CO2 from one year to the next.

Translated, that says:

  • Calculate the best-fit linear estimation of the annual changes in CO2 (∆CO2), based on the Hadley HadSST sea surface temperature.
  • The predicted atmospheric CO2 is then the starting atmospheric CO2 plus the cumulative sum of the estimated annual changes in CO2.

Here’s a graph of the first part of that calculation, fitting the SST to the annual change in CO2.

Figure 5. Post 1960 annual change in atmospheric CO2 (∆CO2), along with the linear trend line of ∆CO2, and the best estimation of ∆CO2 based on the Hadley HadSST4.0.1.

Now, there’s an oddity about graphing delta CO2, or ∆ anything for that matter. It involves a couple of curious changes. I’ll use graphing ∆CO2 as in Fig. 5 as my example.

First, any overall linear trend in the CO2 data is converted into an overall offset from zero (a non-zero average) in the ∆CO2 graph.

Second, any overall acceleration in the CO2 data is converted into an overall linear trend in the ∆CO2 graph.

So from looking at Figure 5, we can see that the ∆CO2 data has both a positive trend and an acceleration. We can see both of those in Figure 3 above.

And now that we’ve fitted the SST to the ∆CO2 data so we can estimate the ∆CO2, we simply sum those changes cumulatively to estimate the underlying CO2 data. Here’s that result.

Figure 6. Mauna Loa CO2 data, and Ato2024 estimation of the Mauna Loa CO2 data

At this point, I’ve replicated his results.

Now, remember that I said that a correlation coefficient of 0.999+ means there’s some fatal flaw in the logic. So … what’s not to like?

In his note asking me to take a look at this paper, Charles The Moderator included an interesting AI analysis of the paper, viz (emphasis mine):

Based on my analysis of the paper, the key issue of circular reasoning appears to be in the methodology used to predict atmospheric CO2 concentrations from sea surface temperature (SST) data. Specifically:

• The author uses multiple linear regression to derive an equation relating annual CO2 increase to SST for the period 1960-2022.

• This equation is then used to “predict” CO2 concentrations for the same 1960-2022 time period.

The predicted and measured CO2 concentrations are found to have an extremely high correlation (r = 0.9995).

The circular reasoning occurs because the same data is used both to derive the equation and to test its predictive power. The key equations involved are:

The regression equation (from Step 7 in the paper):

Annual CO2 increase = 2.006 × HAD-SST + 1.143 (after 1959)

The prediction equation:

[CO2]n = Σ[ΔCO2]i + Cst

Where [CO2]n is the predicted CO2 concentration, [ΔCO2]i is the annual increase calculated from the regression equation, and Cst is the actual CO2 concentration in the starting year.

By using this method, the author is essentially fitting the equation to the data and then using that same fitted equation to “predict” the data it was derived from. This guarantees an extremely high correlation that does not actually demonstrate any predictive power or causal relationship.

A proper analysis would use separate training and testing datasets, or employ techniques like cross-validation, to avoid this circularity.

The extremely high correlation reported is almost certainly an artifact of this flawed methodology rather than evidence of a genuine relationship between SST and atmospheric CO2 levels.

And the AI is right. Well, partly right. They’re right to say that the problem is not that Ato2024 fitted SST to CO2. The problem is that Ato2024 didn’t withhold half the data to verify the results. It’s easy to predict something when you already know the outcome …

HOWEVER, and it’s a big however … while that problem alone is enough to totally falsify the conclusions, there’s another really big problem. To illustrate that, I’ve used the Ato2024 method. But instead of using sea surface temperature as the input to be fitted to the ∆CO2 data as Ato2024 does, I’ve fitted a straight line to the ∆CO2 data. It’s the blue line in Figure 5 above.

And using the Ato2024 method, I’ve converted that straight line to the equivalent CO2 data shown in red in Figure 7 below.

Figure 7. As in Figure 6, plus a red line showing the result of using a simple straight line in place of the sea surface temperature (SST) used the Ato2024.

Interesting. Using the Ato2024 method of fitting a variable to ∆CO2, a straight line as input does just as as well as using the SST as input.

But that doesn’t really show the full scope of the problem. To do that, I first divided the SST, the straight line, and ∆CO2 data in two halves. I used the first half for fitting either the SST or the straight line to the first half of the ∆CO2. Then I used those results to estimate the change in CO2. Figure 8 shows that result.

Figure 8. As in Figure 7, but using only the first half of the data to fit the model, and then using the full data to see how well it performs.

This graph reveals two separate problems. First, although the fit is considerably poorer than in Figure 6, the Pearson correlation coefficient “r” is basically unchanged … meaning that it is not an appropriate measure for this particular issue.

Next, the straight line continues to perform just as well as using the SST as the independent variable … no bueno. This indicates a profound problem with the underlying Ato method.

To show the problem, I’m gonna re-show Figure 5 from above.

To recap, first, any overall linear trend in the CO2 data is converted into an overall offset from zero (a non-zero average) in the ∆CO2 graph.

Second, any overall acceleration in the CO2 data is converted into an overall linear trend in the ∆CO2 graph.

And here’s the key. When you fit the SST data (or more importantly, any data) to the ∆CO2 data, you end up with a fitted signal that has the same non-zero average and the same trend as the ∆CO2 data.

Not only that, but the fit will be balanced, with the amount above and the amount below the trend line being equal.

And all of that guarantees that if you start out trying to predict a smooth curve, when you reconstruct the signal using the method of Ato2024, you’ll get an answer that is VERY close to the smooth curve regardless of what variable you use to reconstruct the signal.

And that is why using the straight line does just as well as using the SST, or any other variable, as the basis for the estimation of CO2.

I weep for the death of honest peer-review …

My best to everyone,

w.

Yeah, you’ve heard it before: When you comment please quote the exact words you’re discussing. It avoids endless misunderstandings.

Billionaire Ballmer blurts out to Jon Stewart: Wind turbines “destroy habitats”

Donald Trump was not the only unscripted billionaire America heard from Tuesday night.

Growing evidence of wind farms’ horrific toll on wildlife: This time from IndiaFormer Microsoft CEO Steve Ballmer blurted out one of the roughest facts about so-called “renewable energy.”

The incredibly massive land required for wind and solar wrecks natural habitats and threatens the survival of birds, whales, and other species.

From CFACT

By Craig Rucker

Donald Trump was not the only unscripted billionaire America heard from Tuesday night.

Former Microsoft CEO Steve Ballmer blurted out one of the roughest facts about so-called “renewable energy.”

The incredibly massive land required for wind and solar wrecks natural habitats and threatens the survival of birds, whales, and other species.

That’s the lesson comedian Jon Stewart accidentally shared with America, as Stewart got a quick lesson on the perils of live television.

Stewart did a live post-debate episode of The Daily Show.  Ballmer was his special guest, and the topics were government data and Capitalism.

Imagine Stewart’s surprise when Ballmer chose the devastating impact of wind turbines on birds to illustrate the challenges of balancing free market efficiency with environmental regulation.

Ballmer: Let’s say my base instinct is to… I want to destroy the habitat of a set of birds by building a windmill, OK? Let’s say that’s the topic.

Stewart: Can I just say something very quickly?  You bastard. Why– you son of a bitch!

Ballmer: OK, Mister Democracy, let’s take it on! The birds–

Stewart: Yes

Balmer: The capitalist is going to try and get that windmill built.

Stewart: Sure

Ballmer: If you want it built, capitalist will get it built. If you want to protect the birds, the capitalist will stop trying to build that windmill.  I talked to a guy who’s actually trying to build one of the largest wind farms in the world…

Stewart: Let me give you a different example… (deftly deflects to offshore labor).

Don’t you wish Stewart had asked instead, “What did the guy trying to build the giant wind farm tell you about how wind turbines harm birds, and how is he getting around it?”

“Wind farms can reduce bird numbers by up to half,” according to Britain’s Royal Society for the Protection of Birds.   The Daily Telegraph reported in 2009 that even worse than the obvious impact of turbines striking birds from the sky is “the fact that birds are less likely to live near wind farms because of the noise and development.”

The Royal Society saw resignations and defections when it ignored its own report and endorsed wind turbines despite their destructive impact on birds, and its study has not been properly followed up by regulators.

Billionaire Steve Ballmer inadvertently provided us a peek into what government regulators and all of us need to know about the devastating environmental impacts of wind and solar.

Will our government “watchdogs” pay attention and exercise due diligence while there is still time?

Right, Rigzone and Rystad Energy, Oil and Gas Will Remain Dominant for the Foreseeable Future

A recent article at Rigzone, “Rystad: Oil, Gas Will Remain Central to Energy Mix for Foreseeable Future,” reports on comments made by Rystad Energy, a Norwegian energy research company, in a report it published claiming that despite the push for renewables, oil and gas will stay dominant as an energy source in the coming years. This is true, although Rystad goes on to lament the resulting emissions and tries to push further decarbonization. It is true that there has been little actual transition, despite what renewables hawks say.

From ClimateRealism

By Linnea Lueken

A recent article at Rigzone, “Rystad: Oil, Gas Will Remain Central to Energy Mix for Foreseeable Future,” reports on comments made by Rystad Energy, a Norwegian energy research company, in a report it published claiming that despite the push for renewables, oil and gas will stay dominant as an energy source in the coming years. This is true, although Rystad goes on to lament the resulting emissions and tries to push further decarbonization. It is true that there has been little actual transition, despite what renewables hawks say.

Rigzone writes that “despite the accelerating energy transition, oil and gas will remain central to the global energy mix for the foreseeable future as the key hydrocarbon sources continue to satisfy global primary energy demand, Rystad Energy stated in a release . . ..”

Rystad predicts that more than 75 percent of total energy demand will be met by fossil fuels by 2030.

Rystad’s report says that as upstream energy companies “work to transform into integrated energy players and decarbonize their operations, it is crucial not only to achieve transition goals but also to minimize the carbon footprint of upstream activities, with extraction of these resources accounting for more than 800 million tonnes of CO2e every year.”

Going further, Rystad recommends recommend energy companies focus more intensely on “premium energy basins” to try to “decarbonize” operations.

It seems strange that Rystad would say it’s crucial to “achieve transition goals” – meaning the so-called energy transition away from the use of fossil fuels, which would not only “minimize” the carbon footprint of upstream operations, but aims to eliminate them altogether. They advocate in wishy-washy corporate terms for the annihilation of the industry that Rigzone purportedly represents.

In terms of energy supply, Rystad’s report predicts that even as wind and solar produce a larger percentage of energy by 2050, overall the global energy supply will drop rather than continue to rise. This forecast should alarm anyone concerned about continued economic growth, which tracks energy use. It is especially troubling when one considers the political push to electrify everything, from electric vehicles, to appliances, in addition to the projected demand for power from utilities to satisfy the growing demand electricity to power data centers and AI facilities. (See figure below)

Real-world electricity production data described by Our World in Data, provides little evidence of a transition from fossil fuels to renewables. Rather wind, biofuels, and solar are being added to the overall mix, with traditional sources of energy still growing, although at a slower rate than in past decades. Consumption of all energy sources has increased or remained constant since the 1980s. (See figure below)

Coal, despite being villainized in the West lately, may well also continue to see increasing demand in international markets. In 2022, a new record for coal consumption was hit, and it made up 37 percent of the world’s energy use in 2023. In 2022 India revised their energy use targets and increased their coal production and use. As discussed in a Climate Realism post, “Green Media Misrepresents World’s Energy Reality,” India, on its own, is set to consume more energy than all the countries that make up the European Union by 2030, and coal will be large part of that mix. Likewise China continues to buy up and use coal, and they also have been steadily increasing demand for oil.

Renewables would need to make an unbelievable, and likely technologically and materially impossible, jump in the coming years to catch up and displace fossil fuels like oil, gas, and coal.

As Climate Realism has pointed out many times; here, here, and here, for example, forcing an energy transition will lead to misery and reduced or halted standards of living for people around the world.

It is not clear what Rigzone and Rystad mean by an “accelerating” energy transition, based on the facts above. If anything, it seems like the growth of coal and oil and gas are at worst keeping pace with gains made by renewables like wind and solar. Rigzone and Rystad are both correct, though, that for the foreseeable future oil and gas will continue to make up the vast majority of global energy production.

Kamala Harris is full on hiding her climate agenda from voters

Climate change does not poll well so Vice President Kamala Harris is downplaying the whole issue. Gone is the drumbeating that nothing is more important to the next generation than addressing climate change.

During the presidential debate with former President Donald Trump, Vice President Kamala Harris turned the moderator’s question about climate change into a discussion about housing insurance costs.

From CFACT

By Marc Morano

Climate change does not poll well so Vice President Kamala Harris is downplaying the whole issue. Gone is the drumbeating that nothing is more important to the next generation than addressing climate change.

During the presidential debate with former President Donald Trump, Vice President Kamala Harris turned the moderator’s question about climate change into a discussion about housing insurance costs.

She declared climate change was “very real” and then she pivoted to what NPR described as morphing climate change into a “pocketbook issue.”

“You ask anyone who lives in a state who has experienced these extreme weather occurrences who now is either being denied home insurance or it’s being jacked up; you ask anybody who has been the victim of what that means in terms of losing their home, having nowhere to go,” Harris said during the debate.

Why has the climate issue, formerly known as an “existential threat” — complete with doomsday tipping points — now turned into a question of mere insurance costs for the Democratic presidential nominee? The Washington Post reported that Democratic Party leaders “appear to have calculated that climate silence is the safest strategy.” The Post explained, “Democrats see talking about the environment as a lose-lose proposition.”

When Harris was finally asked about “climate change” during her first sit-down media interview on CNN, she addressed her recent campaign reversals on fracking, EVs and net zero issues by claiming her ‘values’ have not changed.

Harris told CNN that there is a “climate crisis” and the way to solve it was by spending “a trillion dollars” and applying “metrics that include holding ourselves to deadlines around time.”

Huh? So, Harris’ position on the alleged threat of man-made climate change still duplicates her 2019 brief presidential run. Her repeated claims that she will no longer seek to “ban” fracking do not address the fact that continuing Green New Deal and Inflation Reduction Act policies will result in a death by a thousand cuts on fracking and other U.S. energy production methods.

She pledged to continue the ideological net zero fairy-tale that government spending and mandates can alter the Earth’s climate system. Harris’ energy plans will continue to hammer America first.

Let’s remember that Harris’ “values” have included being an original co-sponsor of AOC’s Green New Deal, casting a tie-breaking vote in 2022 for the Inflation Reduction Act, supporting gas-powered car bans, gas stove bans, looking at climate change as one of the “root causes” of illegal immigration, and meat restrictions via the administration’s EPA regulations on agricultural methane emissions.

In addition, the Biden-Harris administration has talked openly about the possibility of declaring a national climate emergency, which — according to NBC News — “can unlock special powers for a president in a crisis without needing approval from Congress.”

Bypassing democracy to impose a Green New Deal on America appears central to Harris’ “values.” But, somehow, her “values” have rapidly gone silent on the alleged “existential” climate threat of the 21st century during this heated presidential campaign.

If you listen closely, the Harris “silence” fades away. The Harris campaign raucously boasted to Reuters that the “climate silence” is all part of her master election plan.

“She has been pursuing a policy of ‘strategic ambiguity’ on energy policy, [Harris] aides told Reuters last month. She is anxious not to put off undecided voters in swing states, especially gas-producing Pennsylvania, by trumpeting her climate credentials too loudly.”

“Too loudly?!” The only Harris climate “values” that seem to matter are “strategic ambiguity” — otherwise known as deception.

The reality is that Harris’ “climate silence” is a concession to scientific reality and the failed solar and wind promises that are causing a pointless drain on the U.S. economy. The public has been hearing for years of how solar and wind are “cheaper” than fossil fuels and how they are about to replace fossil fuels. But the reality is starkly the opposite of these claims and the Democrat Party knows this.

Despite trillions of dollars in subsidies, green energy mandates, UN climate summits, net zero commitments and restrictions on fossil fuels, solar & wind power made up just 13.9% of the world’s electricity in 2023. Meanwhile, the U.S. still consumed 82% of our energy from fossil fuels in 2023.

When these energy realities are screaming in your face, silence may be the only answer.

The most surprising aspect of the Harris-Walz climate shush campaign may be why the climate establishment has no qualms about muzzling climate change. The New York Times reported that “[Harris] has mentioned climate change only in passing” and noted that “[c]limate leaders say they are fine with that.”

Why are climate activists suddenly “fine” with their standard bearers hushing up on climate during a heated presidential race? Perhaps the answer can be found in the advice of Democratic Party activist Rev. Mark Thompson at the August DNC convention in Chicago, when he declared, “We got 70 days to act right, y’all. Now, after 70 days, we can go back to acting crazy, right?” he said. Thompson added, “Just wait 70 days to go back, please. Be good.”

Let’s hope Americans can glean the climate “crazy” blaring from Harris-Walz’s sham “climate silence” campaign.

This article originally appeared in The Daily Caller

Studies That ‘Confirm’ Humans Cause Climate Rely On Imaginary-World Conditions In Their Calculations

To claim that anthropogenic CO2 emissions drive global warming, radiative forcing modeling studies must assume 1) clouds do not ever change, 2) cloud albedo is constant, and/or 3) clouds do not exist. None of these are real-world conditions.

From NoTricksZone

By Kenneth Richard 

To claim that anthropogenic CO2 emissions drive global warming, radiative forcing modeling studies must assume 1) clouds do not ever change, 2) cloud albedo is constant, and/or 3) clouds do not exist. None of these are real-world conditions.

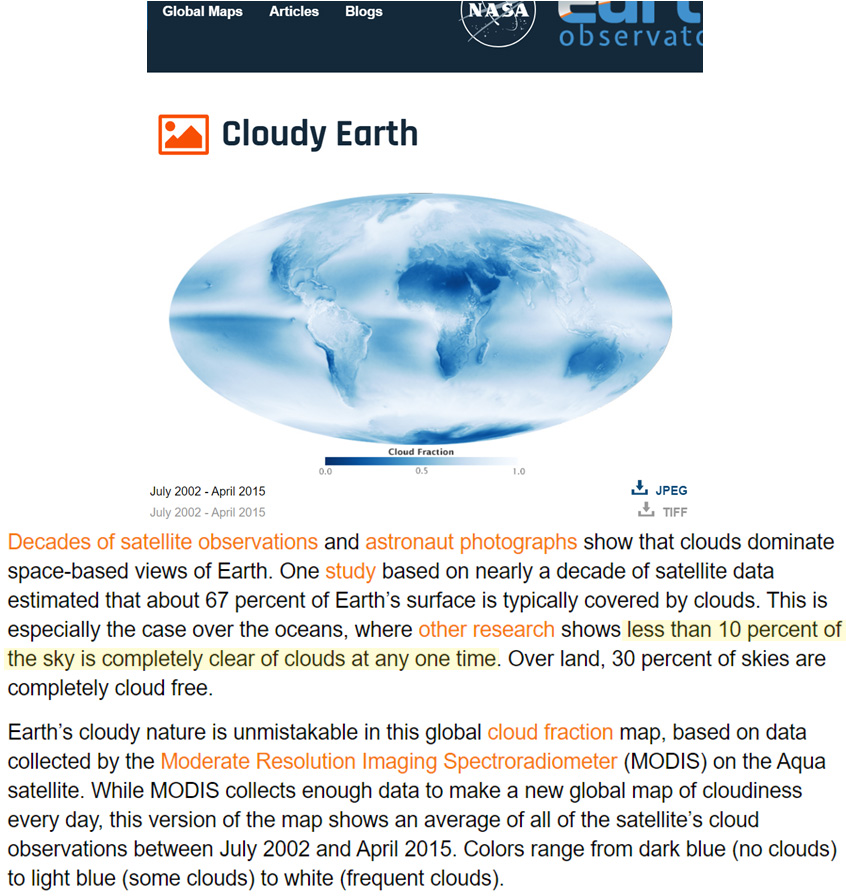
The real atmosphere is what scientists refer to as all-sky, an atmosphere where clouds not only exist but they are present 70-90% of the time.

In the real world clouds also “regulate the Earth’s climate,” as they are “the most important parameter controlling the radiation budget, and, hence, the Earth climate” (Sfîcă et al., 2020, Lenaerts et al., 2020).

Image Source: Sfîcă et al., 2020 and Lenaerts et al., 2020

Studying all the factors contributing to Earth’s Energy Imbalance (EEI) means we must consider the controlling, regulating dominance of the cloud radiative effect. Isolating selected factors like well-mixed greenhouse gases (CO2, CH4) while simultaneously excluding the cloud radiative effect only serves to advance a narrative about what is believed to occur an imaginary world where clouds are constant or do not exist.

Succinctly, an all-sky atmosphere analysis means cloud radiative effects are included in the calculations. A clear-sky analysis excludes the radiative effect of clouds.

Modeling studies purporting to isolate the radiative effect of anthropogenic emissions of CO2 and other greenhouse gases can only refer to clear-sky conditions – an Earth atmosphere that does not exist in reality.

Recently, Kramer et al. (2021) has received a lot of attention as a study robustly supporting the claim we humans have been and continue to control the climate with our CO2 emissions. They use a modeling “technique” that is claimed to isolate the human contribution to the radiative forcing from the “total radiative changes” from 2003 to 2018.

“We use the radiative kernel technique to isolate radiative forcing from total radiative changes and find it has increased from 2003 to 2018, accounting for nearly all of the long-term growth in the total top-of-atmosphere radiation imbalance during this period.”

However, the authors acknowledge that to arrive at their conclusion that anthropogenic CO2 is the dominant radiative forcing factor, their modeling calculations can only apply to an imaginary-world, clear-sky-only atmosphere. They admit radiative modeling for an all-sky world is “not possible.” So they assume clouds are constant, and that cloud albedo variations neither exist or affect climate. Hence, their study does not use real-world observational evidence; it only uses modeled calculations for a world that does not exist in reality.

“For all-sky conditions, an analogous calculation…requires the [instantaneous radiative forcing from all factors affecting climate] be known, [and thus] this differencing technique is not possible.”

“…we estimate Cl [cloud cover] is a constant…”

“For the [longwave impact from clouds] we use a constant of 1.24, derived from dividing clear-sky and all-sky double-call radiative transfer calculations of CO2 [instantaneous radiative forcing] from models.”

“This conversion to all-sky conditions accounts for the presence of clouds but not cloud changes. Therefore, the [instantaneous radiative forcing] in this study does not include aerosol-cloud interactions, such as cloud albedo effects.”

Image Source: Kramer et al., 2021

Feldman et al. (2015) is another study that anthropogenic global warming (AGW) apologists often claim provides “observational” evidence of the dominance of CO2 forcing in climate change. But, of course, this widely-heralded study also only has radiative calculations applying to an imaginary world where clouds do not exist (clear-sky). The authors even admit in the abstract that CO2’s radiative effects can only impact 10% of the longwave forcing trend in clear-sky.

Image Source: Feldman et al., 2015

Song et al. (2016) provide an excellent illustration of the reason why AGW-promoting studies only reference imaginary-world, clear-sky conditions and simultaneously exclude real-world conditions, or all-sky.

From 2003-2014, the total greenhouse effect forcing trend can be shown to be positive (blue) – but only for clear-sky conditions where CO2 and water vapor are presented as the drivers. This supports the position that rising CO2 and other greenhouse gases are enhancing the greenhouse effect as they rise.

But clouds exist, and all-sky is reality. And, in contrast to the clear-sky trend, the all-sky greenhouse effect impact (where clouds are considered as a radiative forcing factor in climate) is negative (red). The greenhouse effect is not enhanced, but devolves to a decline or a “hiatus” when clouds are considered.

“Therefore, although the greenhouse effect can be enhanced by increasing GHGs and water vapor in the atmosphere, it can be weakened by decreasing clouds. If these two actions offset each other, a hiatus of the global greenhouse effect will result.”

Image Source: Song et al., 2016

Of course, AGW apologists do not want us to see what happens when we fail to pretend clouds do not exist, or that clouds are not variable, but constant. They know cloud radiative effects destroy the humans-did-it narrative.

Stealing the Future with Green Steel

Steel is essential in modern society, providing us with homes, factories, bridges, vehicles and all manner of other machines and infrastructure. Since 2001, global crude steel production has doubled and the demand will continue to rise in the coming decades.

From Watts Up With That?

By Vijay Jayaraj

Steel is essential in modern society, providing us with homes, factories, bridges, vehicles and all manner of other machines and infrastructure. Since 2001, global crude steel production has doubled and the demand will continue to rise in the coming decades.

In the climate obsessed’s rush to “decarbonize” heavy industry, hydrogen-based steel manufacturing is being touted as a “clean” alternative to the traditional coal-based process for steelmaking. With seemingly little thought being applied, policymakers, environmentalists, and some industry leaders are promoting hydrogen-fueled manufacturing with an enthusiasm once reserved for solar panels.

However, a shift towards hydrogen steelmaking risks undoing a century of progress in efficient production. The high costs, technological challenges, and limited scalability of hydrogen-based processes are guaranteed to render it less viable than steelmaking relying on coal.

The Evolution of Steelmaking Efficiency

The steel industry has been a cornerstone of industrial development, and its evolution is a testament to human ingenuity and technological advancement. In the early 20th century, the introduction of the basic oxygen furnace revolutionized steel production.

Over the decades, continuous improvements in blast furnace technology, process control and energy recovery have led to significant gains in productivity and energy efficiency. China continues to dominate in production capacity and exports, with industry giants like Baowu Group at the forefront. Other significant steel producers include Japan’s Nippon Steel & Sumitomo Metal Corp., India’s Tata Steel, South Korea’s POSCO and Europe’s ArcelorMittal.

Today’s integrated steel mills are marvels of engineering, capable of producing millions of tons annually with remarkable efficiency. The best-performing blast furnaces can achieve energy efficiencies of up to 70%, a figure that seemed unattainable just a few decades ago. The risk of abandoning this tried-and-true method for a relatively untested hydrogen-based process cannot be overstated.

The Perils of Hydrogen Steelmaking

Hydrogen-based steel production, particularly the direct reduced iron process using hydrogen, is presented as a solution to climate change. But the production of so-called green hydrogen, which is produced with “renewable” energy, can cost twice as much as coal.

Conservative estimates suggest that hydrogen-based steel production could be 20-30% more costly than traditional methods. This cost differential is not trivial in an industry with tight margins and intense global competition.

The increased costs would ripple through the economy, affecting construction, automotive manufacturing, and countless other industries that rely on affordable steel.

Rystad Energy says “green” steel can be made competitive only by imposing heavy taxes on coal-based steel or by allocating huge subsidies to steel makers.

Moreover, hydrogen made through electrolysis is energy intensive. To produce enough to meet the steel industry’s needs would require a massive expansion of renewable energy capacity, far beyond current projections.

While pilot green hydrogen projects exist, it has not been proven at industrial scales. In contrast, one of the most significant advantages of coal-based steelmaking is its ability to operate at massive scales.

Modern blast furnaces can produce up to 400 tons of steel per hour, operating continuously for years between major maintenance periods. This scale of production is crucial for meeting global steel demand, which stood at 1.95 billion tons in 2021 and is projected to grow.

Coal’s abundance and established supply chains make possible this sustained level of production. Capable of supplying the steel sector with the approximately one billion tons of coal annually, the industry’s infrastructure for mining, transporting and utilizing coal in steelmaking has been developed and refined over more than a century.

On the other hand, hydrogen-based steelmaking is one more absurd proposal of those fearmongering about global warming that would have virtually no effect on Earth’s temperature but would slow the economic growth and infrastructure development of our modern world.

This commentary was first published at RealClearMarkets on August 23, 2024.

Vijay Jayaraj is a Research and Science Associate at the CO2 Coalition, Arlington, Virginia. He holds a master’s degree in environmental sciences from the University of East Anglia, U.K., and a postgraduate degree in energy management from Robert Gordon University, U.K.

New report warns of growing risk to Britain’s energy security

As Britain’s electricity system becomes increasingly reliant on interconnection with European nations, a new report published by the Global Warming Policy Foundation warns about the growing risks to the UK’s energy security and security of supply.

From NOT A LOT OF PEOPLE KNOW THAT

London, 12 September: As Britain’s electricity system becomes increasingly reliant on interconnection with European nations, a new report published by the Global Warming Policy Foundation warns about the growing risks to the UK’s energy security and security of supply.


Interconnectors are seen as key to managing periods of low wind output in an electricity system increasingly dependent on intermittent renewables. But what if the markets at the other end of those interconnectors are also experiencing dunkelflaute conditions of low wind?


As most of these countries have similar weather to the UK, and share similar wind-led Net Zero targets, the risk to Britain’s security of supply is growing significantly.


Kathryn Porter, the report’s author, warns:
“The rules governing the behaviour of interconnectors do not guarantee they will import to Britain during times of electricity shortages – they could even export instead. Some countries are expressing doubts about their commitment to trading electricity, and have passed laws allowing them to suspend exports under critical conditions. They are also considering imposing export taxes in order to prevent domestic prices rising too much, which may reduce the availability of exports.

When the Earth was hotter, Fish swam in the Sahara

A hotter world might not be so horrible. Back in the early Holocene, 10,000 years ago, rivers flowed in the middle of the Sahara desert, and they were filled with fish. The photo above is what remains of Takarkori Lake today. If only climate change could bring back the fish?

From JoNova

By Jo Nova

Cold is the Catastrophe

A hotter world might not be so horrible. Back in the early Holocene, 10,000 years ago, rivers flowed in the middle of the Sahara desert, and they were filled with fish. The photo above is what remains of Takarkori Lake today. If only climate change could bring back the fish?

While we were distracted in 2020, researchers published a paper about an trove of bones and body parts they had dug out of a cave in Southwest Libya, which is roughly the middle of the Sahara today. Surprisingly they found 17,551 bones, and even more surprisingly, 80% of them were from fish.

The people who dined there were catching tilapia and clariid catfish, and sometimes the odd mud turtle, mollusc and a crocodile or two. The lake (pictured above) is about 6 kilometers from the cave (below), and all the bones appear to be human refuse. It’s kind of the ultimate archaeological FOGO dump.

Somehow, this restaurant that stayed open for 6,000 years left behind layer after layer of undisturbed dining history. Gradually, over thousands of years the diners ate less fish, and more beef, goat and mutton.

Amazingly, 17,000 bits of bone and bits were found in an area of just 150 meters square. Somehow, against the odds, the researchers were able to identify every single fish bone. It seems astonishing, except the odds were 50:50 that each bone was either a Tilapia or a Clariid catfish. The residents may have been a bit tired of eating the same two fish.

While the rivers and wetlands may have had a lot of fish, there wasn’t much variety.

https://journals.plos.org/plosone/article?id=10.1371/journal.pone.0228588

The authors, Wim van Neer et al, speculate that the fish probably spread to these lakes via massive flooding events that washed them over the land. (Imagine how big those floods would have to be?) They wonder if the odd bird might have dropped some fish eggs, but don’t think it is as likely. Apparently sometimes even storms can pick up fish and fling them far away. If humans ever did control the climate and fix it in its current state, they would stop life returning to the desert and call it a “win” for the environment. Crazy eh?

During this hot Holocene era, there were many other rivers across the Sahara that don’t flow there today. The lakes near Takarkori dried up during the sudden shocking cold snap 8,200 years ago, but came back after a few centuries.  (Just more climate change!) Sometime around 5,500 years ago they dried up for good (or bad, if you were a nomadic herder).

One river nearby managed to keep flowing until Roman times, about 2,000 years ago.

Map of Saharan rivers and water systems of the Holocene. Fig 14. Extant occurrence of selected aquatic species (fish, crocodile, and turtle) in North Africa waterways.
Crocodylus distribution has to be considered continuous in the present waterways south of the Sahara desert and along the Nile River south of Aswan.

The remnants at the cave cover an era 6,000 years long

It is somewhat sobering to be reminded of just how many generations have come and gone, and how different their lives must have been. What would they think if they saw the barren desert now?

The first humans to live in the cave arrived about 10,000 years ago. Permanent settlements appeared around 8,300 years ago with dairy cattle arriving 800 years later. By 6,000 years ago the site was used for brief visits by herders of goats and sheep during the winter.

From the paper:

The first inhabitants at Takarkori rock shelter were early Holocene hunter-gatherer-fishers locally called “Late Acacus” (LA1-3: ca. 10,200–8000 cal BP). Archaeological and archaeobotanical evidence indicates prolonged, albeit seasonal, residential occupation and a delayed-return system of resource exploitation [13, 33, 34, 35].

Stone structures of different size and functions (huts, windbreaks, platforms, etc.) and large fireplaces, together with large grinding stones and abundant pottery also point to semi-sedentary lifestyle, as indicated by other coeval sites in the region, such as Ti-n-Torha East, Uan Afuda and Uan Tabu [7, 36, 37]. The earliest evidence of Pastoral Neolithic herders (EP1-2) dates to ca. 8300 cal BP, mostly represented by the burial of women and children [38].

A full pastoral economy based on cattle exploitation including dairying is attested from approximately 7100 years cal BP [39], when the shelter is occupied seasonally (MP1-2), likely from the end of the rainy season and during the dry winter [13, 40]).

Nomadic herders (LP1, ca. 5900–4650 years cal BP), mostly focussing on small livestock (sheep/goat) rather than cattle, briefly camped at Takarkori during the winter, using much part of the area for penning the animals, with a thick, hardened layer of ovicaprine dung closing the sequence

The current Sahara desert

Just to remind us of how incredibly vast it is:

The press release:

Fish in the Sahara? Yes, in the early Holocene

ScienceDaily, February 2020

Catfish and tilapia make up many of the animal remains uncovered in the Saharan environment of the Takarkori rock shelter in southwestern Libya, according to a study published February 19, 2020 in the open-access journal PLOS ONE by Wim Van Neer from the the Natural History Museum in Belgium, Belgium and Savino di Lernia, Sapienza University of Rome, Italy, and colleagues.

Today, the Saharan Tadrart Acacus mountains are windy, hot, and hyperarid; however, the fossil record shows that for much of the early and middle Holocene (10,200 to 4650 years BP), this region was humid and rich in water as well as life, with evidence of multiple human settlements and diverse fauna.

Rock shelters within the Tadrart Acacus preserve not only significant floral and faunal remains, but also significant cultural artifacts and rock art due to early Holocene occupation of these shelters. In this study, the authors worked with the Libyan Department of Antiquities in excavating parts of the Takarkori rock shelter to identify and date animal remains found at this site and investigate shifts in the abundance and type of these animal remains over time.

Fish remains made up almost 80 percent of the entire find overall, which numbered 17,551 faunal remains total (19 percent of these were mammal remains, with bird, reptile, mollusc, and amphibian remains the last 1.3 percent). All of the fish and most of the other remains were determined to be human food refuse, due to cut marks and traces of burning — the two fish genera at Takarkori were identified as catfish and tilapia.

Based on the relative dates for these remains, the amount of fish decreased over time (from 90 percent of all remains 10,200-8000 years BP versus only 40 percent of all remains 5900-4650 years BP) as the number of mammal remains increased, suggesting the inhabitants of Takarkori gradually focused more on hunting/livestock. The authors also found the proportion of tilapia specifically decreased more significantly over time, which may have been because catfish have accessory breathing organs allowing them to breathe air and survive in shallow, high-temperature waters — further evidence that this now-desert environment became less favorable to fish as the aridity increased.

The authors add: “This study reveals the ancient hydrographic network of the Sahara and its interconnection with the Nile, providing crucial information on the dramatic climate changes that led to the formation of the largest hot desert in the world. Takarkori rock shelter has once again proved to be a real treasure for African archaeology and beyond: a fundamental place to reconstruct the complex dynamics between ancient human groups and their environment in a changing climate.

REFERENCE

“Wim Van Neer, Francesca Alhaique, Wim Wouters, Katrien Dierickx, Monica Gala, Quentin Goffette, Guido S. Mariani, Andrea Zerboni, Savino di Lernia. Aquatic fauna from the Takarkori rock shelter reveals the Holocene central Saharan climate and palaeohydrography. PLOS ONE, 2020; 15 (2): e0228588 DOI: 10.1371/journal.pone.0228588

More Horror Pictures Emerge Showing Locations of  Met Office “Extreme” Record Temperatures

These days the Met Office has rebadged its daily “high” temperatures as “extreme”, all the better of course to ramp up fears of heat as part of the Net Zero education process. Last Wednesday’s “extreme” of 20.4°C was recorded at Teddington Bushy Park. As the Google Earth photo below shows, the “extreme” temperature is helped on its way by an adjacent high wall reflecting heat onto the measuring device and a large housing development warming the nearby area.

From The Daily Sceptic

By Chris Morrison

These days the Met Office has rebadged its daily “high” temperatures as “extreme”, all the better of course to ramp up fears of heat as part of the Net Zero education process. Last Wednesday’s “extreme” of 20.4°C was recorded at Teddington Bushy Park. As the Google Earth photo below shows, the “extreme” temperature is helped on its way by an adjacent high wall reflecting heat onto the measuring device and a large housing development warming the nearby area. Teddington Bushy Park is a junk class 4 station with internationally-recognised “uncertainties” of 2°C. Joke class 4 station might be a more apt description. How anyone can think information taken at this site is suitable for scientific work that ultimately produces a global mean temperature is a mystery.

Under a classification system set by the World Meteorological Organisation (WMO) that takes account of temperature corruptions, natural and unnatural, 77.9% of Met Office sites are rated class 4 and 5 and have uncertainties of 2°C and 5°C respectively. The Met Office does its best to explain away the poor siting of most of its UK-wide 380-strong temperature station network. Class 3 – uncertainties of 1°C – and class 4 are said to produce “valid high-quality data”, something that might be in dispute by looking at the Teddington photo. The WMO is said by the Met Office not to preclude the use of data from super junk class 5. For its part, the WMO states that a class 5 is “where nearby obstacles create an inappropriate environment for a meteorological measurement that is intended to be representative of a wider area”. Nearly one in three (29.2%) of the Met Office’s sites are rated super-junk 5 and from this, apparently, the Met Office can produce average temperature figures to one hundredth of a degree centigrade.

Earlier this year, a freedom of information request from the Daily Sceptic finally revealed what has been suspected for a long time, namely that the Met Office temperature measuring system is not fit for the purpose of providing accurate measurements of temperature either at specific local sites or at national and global average scale. To date, the Met Office has not made an official statement on the growing concerns that surround its scientific work following the startling revelations. It does however produce an occasional remark that suggests it is hiding from the implications of the growing criticism. Last June it declared the highest, pardon, the most extreme temperature so far of the summer at Chertsey, another ‘record’ that came under question when it was revealed that the measuring device at Chertsey water pumping station was surrounded by a newly-built solar farm.

This is the solar farm in question and it surrounds what appears to be the temperature measuring station. To be fair to the Met Office, Google Maps puts the station a few yards away – there are sometimes small errors in precise placing of any location. But what is not disputed is that the site is next to a large solar farm with over 1,800 panels. Solar panels generate large amounts of heat in the nearby areas with scientists suggesting warming of 3-4°C. Citizen journalist Ray Sanders recently tackled the Met Office on the Chertsey location and the state-funded weather service admitted it was “aware” of the solar panels near its station. “The temperature measurements meet standards for publication and scientific use,” noted the Met Office.

Over in the United States, meteorologist Anthony Watts has spent decades investigating the temperature output of the local weather service NOAA. He recently presented evidence to show that NOAA’s temperature data was “fatally flawed” with an astonishing 96% of 4,000 plus measuring stations corrupted by poor placement. As in the U.K., many photos of unsuitable locations have been published. The one below from a site in Florida showing measurements taken near a bank of air conditioning units is a particular horror show.

Appearing on a recent Tom Nelson podcast, Watts was asked about the 40.3°C runway record temperature declared for 60 seconds on July 19th 2022 as jets were landing at RAF Coningsby in the U.K. He pointed out that such events were caused by new electronic measurements that reacted to temperature change within one tenth of a second. The previous mercury thermometers took much longer to move and would never have picked up temporary temperature movements caused by gusts of wind or passing jet aircraft.

All of these figures are collected and then adjusted and the “bottom line” is that the data have been changed to increase the warming trend. A number of attempts have been made to estimate the changes caused by numerous corruptions. “We have about 50% less global warming than the media and activists would have you believe”, Watts suggests.

Chris Morrison is the Daily Sceptic’s Environment Editor. The image at the top of this article shows the location of the Met Office temperature station at Aberdeen Dyce International Airport. No further comment required!