No, Mainstream Media, Climate Change Didn’t Cause a ‘Landslide’ and ‘Mega-Tsunami’

On September 13th, National Public Radio (NPR) published an article, titled “A landslide linked to climate change ‘rang’ the Earth for 9 days, researchers say.” Other media outlets chimed in with headlines similar to the The Guardian’s, “Entire Earth vibrated for nine days after climate-triggered mega-tsunami.” While the part about seismic activity being detected worldwide for 9 days is true, the attempt to link the landslide to climate change is false and easily refuted by anyone who checks history.

From ClimateRealism

By Anthony Watts

On September 13th, National Public Radio (NPR) published an article, titled “A landslide linked to climate change ‘rang’ the Earth for 9 days, researchers say.” Other media outlets chimed in with headlines similar to the The Guardian’s, “Entire Earth vibrated for nine days after climate-triggered mega-tsunami.” While the part about seismic activity being detected worldwide for 9 days is true, the attempt to link the landslide to climate change is false and easily refuted by anyone who checks history.

“A landslide and mega-tsunami in Greenland in September 2023, triggered by the climate crisis, caused the entire Earth to vibrate for nine days, a scientific investigation has found,” The Guardian wrote.

While NPR said:

The signal was traced to a massive avalanche along the Dickson fjord in eastern Greenland, triggered by glacial melting due to climate change, according to research that Svennevig and nearly 70 co-authors published in the journal Science.

Some 1.2 kilometers (3/4 of a mile) above the remote fjord, a mountaintop collapsed, driving more than 25 million cubic meters of rock and ice into the water. The volume of material was enough to fill 10,000 Olympic-sized swimming pools, the researchers say.

The tsunami in question was towering: 200 meters — 656 feet — in height, according to the researchers. Because the wave’s energy was trapped in a rocky fjord, the water sloshed back and forth in a phenomenon called a seiche — and the scientists traced the seismic signal that was detected on sensors from the Arctic to Antarctica to that pattern.

Facts rebut the scientists’ assertion that the avalanche was tied to climate change, for example:

  1. Glaciers, melt, calve, and make local tsunamis. It’s what they do and have been doing for millennia. Same for rockslides. Nothing new here. No climate change is needed.
  2. Seismic waves from glacier calving are nothing new, in fact in Antarctica they happen “all the time” according to the University of Leeds. At best, this is a novelty because the signal lasted nine days.
  3. The press release from the University of San Diego that sparked this story and many others, was embellished to play up the drama and alarm and play down the science. Linking the event to climate change in the press release is highly misleading, especially since no mechanism was proposed other than glacier melting, which happens every summer. They also made use of the phrase “mega-tsunami” for dramatic effect.
  4. The “mega-Tsunami” and seiche (with continued seismic waves) only occurred because the narrow fiord meant the kinetic energy had no place to go. If it were calving to the open ocean, it would have just been another normal blip on the seismic radar.
  5. And finally, the most important point, mega-tsunamis are nothing new. They have occurred throughout recorded history. Wikipedia lists a number of examples:

Examples of modern mega-tsunamis include the one associated with the 1883 eruption of Krakatoa (volcanic eruption), the 1958 Lituya Bay megatsunami (a landslide which caused an initial wave of 524 metres (1,719 ft)), and the Vajont Dam landslide (caused by human activity destabilizing sides of valley). Prehistoric examples include the Storegga Slide (landslide), and the Chicxulub, Chesapeake Bay, and Eltanin meteor impacts.

Earthquakes and volcanic eruptions are the most common causes of mega-tsunamis triggered by landslides. Of course, receding ice and snow that no longer supports a rock face can also cause a landslide, as was the case here. But how can the researchers be sure that climate change is to blame? Normal short time-scale weather events can also cause landslides. The United States Geological Survey lists these common causes for landslides:

Landslides can be initiated in slopes already on the verge of movement by rainfall, snowmelt, changes in water level, stream erosion, changes in ground water, earthquakes, volcanic activity, disturbance by human activities, or any combination of these factors.

Climate change isn’t listed.

It isn’t listed, because there’s no connection to landslides whatsoever. In the U.N. Intergovernmental Panel on Climate Change’s (IPCC) most recent scientific assessment they report finding no emerging signal linking climate change to landslides, nor do they anticipate any emergence in the future.

Below is Table 12.12 from Page 90 – Chapter 12 of the UN IPCC Sixth Assessment Report. Emergence of Climate Impact Drivers (CIDs) in time periods. The color corresponds to the confidence of the region with the highest confidence: white colors indicate where evidence of a climate change signal is lacking or the signal is not present, leading to overall low confidence of an emerging signal.

The scientists’ assertion that the recent landslide in Greenland was caused by climate change has no evidence supporting it.

Sadly, the mainstream media pounced on this highly embellished press release because it contained exciting claims that fit the climate catastrophe narrative that they seem wedded to, facts be damned. In their rush to publication, they didn’t perform due diligence to determine if the climate connection claim had any merit, they just regurgitated the claims as if they were fact.

Such is the sad state of our mainstream media today.

Banana waste for synfuels has an increasing appeal

Scientists from the United Kingdom’s Northumbria University (located in historic Newcastle, once the center of the British coal industry) and their partners in Pakistan are converting banana waste into eco-friendly textiles and clean energy, according to Shubhangi Dua, writing in Interesting Engineering.

From CFACT

By Duggan Flanakin

Scientists from the United Kingdom’s Northumbria University (located in historic Newcastle, once the center of the British coal industry) and their partners in Pakistan are converting banana waste into eco-friendly textiles and clean energy, according to Shubhangi Dua, writing in Interesting Engineering.

According to the report, banana farming in Pakistan creates 80 million tons of agricultural waste that can be converted into 57,488 million cubic meters of syngas – enough to deliver clean electricity to half of rural Pakistan. The SAFER project, which seeks to improve access to sustainable energy in rural Pakistan using food and fiber agro-waste, has been awarded a £300,000 grant (about U$396,000) from Innovate UK to develop the waste-to-energy tech.

According to Dr. Jibran Khaliq, a materials scientist from Northumbria’s department of mechanical and construction engineering, Pakistan’s textile sector has been responsible for significant environmental impacts, including greenhouse gas emissions, water pollution, and microplastics. But, he says, “Our partners at the National Textile University in Faisalabad have developed a technology to convert banana agro waste into textile fibers.”

The problem with implementing this technology is “the lack of electricity in rural Sindh where the majority of bananas are grown,” which “has prevented this innovation from being scaled up until now.” The grant money will enable Dr. Khaliq’s team to develop a new waste-to-energy technology that will convert the banana waste into clean, affordable energy.

Dr. Muhammad Saghir, Director at Eco Research Ltd., says that, “This innovative approach will not only transform agricultural byproducts into sustainable textiles but also exemplifies a remarkable synergy between eco-conscious practices and technological advancements leading to local job creation.” An added benefit is that the process even produces biofertilizers that will boost soil health and food production.

Why is this development such a big deal?

With a 2024 projected production of 215,000 metric tons of bananas, less than 0.02 percent of the total world production in 2022 of 135 million metric tons, Pakistan is a far cry from ever becoming a major banana producer. Yet that tiny production generates, we are told, 80 million tons of waste.

Worldwide production of bananas was just 22 million metric tons in 1961 and only 66 million tonnes in 2000. Yet today electricity-poor India alone produces 35 million metric tons of bananas – and untold tonnages of banana waste. [Banana plants bear fruit only once in their lifetime.]

Other major banana producers include Brazil, Nigeria, the Philippines, Indonesia, Kenya, Burundi, Egypt, Rwanda, Tanzania, Vietnam, Ethiopia, Papua New Guinea, Thailand, Angola, and a host of Central American nations, as well as China. The leading producers of plantains and cooking bananas, which produce similar waste levels, include Uganda, the Democratic Republic of the Congo, Ghana, Cameroon, and Cote d’Ivoire, along with several other nations, many of which also generate only tiny amounts of electricity today.
The concept of using banana waste for generating electricity is not new. In a 2010 paper, “Banana biomass as potential renewable energy resource,” lead author Uing Yan Tock reported on a Malaysian case study that chose the banana plant as a biomass source because of its availability, high growth rates, carbon neutrality, and the fact that it bears fruit only once.

Yan Tock said that conversion of banana biomass to energy can be done via combustion, supercritical water gasification, and digestion to produce thermal energy and biogas. The theoretical power generation calculated reached a maximum of 950 megawatts, which would meet more than half of the renewable energy requirement of Malaysia’s Fifth Fuel Policy.

There are only two primary methods for converting biomass into energy: gasification (as with the Pakistan effort) and pyrolysis. Gasification heats solid or liquid biomass to about 1,800o F to produce the biofuel syngas and biochar solids, which also have agricultural applications. In flash pyrolysis, the biomass is heated only to 1,100o F at pressures up to 5 bar in an inert atmosphere.

In a 2022 paper, lead author Wanderson O. Silva of Switzerland’s École Polytechnique Fedérale de Lausanne describes a new biomass method that produces syngas and biochar using flashlight pyrolysis – a significant advance in renewable energy technology. The method uses a Xenon lamp to trigger photothermal reactions in biomass materials like banana peels and coffee beans.

In another 2022 article, lead author Ashish N. Sawarkar of the Motilal Nehru National Institute of Technology in India stated that various types of banana waste generated after banana crop cultivation have tremendous potential for bioethanol production. He added that the number of publications focusing on banana waste-to-energy had increased from just seven prior to the 2010 Malaysia study to 177 in 2021.

With world energy needs expected to double in the next decades, and with many banana-producing nations woefully short in electricity availability, these developments in bananas to energy may soon become a rapidly growing industry.

At the virtual outset of bananas to energy research (the 2010 Malaysian study), scientists admitted there were “issues” involved in recovering the feedstock, storage problems, and financial and technical challenges to be solved before banana crop residue could provide a major source of energy for energy-starved nations.

The latest research suggests that many of these hurdles are being overcome, but until banana waste to energy can be proven to be a cost-effective alternative to other renewables or even to abundant fossil fuels, most of that waste will continue to pile up.

Yet one thing is certain. The idea of banana waste to energy has an increasing appeal.

2024 Arctic Ice Abounds at Average Daily Minimum

2024 extent of 4.58 is 1.3% over average, mainly due to surpluses in Chukchi and East Siberian seas.

From Science Matters

By Ron Clutz

The annual competition between ice and water in the Arctic ocean has reached the maximum for water, which typically occurs mid September.  After that, diminishing energy from the slowly setting sun allows oceanic cooling causing ice to regenerate. Those interested in the dynamics of Arctic sea ice can read numerous posts here.  This post provides a look at mid September from 2007 to yesterday as a context for understanding this year’s annual minimum.

The image above shows Arctic ice extents on day 260 (lowest annual daily extent on average) from 2007 to 2024 yesterday.  Obviously, the regions vary as locations for ice, discussed in more detail later on. The animation shows the ice deficits in years 2007, 2012, 2016, and 2020, as well as surplus years like 2010, 2014, 2022 and 2024.

Note that for climate purposes the annual minimum is measured by the September monthly average ice extent, since the daily extents vary and will go briefly lowest on or about day 260. In a typical year the overall ice extent will end September slightly higher than at the beginning.  2024 September ice extent averaged 4.6M over the first 16 days, and is likely to end the month with at least that amount for the entire month. For comparison, the 17 year average for Sept. 1-16 is 4.7M.

The melting season to mid September shows 2024 tracked lower than average but ended the period slightly above.

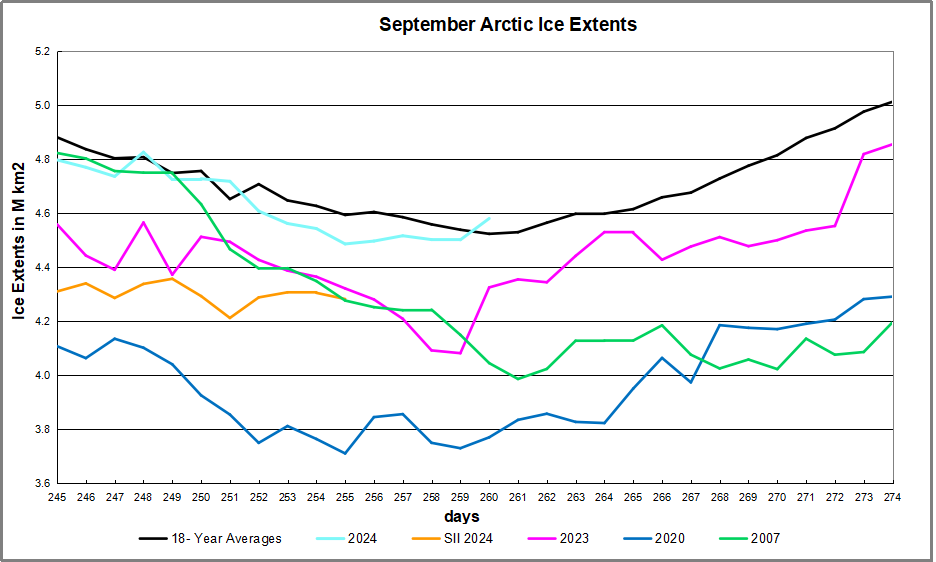
The graph above shows September daily ice extents for 2024 compared to 18 year averages, and some years of note. Day 260 has been the lowest daily ice extent on average for the last 18 years.

The black line shows on average Arctic ice extents during September decline 358k km2 down to 4.5M Km2 by day 260. The average increase from now on is 490k km2 up to 5.0M km2 end of September.  2024  tracked a little lower than the 18-year average in the second week reaching a low of 4.49M km2 on day 255, before going above average on day 260.

SII was reporting deficits as high as 0.5M km2 (half a Wadham) compared to  MASIE early in September.  For some reason, apparently data access issues, that dataset has not been updated for the last five days.  2023 bottomed out at 4.1M while 2007 daily minimum hit 4.0M, ended ~ 0.5M km2 in deficit to average and 535k km2 less than MASIE on day 260.  2020 ice on day 260 was ~740k km2 in deficit to average.

The main deficit to average is in CAA with a smaller loss in Chukchi, overcome by surpluses almost everywhere, especially in Central Arctic along with Laptev and Greenland seas. And as discussed below, the marginal basins have little ice left to lose.

The Bigger Picture 

We are close to the annual Arctic ice extent minimum, which typically occurs on or about day 260 (mid September). Some take any year’s slightly lower minimum as proof that Arctic ice is dying, but the image above shows the Arctic heart is beating clear and strong.

Over this decade, the Arctic ice minimum has not declined, but since 2007 looks like fluctuations around a plateau. By mid-September, all the peripheral seas have turned to water, and the residual ice shows up in a few places. The table below indicates where we can expect to find ice this September. Numbers are area units of Mkm2 (millions of square kilometers).

Day 26017 year
Arctic Regions200720102014201620182020202120222023Average2024
Central Arctic Sea2.673.162.982.922.912.502.953.082.962.922.95
BCE0.501.081.380.521.160.651.550.990.500.881.02
LKB0.290.240.190.280.020.000.130.200.390.180.16
Greenland & CAA0.560.410.550.450.410.590.500.430.440.470.39
B&H Bays0.030.030.020.030.050.020.040.020.040.040.05
NH Total4.054.915.134.204.563.765.174.734.334.494.58

The table includes some early years of note along with the last 4 years compared to the 17 year average for five contiguous arctic regions. BCE (Beaufort, Chukchi and East Siberian) on the Asian side are quite variable as the largest source of ice other than the Central Arctic itself.   Greenland Sea and CAA (Canadian Arctic Archipelago) together hold almost 0.5M km2 of ice at annual minimum, fairly consistently.  LKB are the European seas of Laptev, Kara and Barents, a smaller source of ice, but a difference maker some years, as Laptev was in 2016 and 2023.  Baffin and Hudson Bays are inconsequential as of day 260.

2024 extent of 4.58 is 1.3% over average, mainly due to surpluses in Chukchi and East Siberian seas.

For context, note that the average maximum has been 15M, so on average the extent shrinks to 30% of the March high (31% in 2022) before growing back the following winter.  In this context, it is foolhardy to project any summer minimum forward to proclaim the end of Arctic ice.

Resources:  Climate Compilation II Arctic Sea Ice

Heat Pump Subsidies: Never Enough

The upshot is that despite Federal rebates of up to $8,000 per the “Inflation Reduction Act,” real-world economics of electric heat pumps are dismal.  Several commenters to the second article aptly summarized why from a consumer perspective.

From Master Resource

By Mark Krebs

“The Competitive Enterprise Institute is leading a coalition of free market advocates attempting to organize support to stop the IRA’s obscene and consumer abusive funding. In response, the Biden (mis)Administration is attempting to shovel IRA funding out the door as fast as it can to contractually shield it.”

Early this month, Lucas Davis, a Professor in Business and Technology at the Haas School of Business, University of California, Berkeley, published an article titled: How Do We Pump Up the Impact of Heat Pump Subsidies? In April, Professor Davis published a precursor article titled: Why Are Heat Pump Sales Decreasing?

The upshot is that despite Federal rebates of up to $8,000 per the “Inflation Reduction Act,” real-world economics of electric heat pumps are dismal.  Several commenters to the second article aptly summarized why from a consumer perspective.

Case Study One

As the owner of a 30-year-old gas furnace, I was in the market for a heat pump during all of 2023. As a low-income retiree, I also looked forward to an $8,000 subsidy from the Inflation Reduction Act passed in November of 2022. Well, as readers of this blog probably know already, the IRA subsidies did not take effect in 2023 (and are now projected to be available in California no sooner than late summer 2024).

I had gotten a bid in the summer of 2022 of $25,000 for a heat pump, but I was waiting for the IRA subsidy to take effect. Then I discovered that the bidder had failed to mention that installing a heat pump would also require new ductwork because the existing ducts were too small to handle the larger air volumes required by a heat pump. Two subsequent bids in mid- and late-2023 ranged from $30K to $40K when ductwork was included.

So when the furnace failed in December 2023 at age 31, I had to make a quick choice: a replacement gas furnace (costing $12K with an 18-month 0% loan, and a 2-day wait for installation), or $30K+ for a heat pump with a couple month wait for installation. The estimated fuel savings from the heat pump worked out to under $1000 per year, not even close to enough to outweigh the $18K capital cost differential. The fact that the estimated life for the heat pump was 15 years, versus 30 years for the gas furnace, didn’t help at all.

So there’s my anecdotal story: it wasn’t interest rates, it wasn’t tax law, it largely wasn’t fuel prices, it was mostly capital costs. Had the original bid of $25K been legit and had the $8K subsidy been available by mid-2023, I would have chosen the $17K heat pump over the $12K furnace based on environmental concerns. But at $30K versus $12K, I didn’t.

Case Study Two

I also got pricing for a 6 head mini-split heat exchange system that would be mounted in each room, and it came to $26,000 for the two pumps and 6 heads wired, installed and tested. Pricing is important.

Yes, pricing (meaning total installed cost) is important.  Total installed costs for heat pumps (as evidenced by the above commenters) can include expensive retrofit expenses that normally are avoided when not switching from a traditional gas furnace to an electric heat pump. And heaven forbid something like a motherboard failure out of warranty (that tend to be much shorter than furnace warranties).

Alas, however, our Federal energy efficiency “experts” are also making sure that traditional/inexpensive (non-condensing gas furnaces are going to soon be illegal as a result of their abuse of regulatory authority regarding minimum appliance efficiency standards under the Energy Policy and Conservation Act of 1975 ( EPCA)  in  response to the “1973 oil crisis by creating a comprehensive approach to federal energy policy.”

The American Public Gas Association (APGA) explains:

The Office of Energy Efficiency and Renewable Energy (EERE) within DOE issued a notice of proposed rulemaking establishing a new 95% annual fuel utilization efficiency (AFUE) standard for furnaces. This proposed standard can only be met by condensing furnaces, effectively banning non-condensing furnaces that have been in millions of American homes for a generation or more.

“But wait, there’s more” (in the immortal words of Ron Popeil). EPCA also states that DOE can include “any such other factors as the Administrator deems appropriate.”   The social cost of carbon SCC is a prime example of how DOE is using this nebulous authority to impose carbon reduction benefits within its cost/benefit analyses.  The Competitive Enterprise Institute’s (CEI), Ben Lieberman, explains SCC:

Junk Science Behind Federal Appliance Regs About to Get Junkier

The Biden-Harris administration has embarked on a wave of anti-consumer home appliance regulations over the last several years. Each was justified in part by overblown claims of climate change benefits. And now, the Department of Energy (DOE) has proposed using a new methodology that would further inflate these hypothetical benefits to justify even worse regulations in the years ahead.

DOE is in the process of creating new energy use limits for stoves, dishwashers, furnaces,  washing machines, water heaters, ceiling fans, refrigerators, and more. The agency always asserts that consumers experience net gains from these regulations, but CEI has filed comments highly critical of these rosy assumptions. In reality, such rules often raise the up-front costs of appliances more than is likely to be earned back in the form of energy savings. Some rules also compromise appliance choice, performance, and reliability.

But DOE’s fictitious consumer benefits are only part of the problem. CEI has also taken issue with the agency’s assertions that these regulations deliver quantifiable climate change benefits. For example, DOE’s costly 2023 final rule for residential furnaces was estimated by the agency to provide $16.2 billion worth of such benefits.

The agency arrives at this figure by calculating the reduced energy use attributable to the efficiency standards and then estimating the amount of greenhouse gas emissions avoided as a result – mostly carbon dioxide emitted to produce electricity at coal or natural gas-fired power plants. Then it multiplies the tons of emissions avoided by the calculated per unit dollar cost to society of such emissions.

Until now, DOE has relied upon the 2021 Interagency Working Group on the Social Cost of Greenhouse Gases (IWG 2021). IWG 2021 provides the agency with the per ton Social Cost of Greenhouse Gases (SC-GHG) values.

Relying on IWG 2021 was bad enough, but in its most recent proposed rule for commercial refrigeration equipment DOE is switching to an updated 2023 version of SC-GHG provided by the Environmental Protection Agency.

The new methodology takes several already-dubious assumptions in IWG 2021 and stretches them further. For one category of commercial refrigeration equipment covered in the proposed rule, DOE calculates the climate benefits of $48-$320 million dollars under IWG 2021 but a whopping $564-$1,713 million under the new way. That’s around 5-10 times higher.

More Concerns

In May of 2022, I wrote an article published in Real Clear Energy titled Fallacies of Supplying American LNG and Electric Heat Pumps to Europe to Fight Putin and Global Warming. Primarily, it summarized the flawed “energy efficiency” physics behind this Biden administration plan that has since been regurgitated in the so-called Inflation Reduction Act a few months later.  This article, which I stand by, received 189 comments.

This leads to my overarching concern:  What is the fundamental motive behind all of this.  It is:

  1. Globalized social control through the establishment of an all-electric energy monoculture.
  2. The transformation and growth of energy efficiency regulations into carbon efficiency regulations.

The following graphic cogently illustrates:

“Transitioning” energy efficiency to carbon efficiency grows the regulation business

Source: “Electrification – What Does It Mean for Energy Efficiency?”

In short: DOE and its minions are running out of stuff to regulate under existing energy efficiency statutes within EPCA. A move to carbon efficiency regulation vastly expands their regulatory empire. The IRA is providing obscene amounts of taxpayer funding to force-feed this anti-consumer agenda.  For more information, see Dangerous ‘Deep Decarbonization’ (Krebs PowerPoint to Cooler Heads Coalition). For the record, that presentation identified the $8,000 heat pump tax credit stated at the beginning of this article.

As Travis Fisher testified before the House Energy & Commerce Subcommittee on Energy, Climate, and Grid Security on September 11th, “ The subsidies in the IRA for wind, solar, and batteries alone could cost American taxpayers $3 trillion by 2050.” Fisher also testified: “Between the IRA subsidies and the EPA rules, I would summarize the administration’s power grid policy as this: Green the grid and brace for blackouts.”

The Competitive Enterprise Institute is leading a coalition of free market advocates attempting to organize support to stop the IRA’s obscene and consumer abusive funding. In response, the Biden (mis)Administration is attempting to shovel IRA funding out the door as fast as it can to contractually shield it.  For further information, see Inflation Reduction Act Two Year Anniversary Letter.

——————–

Mark Krebs, a mechanical engineer and energy policy consultant, has been involved with energy efficiency design and program evaluation for over thirty years. Mark has served as an expert witness in dozens of State energy efficiency proceedings, has been an advisor to DOE and has submitted scores of Federal energy-efficiency filings. His many MasterResource posts on natural gas vs. electricity and “Deep Decarbonization” federal policy can be found here. Mark’s first article was in Public Utilities Fortnightly, titled “It’s a War Out There: A Gas Man Questions Electric Efficiency” (December 1996). Recently retired from Spire Inc., Krebs has formed an energy policy consultancy (Gas Analytic & Advocacy Services) with other veteran energy analysts.

The problem with Labour’s green energy plan-Ross Clark

On the day that Labour’s poll rating dips below 30% in record time after an election win, we are reminded of two good reasons why.

From NOT A LOT OF PEOPLE KNOW THAT

By Paul Homewood

h/t Philip Bratby

On the day that Labour’s poll rating dips below 30% in record time after an election win, we are reminded of two good reasons why.

Ed Miliband told the EnergyUK conference this morning that he wants to take on the ‘blockers, delayers and obstructionists’ who stand in the way of Britain’s energy security. Oh good, does that mean that finally he appreciates that the North Sea needs some encouragement? And that a UK fracking industry will finally be allowed to commence, after years of being blocked in the courts by environmentalists spinning false stories about how it will cause your water taps to burst into flames and cause devastating earthquakes (including those actually felt at the Earth’s surface)?

Er, sadly not. Miliband, of course, rather likes blockers and delayers when they are on his side. Indeed, the entire government does, which is why it is not challenging the High Court’s decision last week to quash planning permission for a Cumbrian coal mine. This mine would have provided coking coal for the UK’s steel industry (or at least would have done before the previous government pulled the plug on Britain’s primary steel industry, forcing us to import steel instead).

Is Lammy’s mind really on his job?

Stand in the way of oil and gas – which even the Labour party manifesto accepted is going to form part of our energy mix for decades to come – and the government will won’t lift a finger to stop you. But as for people who are a little reluctant to accept vast acres of the countryside disappearing beneath wind and solar farms, they are a threat to Britain’s energy security – and indeed ‘national security’ – and must be denounced.

Miliband isn’t alone in taking up this theme of national security to try to defend Labour’s green policy. Foreign secretary David Lammy is at it too this morning, telling us that climate change presents a ‘more fundamental’ threat to national security than terrorism does.

Is Lammy’s mind really on his job? Sure, there are all sorts of reasons why it might be desirable to shift towards cleaner energy if it is affordable. But does he seriously think that climate change deserves more of his attention as foreign secretary than the threat from terrorism? London might be a bit warmer than it was half a century ago, and a little wetter, too, while sea levels might be rising by 3 mm a year (the capital is also a little less stormy, less foggy and its population a lot less prone to hypothermia than in the past, though we rarely hear about that side of the climate change ledger). But David, what I would really love to know is what you are doing to guard against the very real possibility that a bunch of terrorists could get hold of nuclear material and explode a ‘dirty bomb’ in Trafalgar Square? Or a 9/11 style attack on Canary Wharf?

That is before we even get into the matter of what a rogue state could do to us, with the full backing of armed forces. I know there are a lot of young people who have grown up on climate paranoia and have been really quite traumatised by what they see as the threat of being ‘fried’ by slightly higher summer temperatures. But those of us who were brought up in the Cold War have a slightly different perspective: by far the greatest threat to humanity continues to be nuclear war – which really would lead to large numbers of people genuinely being fried, and to somewhat rapid and dramatic climate change.

I hope, deep down, that our foreign secretary appreciates this, and that his comments this morning are just a bit of politicking to try and defend a green energy policy which is beginning to crumble in the face of reality. The trouble is that, with Lammy, I feel we can never be quite sure.  

https://www.spectator.co.uk/article/the-problem-with-labours-energy-policy

More than 1,400 electric Mini Coopers recalled over major fire risk

More than 1400 luxury electric vehicles are being recalled in Australia amid warnings their batteries could short circuit and catch fire while being driven.

From The Driven

By Jennifer Dudley-Nicholson

More than 1400 luxury electric vehicles are being recalled in Australia amid warnings their batteries could short circuit and catch fire while being driven.

The federal transport department issued the recall on Tuesday for Mini Cooper SE electric cars sold in Australia between 2020 and 2023.

The warning follows a recall of more than 140,000 Mini Cooper vehicles issued by manufacturer BMW worldwide earlier this month.

The transport department warned the software defect that affected 1408 cars in Australia had the potential to “increase the risk of serious injury or death to vehicle occupants”.

“The high-voltage battery management software has insufficient protections for short circuit events,” it said.

“As a result, if a short circuit occurs it could lead to a vehicle fire whilst driving or parked.”

The faulty software could be remedied with a software update and owners should contact a local Mini dealer urgently to have it installed, the transport department said.

The Australian recall comes two weeks after BMW recalled more than 140,000 electric Mini Cooper vehicles worldwide, including 39,000 in Germany and more than 12,000 in the United States.

“A vehicle fire, even when the vehicle is parked, cannot be ruled out,” the company said in a statement.

Despite concerns about electric vehicle safety, Australia has recorded only six electric car fires since 2010, according to EV FireSafe, including one case of arson, two collisions, and three parked near a blaze.

EXCLUSIVE: Met Office in Denial as It Rates Almost all its Temperature Stations as ‘Excellent’, ‘Good’ or ‘Satisfactory’

Further alarming disclosures have come to light about the Met Office’s U.K. temperature measuring network following a recent freedom of information (FOI) request seeking details of its internal rating system for its 383 station-strong operation. Denial is the word that springs immediately to mind. According to World Meteorological Organisation (WMO) international standards, almost eight in 10 Met Office stations are in junk Class 4 and super junk Class 5 with possible errors of 2°C and 5°C respectively. But it turns out that over nine in 10 stations are internally rated by the Met Office as ‘Excellent, ‘Good’ and ‘Satisfactory’. Just 27 stations are considered ‘Unsatisfactory’.

From The Daily Sceptic

By Chris Morrison

Further alarming disclosures have come to light about the Met Office’s U.K. temperature measuring network following a recent freedom of information (FOI) request seeking details of its internal rating system for its 383 station-strong operation. Denial is the word that springs immediately to mind. According to World Meteorological Organisation (WMO) international standards, almost eight in 10 Met Office stations are in junk Class 4 and super junk Class 5 with possible errors of 2°C and 5°C respectively. But it turns out that over nine in 10 stations are internally rated by the Met Office as ‘Excellent, ‘Good’ and ‘Satisfactory’. Just 27 stations are considered ‘Unsatisfactory’.

It might be hoped that the Met Office is rushing to upgrade these unsatisfactory stations not least because they produce numerous ‘record’ highs, or ‘extremes’ as they are now termed, that litter the database. It is not a good look to be caught promoting all-time ‘extremes’ from recordings that you consider internally to be unsatisfactory. Nevertheless, two of the four national temperatures records were produced by this small band of unsatisfactory stations – on July 18th, 2020, Hawarden Airport in Wales recorded 37.1°C, while on July 21st, 2021 a temperature was recorded of 31.3°C in Castlederg, Northern Ireland.

The WMO applies strict standards on temperature stations and rates them from Class 1-5. Corruptions of natural air temperature from any source determine a rating. Class 1 and 2 are pristine, Class 3 has ‘uncertainties’ of 1°C followed by classes 4 and 5. Super junk 5 has no requirements for siting, meaning it can be based anywhere. Let us refresh our memories of how the Met Office sites rate under rigorous WMO standards.

Now look what happens when the Met Office marks its own homework.

According to information released under an FOI request to the investigative journalist Paul Homewood, the Met Office will only quote records from WMO Classes 1-4. Also known as CIMO ratings, the Met Office states categorically that the records “must” be between 1 and 4. “CIMO 5 will mean data from the site will be flagged and not quoted in national records,” adds the Met Office.

Presumably the instruction is not fully understood across the entire organisation. For instance, in a week analysed last June by the Daily Sceptic the Scottish Class 5 station Leuchars provided an area ‘extreme’ on four out of the seven days examined. In England, the Class 5 station at Killowen also featured four times, while Usk No.2 and Durham made the top spot on three occasions. From the Met Office’s own tiny ‘Unsatisfactory’ list we get Kinlochewe, which provided the highest January temperature ever recorded in Scotland at 19.6°C, and London St James’s Park, which holds the record for England SE and Central S. In fact, this record of 40.2°C on July 19th, 2022 was only pipped for 60 seconds near the runway at RAF Coningsby where 40.3°C was achieved at around the time three typhoon jets were attempting to land. Seemingly besides itself with excitement, the Met Office lauded the breaking of the 40°C barrier as “a milestone in climate history”.

The Met Office appears to be in denial about its temperature network. It notes that WMO Class 5 is not the same as its own ‘Unsatisfactory’ inspection, “which ultimately determines the ongoing use of a site”. The internal system is said to tell the Met Office how much confidence it can have in the data. Rather a lot, cynics might observe, given the continued presence of ‘Unsatisfactory’ stations producing well-publicised and frequently politicised ‘extremes’.

Is it legitimate to ask how much confidence we can have in the Met Office data used to spread alarm and promote the Net Zero fantasy? The BBC’s green activist-in-chief Justin Rowlatt noted in July that the Met Office had “confirmed” that climate change “is dramatically increasing the frequency of extreme high temperatures in the U.K.” In a period of gentle warming it might be expected that temperatures would rise a little, with unnatural urban heat corruptions warming both day and night-time measurements. But as we can see from an analysis of the source Met Office data, the alleged confirmation of soaring high extremes is an imaginative interpretation somewhat challenged by the underlying scientific work.

We might have more confidence in the Met Office’s ability or wish to provide uncorrupted figures if we did not recently learn that over eight in 10 of the 113 temperature measuring stations opened in the last 30 years were deliberately or carelessly sited in Class 4 and 5 locations. Shockingly, the situation was just as bad over the last 10 years, where 81.5% are rated Class 4 and 5, and it beggars belief that in the last five years, eight of the 13 newly-opened stations are at similar junk sites. Both Iver W. Wks and Stowe are to be found on the Met’s own small naughty step despite opening in 2016 and 2012 respectively.

We are obliged to citizen sleuth Ray Sanders for this latest FOI request to the Met Office that confirms the level of internal denial about the state of its temperature network. Noting that the Met Office says its own standards form the “official benchmarks” for assessing the suitability of temperature sites, and hence the data for the long-term climate record, he observed: “Screw international standards ISO 19289:2014 (E). We are going to use our own standards that we decided on; you cannot question them, and we will not allow any independent assessment of… What do you mean we helped arrange the ISO standard with the WMO… Who cares? So what you gonna do about it, eh?”

Chris Morrison is the Daily Sceptic’s Environment Editor.

LinkedIn “Disappears” Another Energy/Climate “Realist”

David Blackmon is a highly regarded energy and oil industry analyst. His work has often been featured here on WUWT. He is was one of my LinkedIn connections.

From Watts Up With That?

By David Middleton

Guest “Make Orwell Fiction Again!” by David Middleton.

David Blackmon is a highly regarded energy and oil industry analyst. His work has often been featured here on WUWT. He is was one of my LinkedIn connections.

Dear LinkedIn: Why Have I Been Suspended? by David Blackmon

Read on Substack

I couldn’t figure out how to embed the video, so I took a screenshot:

https://open.substack.com/pub/blackmon/p/dear-linkedin-why-have-i-been-suspended?utm_campaign=post&utm_medium=web

His account has vanished from LinkedIn.

I reposted his Substack video on LinkedIn. I’ll let y’all know if I get “disappeared.”

While it is possible that someone hacked his account, I think it’s more likely that a ski instructor, pilot/songwriter or some other LinkedIn-recognized energy experts complained about something he posted.

David Blackmon’s Substack is very appropriately titled “Energy Transition Absurdities.”

US EIA

While coal may have surpassed renewables (wood) in the late 1800’s, we never transitioned away from consuming wood for energy.

US EIA

Energy Transition…

https://www.azquotes.com/quote/445662

Or was it Bertrand Russell?

Utah seeks the transfer of 18.5 million acres of land to state control

In the latest twist in a long-simmering conflict between Utah and the federal government, state officials filed a lawsuit asking the Supreme Court to determine whether the Bureau of Land Management is legally authorized to indefinitely control 18.5 million acres of land in the state that has not been set aside by Congress for a specific use.

From CFACT

By Bonner Cohen, Ph. D.

In the latest twist in a long-simmering conflict between Utah and the federal government, state officials filed a lawsuit asking the Supreme Court to determine whether the Bureau of Land Management is legally authorized to indefinitely control 18.5 million acres of land in the state that has not been set aside by Congress for a specific use.

In suing BLM and petitioning the Supreme Court to hear the case, Utah is pursuing an aggressive legal strategy to resolve the issue of “unappropriated” lands as quickly as possible.  The term “unappropriated” refers to lands the BLM manages in Western states, including Alaska, that are not designated as national parks, wildlife refuges, national forests, tribal lands, wilderness areas, recreational areas, or military bases.

“Today, we filed a historic lawsuit asking the U.S. Supreme Court to address whether the federal government can simply hold unappropriated lands within a state indefinitely.  Nothing in the text of the Constitution authorizes such an inequitable practice,” Utah Attorney General Sean D. Reyes said in a press release.  “In fact, the Framers of the Constitution carefully limited federal power to hold land within the states. Current federal land policy violates state sovereignty and offends the original and most fundamental notions of federalism.”

The attorney general’s reference to Utah’s “inequitable” treatment is bolstered by data provided by the attorney general’s office. “The federal government currently controls nearly 70 percent of the land in Utah,” his office said.  “In comparison, the federal government owns less than 1 percent of the land in Connecticut, New York, and Rhode Island, and less than 3 percent of the land in Delaware, Maine, Massachusetts, Ohio, and Pennsylvania.”

The 18.5 million acres in the Utah lawsuit represent 34 percent of the state’s land. These lands contain rich deposits of minerals, hydrocarbons, and other resources, access to which is controlled by Washington bureaucrats, not elected officials in Utah. Other states in the West also are saddled with a vast federal estate that has frequently crippled economic growth in rural areas.

“It is obvious to all of us that the federal government has increasingly failed to keep our lands accessible and properly managed,” Utah’s Gov. Spencer Cox said in announcing the lawsuit.  “Utah deserves priority when it comes to managing this land. Utah is in the best position to understand and respond to the unique needs of our environment and communities.”

Utah House Speaker Mike Schultz pointed to BLM’s recently published Public Lands Rule, which would effectively end the legally mandated practice of multiple uses of federal lands in favor of conservation (locking up natural resources) — as “beyond devastating for Utah.”  The Salt Lake City Tribune reported that he also cited Washington’s failures in controlling wildfires, protecting wildlife habitats, preventing floods, and managing water resources on public lands.

Myron Ebell, the Utah-based American Lands Council chairman, praised Utah’s lawsuit.  “Utah’s important case has ramifications far beyond the state.  The Supreme Court’s decision will apply to tens of millions of acres across the West and Alaska,” he said in a news release.  “Utah and other states have demonstrated over many decades that they are much better stewards of their state lands and wildlife than the federal government is of its vast federal estate.  The practical consequences of state and local management of these lands will be to improve environmental quality, increase recreational access, and provide better economic opportunities for rural Americans.”

If Utah wins its case, the state will manage the former BLM land for mining, recreation, livestock grazing, and energy development through the Utah Department of Land Management. Although the lawsuit is limited to Utah, the precedent a favorable Supreme Court ruling would set could be followed by other Western states eager to wrest control of their natural resources from the feds. Gaining control of fossil-fuel resources at a time of growing demand for reliable energy would be a job- and revenue-producer for states.

Such a policy is contained in the Rock Springs Resource Management Plan, which sets new conservation- and climate-oriented priorities on 3.6 million acres (about 5,600 square miles) of BLM land in southwestern Wyoming. The decision on how the land will be used will be made in Washington, not in Wyoming, which is what the Utah lawsuit is all about.

This article originally appeared at D.C. Journal

Shrinking island, vanishing polar bears — the climate scare stories that turn out to be false

Looking back on more than 20 years of climate agitation, two themes emerge: a stubborn unwillingness by campaigners to acknowledge any inconvenient science, and ever-shifting favorite stories, first elevated and then dropped by the wayside.

According to studies, the land mass of the island of Tuvalu is increasing — despite past concerns about it sinking due to climate change.REUTERS/Kirsty Needham

From New York Post

By Bjorn Lomborg

Looking back on more than 20 years of climate agitation, two themes emerge: a stubborn unwillingness by campaigners to acknowledge any inconvenient science, and ever-shifting favorite stories, first elevated and then dropped by the wayside.

The one constant: a fixation on scaring the public, which has in turn shaped bad climate policies.

At the start of this century, the polar bear was the emblem of climate apocalypse.

Protesters dressed as polar bears, while Al Gore’s hit 2006 film “An Inconvenient Truth” showed us a sad, animated polar bear floating away to its death.

The Washington Post warned that polar bears faced extinction, and the World Wildlife Fund’s chief scientist even claimed some polar bear populations would be unable to reproduce by 2012. 

And then in the 2010s, campaigners just stopped talking about polar bears.

Why? Because after years of misrepresentation, it finally became impossible for them to ignore a mountain of evidence showing that the global polar bear population has increased substantially from around 12,000 in the 1960s to around 26,000 in the present day. (The main reason? People are hunting a lot less polar bears). 

The same thing has happened with depictions of Australia’s Great Barrier Reef.

For decades, campaigners shouted that the reef was being killed off by rising sea temperatures.

After extensive damage from a hurricane in 2009, official Australian estimates of coral cover reached a low in 2012.

The media was flooded with claims of the “Great Reef Catastrophe” and scientists predicted the reef would be decimated by 2022. The Guardian even published an obituary. 

The latest official statistics show a completely different picture. For the past three years, the Great Barrier Reef has had more coral cover than at any point since records began in 1985, with 2024 setting a new record.

The good news gets a fraction of the coverage that the scare stories did. 

An often-recurrent climate story has been the alleged drowning of small Pacific islands due to sea level rise.

In 2019, United Nations Secretary General António Guterres flew all the way to Tuvalu for a Time magazine cover-shot.

Wearing a suit, he stood up to his thighs in the water, demonstrating “our sinking planet.” The accompanying article warned the island — and others like it — would be struck “off the map entirely” by rising sea levels. 

UN Secretary General António Guterres on the cover of Time Magazine in June 2019.Time

This summer, the New York Times finally shared what it called “surprising” climate news: almost all atoll islands are increasing in size. In fact, the scientific literature has documented this trend for more than a decade.

While rising sea levels do erode land, additional sand from old coral is washed up on low-lying shores.

Extensive studies have long shown this accretion is stronger than climate-caused erosion, meaning the land area of Tuvalu is increasing. 

Climate change is real. It is manmade. It is a challenge that needs sensible policies.

But campaigners do the cause a massive disservice by refusing to acknowledge evidence that challenges their intensely doom-ridden worldview.

All these misguided claims add up, and have shaped the climate panic that has led to politicians passing climate legislation that now costs the world more than $2 trillion annually, for a tiny benefit. 

Today, killer heat waves are the new scare story – and the latest example of willful blindness of the bigger picture.

Recently, President Biden claimed “extreme heat is the number one weather-related killer in the United States.”

He is wrong by a factor of 25. While extreme heat annually kills nearly 6,000 people, cold kills 152,000 Americans each year, of which 12,000 die from extreme cold.

Despite rising temperatures, age-standardized extreme heat deaths have actually declined in the US by almost 10% per decade and globally by even more, largely because people who are more prosperous are better able to afford air conditioners. 

If 6,000 heatwave deaths are a genuine priority, a sensible response would be to ensure American electricity remains cheap so it’s not just the rich who can afford to keep air conditioning running.

The same policy prescription would hold if President Biden were to pay attention to the 152,000 Americans dying each year from the cold.

Strokes and heart attacks spike when older people can’t afford to heat their homes through winter.

Sadly, rather than keeping energy costs low, a lot of climate policy does the opposite.

It is hard not to see a pattern of climate-alarmed campaigners scaring people witless and choosing to ignore inconvenient science for as long as they can — before simply switching to a new climate fright when it becomes too awkward not to. 

But scare campaigns have consequences. They leave everyone — and especially young people — distressed and despondent.

Fear leads to poor policy choices, like western governments spending trillions of dollars on ineffective climate responses.

And they erode the public trust, like when emphasizing heat deaths, because they fit the narrative, while ignoring much greater numbers of cold deaths. 

Telling half-truths whilst piously purporting to be following the science benefits activists with their fundraising, generates clicks for media outlets, and helps politicians rally voters.

But it leaves all of us poorly informed and worse off. 

Bjorn Lomborg is President of the Copenhagen Consensus, Visiting Fellow at Stanford University’s Hoover Institution, and author of “False Alarm” and “Best Things First.”