Global warming, climate change, all these things are just a dream come true for politicians. I deal with evidence and not with frightening computer models because the seeker after truth does not put his faith in any consensus. The road to the truth is long and hard, but this is the road we must follow. People who describe the unprecedented comfort and ease of modern life as a climate disaster, in my opinion have no idea what a real problem is.
Another observational analysis finds the shortwave effect of clouds is the “the dominant term of the recent increase in absorbed solar radiation” explaining 2001-2024 warming.
Another observational analysis finds the shortwave effect of clouds is the “the dominant term of the recent increase in absorbed solar radiation” explaining 2001-2024 warming.
According to the authors of a new study, clouds are the primary modulators of the Earth’s shortwave and longwave radiation. Thus, the radiative effects of clouds “play a crucial role in determining the Earth’s energy balance” and “dominate the radiative balance trends.”
Satellite observations indicate that from 2001-2024 there was a 0.45 W/m² per decade increase in solar radiation reaching the Earth’s surface. This 1 W/m² rising trend in absorbed solar radiation was primarily caused by declining cloud cover.
“The increase in the absorbed solar radiation is driven primarily by a decrease in the reflection of SW radiation by clouds.”
The shortwave cloud radiative effect (SWCRE) is thus regarded as the “crucial missing piece” in explaining 21st century warming.
“[C]hanges of only a few percent in the relative coverage of the [cloud] regimes produce large cloud radiative signatures that can dominate the radiative balance trends”
To claim that anthropogenic CO2 emissions drive global warming, radiative forcing modeling studies must assume 1) clouds do not ever change, 2) cloud albedo is constant, and/or 3) clouds do not exist. None of these are real-world conditions.
To claim that anthropogenic CO2 emissions drive global warming, radiative forcing modeling studies must assume 1) clouds do not ever change, 2) cloud albedo is constant, and/or 3) clouds do not exist. None of these are real-world conditions.
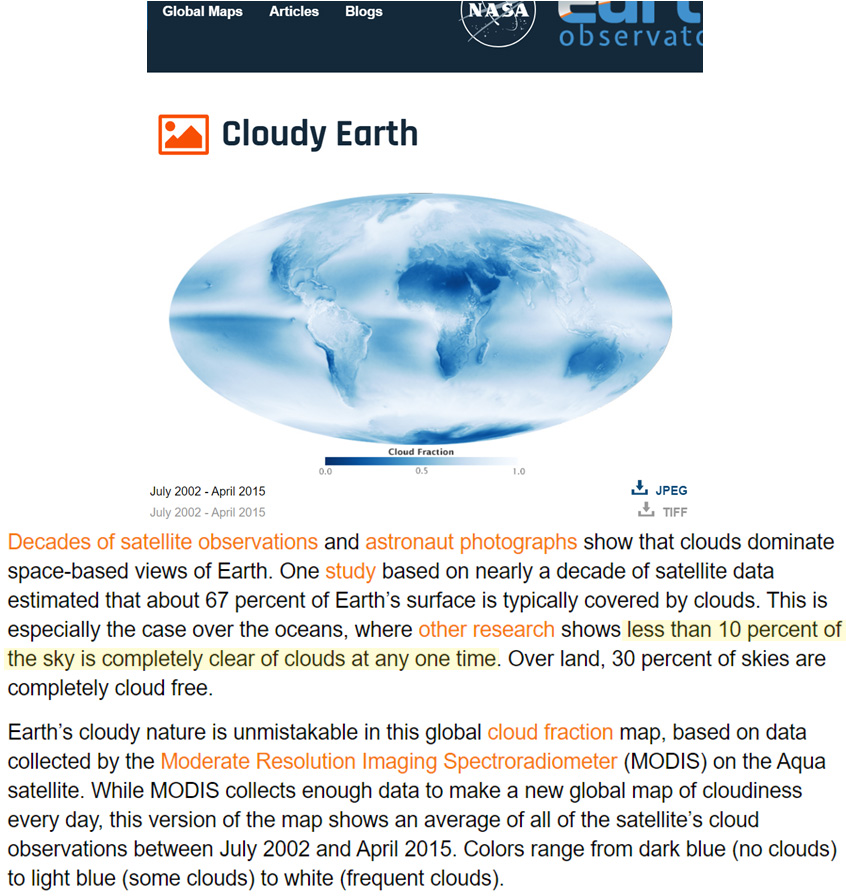
The real atmosphere is what scientists refer to as all-sky, an atmosphere where clouds not only exist but they are present 70-90% of the time.
In the real world clouds also “regulate the Earth’s climate,” as they are “the most important parameter controlling the radiation budget, and, hence, the Earth climate” (Sfîcă et al., 2020, Lenaerts et al., 2020).
Studying all the factors contributing to Earth’s Energy Imbalance (EEI) means we must consider the controlling, regulating dominance of the cloud radiative effect. Isolating selected factors like well-mixed greenhouse gases (CO2, CH4) while simultaneously excluding the cloud radiative effect only serves to advance a narrative about what is believed to occur an imaginary world where clouds are constant or do not exist.
Succinctly, an all-sky atmosphere analysis means cloud radiative effects are included in the calculations. A clear-sky analysis excludes the radiative effect of clouds.
Modeling studies purporting to isolate the radiative effect of anthropogenic emissions of CO2 and other greenhouse gases can only refer to clear-sky conditions – an Earth atmosphere that does not exist in reality.
Recently, Kramer et al. (2021) has received a lot of attention as a study robustly supporting the claim we humans have been and continue to control the climate with our CO2 emissions. They use a modeling “technique” that is claimed to isolate the human contribution to the radiative forcing from the “total radiative changes” from 2003 to 2018.
“We use the radiative kernel technique to isolate radiative forcing from total radiative changes and find it has increased from 2003 to 2018, accounting for nearly all of the long-term growth in the total top-of-atmosphere radiation imbalance during this period.”
However, the authors acknowledge that to arrive at their conclusion that anthropogenic CO2 is the dominant radiative forcing factor, their modeling calculations can only apply to an imaginary-world, clear-sky-only atmosphere. They admit radiative modeling for an all-sky world is “not possible.” So they assume clouds are constant, and that cloud albedo variations neither exist or affect climate. Hence, their study does not use real-world observational evidence; it only uses modeled calculations for a world that does not exist in reality.
“For all-sky conditions, an analogous calculation…requires the [instantaneous radiative forcing from all factors affecting climate] be known, [and thus] this differencing technique is not possible.”
“…we estimate Cl [cloud cover] is a constant…”
“For the [longwave impact from clouds] we use a constant of 1.24, derived from dividing clear-sky and all-sky double-call radiative transfer calculations of CO2 [instantaneous radiative forcing] from models.”
“This conversion to all-sky conditions accounts for the presence of clouds but not cloud changes. Therefore, the [instantaneous radiative forcing] in this study does not include aerosol-cloud interactions, such as cloud albedo effects.”
Feldman et al. (2015) is another study that anthropogenic global warming (AGW) apologists often claim provides “observational” evidence of the dominance of CO2 forcing in climate change. But, of course, this widely-heralded study also only has radiative calculations applying to an imaginary world where clouds do not exist (clear-sky). The authors even admit in the abstract that CO2’s radiative effects can only impact 10% of the longwave forcing trend in clear-sky.
Song et al. (2016) provide an excellent illustration of the reason why AGW-promoting studies only reference imaginary-world, clear-sky conditions and simultaneously exclude real-world conditions, or all-sky.
From 2003-2014, the total greenhouse effect forcing trend can be shown to be positive (blue) – but only for clear-sky conditions where CO2 and water vapor are presented as the drivers. This supports the position that rising CO2 and other greenhouse gases are enhancing the greenhouse effect as they rise.
But clouds exist, and all-sky is reality. And, in contrast to the clear-sky trend, the all-sky greenhouse effect impact (where clouds are considered as a radiative forcing factor in climate) is negative (red). The greenhouse effect is not enhanced, but devolves to a decline or a “hiatus” when clouds are considered.
“Therefore, although the greenhouse effect can be enhanced by increasing GHGs and water vapor in the atmosphere, it can be weakened by decreasing clouds. If these two actions offset each other, a hiatus of the global greenhouse effect will result.”
Of course, AGW apologists do not want us to see what happens when we fail to pretend clouds do not exist, or that clouds are not variable, but constant. They know cloud radiative effects destroy the humans-did-it narrative.
Cooling occurs as a result of clouds blocking the sunlight from hitting the ground by reflecting sunlight back out to space or by absorbing the sunlight. Either way cools the surface.
Warming occurs from that part of the thermal radiation emitted by the clouds that hits and is absorbed by the ground.
I love science because of the surprises. Today I had several. My first surprise today was evidence of strong negative feedback in surface temperature. Let me note that I’m not claiming I’m the first person to make these observations. I’m simply saying, it was surprising to me.
My method of scientific investigation is graphics-based. I take chunks of numbers, sometimes tens of thousands of them, and display them graphically. And at times the result is what I expected, or even hoped for.
Other times, though, my latest graph comes up on the silver screen and I say “Whaaa?” … those are the surprises that make it all worthwhile. And those are where interesting meandering paths start. Come amble with me along one of those paths.
As the result of a series of misunderstandings and coincidences, I ended up taking a look at the month-by-month changes in the net effect of clouds on radiation. “Net effect” refers to the fact that clouds both warm and cool the surface.
Cooling occurs as a result of clouds blocking the sunlight from hitting the ground by reflecting sunlight back out to space or by absorbing the sunlight. Either way cools the surface.
Warming occurs from that part of the thermal radiation emitted by the clouds that hits and is absorbed by the ground.
“Net effect” is the difference between the two opposing effects—including both effects, are the clouds warming or cooling the surface, and by how much?
Unsurprisingly, this is known as the “surface net cloud radiative effect”, or the “surface net CRE”, hereinafter “CRE”. When the CRE is negative, it means the net radiative effect of the clouds iscooling the surface. Correspondingly, a positive CRE means clouds are warming the surface via radiation changes. Figure 1 shows the 24-year average of the CERES satellite record of the net surface CRE.
Figure 1. The effect of clouds on the net total of radiation (longwave and shortwave) absorbed by the earth’s surface. The horizontal dashed lines near the equator mark the edges of the tropics (23.5° N/S). The horizontal dashed lines near the poles are two polar circles (66.5° N/S). Units are watts per square meter (W/m2).
There are some interesting things about Figure 1.
• Overall, clouds cool the surface by about -19 watts per square meter (W/m2)
• The ocean is cooled almost three times as much as the land.
• The areas polewards of the two polar circles are warmed by clouds.
• The only areas warmed on average by the clouds are those polar regions and the deserts.
• The greatest cooling is at the inter-tropical convergence zones just above the Equator and the Pacific Warm Pool north of Australia.
What I’d never looked at, though, is the month-by-month record of the surface net CRE. Of course, to look at that we need to look at the hemispheres separately, to avoid the effects of the opposing seasons in the two hemispheres. Figure 2 below, showing northern hemisphere variation by month, was my first surprise.
Figure 2. Monthly net surface cloud radiative effect, northern hemisphere.
I did NOT expect the effect to vary from slight warming in the winter to -40 W/m2 cooling in the summer. That is a giant swing in the effect of the clouds.
It was also interesting to see the net cooling effect of -0.2 W/m2 per decade. The decadal increase in CO2 forcing was +0.27 W/m2 (95% CI: 0.22 W/m2 – 0.32 W/m2). So over the period of record, the small change in surface CRE is of the same order of magnitude and is acting in opposition (cooling) to any warming effects of the CO2 forcing.
Of course, that got me to wondering how much difference not having the radiative effect of clouds would make in the summer and winter temperatures … which led me to create Figure 3.
Figure 3. Current northern hemisphere summer temperatures (black), and theoretical temperatures without the clouds’ radiative effect (other things being equal, which of course they never are). Values in all instances were done in units of W/m2, and then converted to temperature using the Stefan-Bolzman equation with an assumed emissivity of 0.95.
So instead of northern hemisphere peak average summer temperatures being around 72°F (22°C), without the varying radiative effects of the clouds they would be about 84°F (29°C). Yikes! And winters would be slightly colder as well.
(And yes, I’m aware that without clouds a bunch of other things would change, so my graph is pure theory. I’m just trying to give folks a sense of just how huge a swing of cloud cooling from +5 W/m2 in winter to -40 W/m2 in summer actually is.)
Intrigued, I decided to take another look at the whole globe as in Figure 1, but this time for the northern hemisphere midwinter (December) and midsummer (June) separately. Here are those two graphics.
Figure 4. As in FIgure 1, but showing midsummer and midwinter surface net cloud radiative effect. December and June averages. The horizontal dashed lines mark the edges of the tropics (23.5° N/S), and the two polar circles (66.5° N/S).
Again, more things of interest. In the NH midwinter (December), clouds warm almost all of the area north of about 35°N or so. In the southern hemisphere midwinter (June), the same is true. The clouds warm areas south of about 35°S.
Another oddity. In many cases, the white/ black contour lines outline desert areas where according to CERES, clouds are warming regardless of the season. Why?
Next, I looked at scatterplots of the surface temperature versus the surface cloud radiative effect, utilizing 1° latitude by 1° longitude gridcell data. For each hemisphere there are 32,400 data points. I graphed the data by season and by hemisphere. And in doing so, I noticed a most curious oddity. This was my second surprise.
The graph of the relationship between the midwinter temperature and midwinter cloud radiative effect is very similar in the two hemispheres.
And the same is true of the relationship between midsummer cloud radiative effect and midsummer temperatures. The two hemispheres have similar summer relationships. Here are those comparisons.
There are some interesting points here. First, the correspondence between the two winters (upper frame) and between the two summers (lower frame) is surprisingly close.
The main difference is in the summers in the low-temperature gridcells. The southern hemisphere has open ocean almost all the way to the ice-covered high Antarctic Plateau. In both winter and summer, the clouds warm Antarctica. So in the summer, the change in the cloud radiative effect at Antarctica’s shoreline area is a sudden and almost vertical change to warming (left end of orange/black line, lower frame). In the Arctic, because the pole is covered with water rather than the high-elevation land of the South Pole, the change to the polar warming is slower and more gradual (left end of blue/black line, lower frame)
Other than that, however, the two hemispheres are quite similar. Most importantly, in both summer and winter, as temperatures go above about 26°C or so, the cloud cooling rapidly strengthens and increases faster with each additional degree of surface warming.
The seasonal similarity of the oceans of the two hemispheres is important to me for a curious reason. I’ve used a gridcell-based scatterplot analysis of the type in Figure 5 above for things like the following look at how temperature and CRE are related over the entire globe. See my post Observational and theoretical evidence that cloud feedback decreases global warming for a discussion of the implications of Figure 6 below.
Figure 6. Scatterplot, net surface cloud radiative effect versus surface temperature, all 1° latitude by 1° longitude surface gridcells.
The main objection that people have raised to my using a gridcell-based scatterplot analysis of the type in Figures 5 and 6 above is their claim that it’s investigating location-based relationships, and thus it does not demonstrate any direct relationships between the two variables.
Another way to state the objection is to say that of course certain locations have some given relationship between temperature and CRE—the relationship is ruled by the location-based characteristics of the gridcells in question. Maybe there are ocean currents or nearby mountains that are ruling both the temperature and the CRE.
Now, that didn’t seem logical to me, because in Figure 6, the CRE values are grouped by the average gridcell surface temperature. And there are lots of gridcells around the planet with very similar average temperatures. But I hadn’t figured out how to counter that objection, to show that it’s not location-based.
However, the similarity of the hemispheric ocean midwinters, and of the hemispheric ocean midsummers, shows that the relationship between temperature and cloud radiative effect is not due to some location-specific characteristics.
It can’t be location-specific, since there are no locations that are common to both hemispheres. These are entirely different gridcells in entirely different oceans in different hemispheres, with different currents, different depths, different adjacent landmasses … and yet the relationship between temperature and surface cloud radiation is surprisingly similar.
So by chance, to my third and greatest surprise of the day, after starting down a totally different path I stumbled across a way to counter the main objection I’ve gotten to my gridcell-based scatterplot analyses.
Funny how life works when I follow random byways with no guide star except my endless curiosity about the wonders of this world.
===
Moon rising up above the redwood trees. Must be time for me to go moon viewing. I just need someone with a uniform and a Glock to come by every few hours and say “Step back from the computer, sir, keep your hands away from the keyboard and nobody gets hurt!”
Onwards, my friends, and my best to you all—may your lives be full of marvels, adventures, and surprises of all kinds.
w.
As Usual: I politely request that when you comment you quote the exact words you’re discussing. Avoids endless misunderstandings.


You must be logged in to post a comment.