Death Valley Temperatures, Part II: Thoughts from William T. Reid

Since he has done extensive investigation into some implausibly hot temperatures reported in Death Valley, I asked Bill Reid to comment on my previous blog post where I maintain that the world record 134 deg. F highest recorded air temperature was likely biased warm by about 10 deg., and should not be accepted as a world record. What follows are Billโ€™s initial thoughts on the subject.

From Roy Spencer, PhD

November 9th, 2024 by Roy W. Spencer, Ph. D.

NOTE: Since he has done extensive investigation into some implausibly hot temperatures reported in Death Valley, I asked Bill Reid to comment on my previous blog post where I maintain that the world record 134 deg. F highest recorded air temperature was likely biased warm by about 10 deg., and should not be accepted as a world record. What follows are Billโ€™s initial thoughts on the subject. Also, based upon his comments, I will likely update the charts found in my previous blog post with more realistic temperature lapse rate values in the early 20th Century when insufficient stations were available to determine accurate lapse rates.

by William T. Reid

A big thank you to Dr. Spencer for investigating the current (very dubious) world high-temperature record and for bringing attention to my Death Valley climate research. There are a handful of ways, both climatologically and meteorologically, to show that Greenland Ranchโ€™s reported maximum of 134F on July 10, 1913, is likely not valid.

Dr. Spencerโ€™s methodology here (comparing the Death Valley maximums to those the closest surrounding stations, with adjustments for station elevation) is indeed a devastating blow to the authenticity of the suspect observations. What it basically demonstrates is that the lower troposphere was not hot enough to support temperatures much above 125F in July, 1913. I have compared regional maximums for all of the hottest summertime events since 1911. In practically all instances (in which the Greenland Ranch and Death Valley reports appear reasonable), ALL of the maximums at the closest surrounding stations lend support to the maximums for Death Valley.

From July 7 to 14 of 1913, when eight consecutive afternoons had reported maximums of 127, 128, 129, 134, 129, 130, 131 and 127F in Death Valley, NONE of the maximums from the closest surrounding stations supported the Greenland Ranch maximums! The departures from average for maximums for the hottest five-day stretch were about +4 to +8 at the closest stations, while maximums at Greenland Ranch were nearly 15 degrees F above the average for July. (see table)

Annual maximums at Greenland Ranch from 1911 to 1960 ranged from 120F to 127F, except for the 134F in 1913. If the reported maximums at Greenland Ranch in July, 1913, were authentic, then the maximums at the closest surrounding stations in that month would have been much higher than reported. In addition, numerous regional heat waves have been hotter than the one during the first half of July, 1913. Why have Death Valley maximums failed to exceed 130F in the interim when three days in July 1913 purportedly reached 134, 130 and 131F?

In his โ€œbiasโ€ chart, Dr. Spencer notes the โ€œsubstantial warm biases in the temperatures reported at Greenland Ranch in the first 10-15 years.โ€ And, he mentions that the observer(s) may have been relying to some extent on thermometers other than the official instrumentation. I do think that the observer was comparing โ€œhousehold thermometerโ€ readings with the official equipment on occasion from spring to summer of 1913. Higher readings off of the poorly-exposed thermometers near the ranch house and under the veranda were probably (and inappropriately) entered onto the official climate form. But, I have not uncovered much evidence of this particular type of deviation from standard observational procedures outside of 1913.

I would contend that the generally higher โ€œbiasโ€ numbers from the early years comparably are due primarily to changes at the closest area weather stations which promoted cooler maximums early on and warmer maximums later. For example, two of the closest stations to Greenland Ranch in 1913 were Independence and Lone Pine, in Owens Valley. In 1913, Owens River water was diverted to Los Angeles, and the Owens Valley gradually dried up. Summer maximums increased as Owens Lake evaporated, irrigation was not possible and farmland was abandoned, and desert-like conditions developed. (Royโ€™s note: The early years had very few stations within 100 miles of Death Valley, and the temperature lapse rates I computed from those few stations appear to be biased as a result. I will correct this in a future blog post, and will provide what should be better estimates of average July daily maximum Death Valley temperatures.)

Also, in the early decades of the 20th century, thermometer shelters were (almost invariably) sited above grass. This resulted in very conservative (i.e., coolish) maximums at desert stations. Low humidities promoted cooling due to evapotranspiration effects. In the early decades of the 20th century, desert weather stations were generally in towns, amidst shade trees and lawns. The resulting maximum temperature reports were very conservative. By mid-century and thereafter, the town weather stations were more likely to be at the airport or at a municipal utility site, fire station or equipment yard. Grass cover and shade trees were usually absent at these locales. Today, desert weather stations in towns and cities are (almost invariably!) above bare ground.

You can imagine the difference in maximums between desert stations above oft-irrigated grass and those above bare ground. (Royโ€™s note: In my experience, unless the vegetation area is rather large, and there is almost no wind, a weather stationโ€™s daily maximum temperature will still be largely determined by air flowing from the larger-scale desert surroundings. But noteโ€ฆ this is different from, say a poorly sited thermometer next to a brick wall or heat pump where hot air from an isolated source can elevate the daily maximum temperature recorded).

The Greenland Ranch station was originally sited above a patch of alfalfa grass, immediately adjacent to forty acres of cultivated and irrigated land.

It is my belief that the new observer in 1913 (Oscar Denton) was rather disillusioned with the conservative maximums from the official station above grass and next to the evaporatively-cooled farmland. I think he felt compelled to fudge the maximums upwards in 1913. Photographs of the Greenland Ranch weather station show that it was above bare ground by about 1920 (see example photo at top of post).

The lamest UN climate meeting starts with some moonlighting fossil fuels deals โ€œon the sideโ€

Every year thousands of bureaucrats meet in an exotic location for a UN conference to agree not to solve โ€œglobal warmingโ€. Next week will be the 29th failure.

From JoNova

By Jo Nova

It could be the lamest COP meeting yet

Every year thousands of bureaucrats meet in an exotic location for a UN conference to agree not to solve โ€œglobal warmingโ€. Next week will be the 29th failure. It is the Olympics of Big Government rorts. This is not just a few hundred climate scientists catching up for a weekend, there are forty or fifty thousand grifters meeting, not just for a few days but for two money-sucking weeks. After theyโ€™ve used the tax dollars to get there, they sit around and discuss how they will divvy up the loot, the other tax dollars, called โ€œclimate financeโ€, as if the atmosphere wants a loan.

In a devastating blow, this year the EU political Queen Ursula von der Leyen is going to miss the event, which some call a โ€œfatal signalโ€.

As it happens, Joe Biden and Emmanual Macron are not going either. It just doesnโ€™t have the social cachet these days in the wake of the US election.

This next little story is so emblematic of the corruptocrat blob. A senior member of Azerbaijanโ€™s COP29 team has been caught red handed using the โ€œclimateโ€ conference to line up investors in Azerbaijanโ€™s oil and gas fields. The sad truth is, that in terms of the worldโ€™s poor, this was probably the most productive event at the conference.

In a secret recording a fake Hong Kong investor said he wanted to sponsor the conference but in return needed to discuss โ€œinvestment opportunitiesโ€ in local gas fields โ€” ainโ€™t that just the way the whole climate cartel rolls? Everybody pretending to look after the planet, but really looking out for themselves.

COP29 chief exec filmed promoting fossil fuel deals

A secret recording shows the chief executive of Azerbaijanโ€™s COP29 team, Elnur Soltanov, discussing โ€œinvestment opportunitiesโ€ in the state oil and gas company with a man posing as a potential investor.

โ€œWe have a lot of gas fields that are to be developed,โ€ he says.

The BBC has been shown documents and secret video recordings made by the human rights organisation, Global Witness.

However, this is the second year in a row the BBC has revealed alleged wrongdoing by the host government.

Where was the BBC for the other 27 conferences? โ€” covering up the crime.

The horse-trading starts Monday. But In a shock, Papua New Guinea has pulled out, calling the event a total waste of time.

โ€œThe last three Cop meetings have gone around in circles, producing no tangible results for small island states. Cop29 will be no different, so Papua New Guinea will not participate at the political level,โ€ Tckatchenko said.

Good for you PNG.

Despite Media Panic, There Is No Reason to Think 2024โ€™s Warming Is Disastrous

Multiple outlets have posted articles covering a report from the European Copernicus Climate Change Service (โ€œCopernicusโ€) which says that 2024 will be the first to surpass 1.5ยฐC warming since pre-industrial times, which the media claims will cause untold weather disasters. This is mostly false.

The boogeyman of climate change.

From ClimateRealism

By Linnea Lueken

Multiple outlets have posted articles covering a report from the European Copernicus Climate Change Service (โ€œCopernicusโ€) which says that 2024 will be the first to surpass 1.5ยฐC warming since pre-industrial times, which the media claims will cause untold weather disasters. This is mostly false. Although it is likely that 2024 will have higher average temperatures than in recent decades, it is not the end of the year yet, and there limited evidence to support the claim that it will represent the highest temperatures humans have ever experienced and no evidence whatsoever that weather disasters have gotten or will get worse.

The BBC and CNN are among the numerous mainstream media outlets reporting on Copernicusโ€™ report.

CNN describes the report as โ€œdevastating news for the planet that comes as America chooses a president that has promised to undo its climate progress both at home and abroad.โ€

The Copernicus group estimates that 2024 will end up 1.55ยฐC hotter than the 1850-1900 average, which is 0.05ยฐC above the warming limit set by the Paris Agreement. This may be true, but there is no evidence that the 1.5โ„ƒ threshold is actually some kind of deadly tipping point for weather disasters. The same organization sounded the alarm last year that the โ€œlimitโ€ was breached for several months in a row, while ignoring natural factors like an underwater volcano eruption. As for the 1.5 degree limit itself, it was not established by professional climate scientists. Only one of the people who were on the panel that came up with the value was even a meteorologist.

Two other points worth noting. The claim is bit of sleight of hand, cherry picking the data for comparison. Earth was only just coming out of a little ice age at the onset of the 1850 period, one of the coldest periods during the past millennia. When you pick an usually cold period for comparison, a modest warming seems more dramatic than it is.

Second, the 1.5โ„ƒ is an arbitrary temperature choice. As Climate Realism has discussed repeatedly, here, here, and here, for example, it was chosen by politicians for political reasons. There is no scientific evidence it represents some tipping point for catastrophic climate change. It is likely that the world has warmed more than 2ยฐC since the 1700s, with no apocalypse.

One would think that if warming causes more extreme weather there would be solid data and identifiable consistent trends showing an increase in extreme weather, but there is none. Three of the weather events CNN cites at the end of their article as proof of a supposed climate emergency, Hurricane Milton, the flooding in Spain, and low snow amounts at Mt. Fuji, are not proof of a climate emergency. CNN frames any bad weather as โ€œclimate change-fueledโ€ which is unscientific at best, propagandistic and dishonest at worst.

Hurricane Milton, as Climate Realism covered here, here, and here, was not unprecedented. Nor was it caused by climate change. Similar storms have struck the area in the mid-1800s and early 1900s, before modern modest warming started in earnest. Data for Florida in particular show no trends in hurricane severity. (See figure below)

Hurricanes in general are also not intensifying.

The flooding in Spain this fall likewise has no actual data to back up any ideas of being โ€œclimate-fueledโ€ โ€“ again, weather history shows that the event was not unprecedented or unexpected. While it is true that warmer air can hold more moisture, this does not mean that every severe rainfall event is being influenced by this effect. There is not a direct linear correlation between the ability of the air to hold more water vapor, and an increase in the amount of rain that falls when a storm occurs. In addition, massive flooding with similar deadly impacts have occurred repeatedly in Spainโ€™s history, at times when temperatures were cooler. All of this was covered in more detail in the Climate Realism post โ€œFlooding Facts Drowned by Climate Hysteria: The BBC Ignores Spainโ€™s Weather History.โ€

As for Mt. Fuji, CNN is once again exaggerating. The previous records for late snow on the mountain were set in 1955 and 2016 at October 26th, while this year the mountain saw snow November 6th, which is rather late, but not cataclysmic. Experts in Japan say it is too early to link this late snow to climate change.

The BBC is a bit more tempered in its approach, going so far as to admit that much of the warmth this year and last was due to โ€œthe natural El Niรฑo weather pattern.โ€ This is true, and is important context to keep in mind when discussing weather patterns and warming. Climate at a Glance: El Niรฑo and Global Warming points out that removing those phenomena from the climate record causes almost half of global warming in the 21st century to disappear. This is a natural weather pattern that has a major influence on global conditions โ€“ there is no amount of fossil fuel abandonment that would change that.

The news media is abuzz about this latest warming scare story, but as usual, digging into the facts reveals that there is little โ€œnewsโ€ in the stories and even less to actually be worried about. CNN and the BBC would serve their audiences better by checking their biases towards climate alarm at the door, do some fact checking on reports from advocacy groups, like Copernicus, and stick to facts, consisting of data that can be confirmed, rather than relying on scary anecdotes and alarming assertions. Alarm may make for good headlines, but it makes for poor reporting.

SHOCK NEWS!! Ultra-rich using jets likeย taxis

The mega-rich are using private jets like taxis, warn climate scientists who tracked flights to calculate the planet-warming gases they release.

From NOT A LOT OF PEOPLE KNOW THAT

By Paul Homewood

The mega-rich are using private jets like taxis, warn climate scientists who tracked flights to calculate the planet-warming gases they release.

The scientists worked out that the carbon dioxide emissions, which contribute to climate change, rose by 46% between 2019 and 2023.

Researchers traced all private flights globally, including summer weekend trips to Ibiza, Spain and travel to the Fifa World Cup and the UN climate conference in Dubai.

Flying in a private jet for a single hour can release more carbon dioxide into the atmosphere than the average person produces in a year, according to the research team.

โ€œThere are a lot of people using these aircraft as taxis, where you cover whatever distance by aircraft simply because itโ€™s more convenient,โ€ Professor Stefan Gossling, from Swedenโ€™s Linnaeus University, who led the research, said.

โ€œIf somebodyโ€™s flight emits in one hour as much as an average human being emits in a year โ€“ just to watch a soccer game โ€“ then perhaps it shows those people think they are outside the standards that we have as a global community.โ€

In 2023, private flights produced an estimated 15.6 million tonnes of carbon dioxide โ€“ the equivalent of 3.7 million petrol cars being driven over the course of a year, external โ€“ according to the research.

Overall, that is small compared to global carbon emissions. It represents about 1.8% of emissions from all air travel, and aviation is 4% of global emissions.

https://www.bbc.co.uk/news/articles/cx2lvq4el5vo

Maybe they should start with cancelling all future climate conferences and holding them on line then!

But there is a more serious issue here.

Putting taxes

What will they do to stop or at least reduce private flights?

Putting taxes on flights will not make the slightest difference to billionaires, showbiz luvvies, the political elite or big business.

And you can guarantee that whatever sanctions are put on private jets, the ordinary air traveller will be next in line.

UN COP 29 puts crazy money up front

UN Climate COPs have always been about big money but until now there was a facade of emission reductions to hide it behind. This time the money is the big thing and it is amazingly crazy. They want many trillions from us starting next year.

From CFACT

By David Wojick

UN Climate COPs have always been about big money but until now there was a facade of emission reductions to hide it behind. This time the money is the big thing and it is amazingly crazy. They want many trillions from us starting next year.

That people take this nonsense seriously speaks volumes about the unreality of the UN climate program. But it will be great fun to watch them hit the NO WAY wall.

There are actually three big money issues to watch fail. First is the annual money for nothing from developed countries to developing ones that is supposed to jump from a measly $100 billion a year to a trillion a year and quickly growing to almost two trillion. I am not making this up.

Second is the as yet untold trillions we are supposed to pay the developing countries to make up for their bad weather. Which of these two is crazier is hard to say and I welcome suggestions.

Third is perhaps the most fun. People want China, one of the strongest economies in the world, to stop pretending to be a developing country and put big money into these two pots. By some measures China is by far the strongest economy. For example they produce and use more electricity than the US and EU combined.

Before getting further into the greenback craziness a procedural point must be made especially with Trump coming on. This big money stuff is about the MOP not the COP. Howโ€™s that for jargon?

The basis for these annual discussions is the 1994 UN Framework Convention on Climate Change (UNFCCC). This is a treaty ratified by 198 countries including the US. The abbreviation COP stands for the Conference of the Parties to the UNFCCC.

The Paris Agreement is a 2015 supplement to the UNFCCC. It is not a treaty just what is called a Presidential Agreement in international law. President Trump cannot get us out of the UNFCCC but he can easily leave the Paris Agreement as he did last time he was Pres. Getting together under the Paris Agreement is called the Meeting of the Parties or the MOP.

COP 29 is actually part COP and part MOP. All three big money issues are on the MOP side where we will soon be absent. Off course the COP 29 MOP is under what is left of the Biden Administration so we will still be at the table but any promises made will be laughed at. This twist just adds to the frivolity.

Hereโ€™s a bit more on the jargon so you can follow the action. First the astronomical annual payment issue is called the New Collective Quantified Goal or NCQG which strikes me as unpronounceable. Suggestions welcome. At least there is an interior rhyme with C and G.

For purpose of discussion the starting value of the NCQG is $1.1 trillion in 2025 rising to $1.8 trillion in 2019. Yes it is a 5 year plan. No surprise there, right?

The second big money issue is called Loss and Damage. This bad weather pot is just getting off the ground or trying to which may not happen so there is a lot to watch.

The problem is there is more bad weather than money in the world so even possible funds are limited. Thus the basic issue is who gets how much and for what? There are no actual funds at this point. So the debate is entirely academic which diplomats love.

The Chinese issue seems to have no formal name but it is often termed as โ€œChinaโ€™s contribution.โ€ That China is the worldโ€™s biggest CO2 emitter also plays into the guilt trip. Chinaโ€™s answer is that on a per capita basis they are still developing and have a long way to go. We shall see.

Mind you diplomats never say NO so that will not happen. They just never say YES. Watch for it in slow motion since they have two weeks to kill.

The money is laughably impossible and the US is pulling out of the MOP but the show must go on. Stay tuned to CFACT for a lot of fun to come.

Death Valley World Record 134 deg. F is Biased ~10 deg. Too High

Over the years, a few commentators have have argued that the world record highest temperature of 134 deg. F at Death Valley, CA recorded on July 10, 1913 is physically implausible.

November 8th, 2024 by Roy W. Spencer, Ph. D.

Key Points:

  • Over the years, a few commentators have have argued that the world record highest temperature of 134 deg. F at Death Valley, CA recorded on July 10, 1913 is physically implausible.
  • Here I show quantitatively that the 134 deg F temperature is biased high, by about 10 deg. F.
  • Extensive historical research by William T . Reid has suggested the person making the temperature observations at Greenland Ranch likely replaced the official measurements from a thermometer in a Stevenson screen shelter with other measurements made next to the adobe living quarters.

Update #1 (11/8/2024): Fixed a few typos.

Update #2 (11/8/2024): For those messaging me about Furnace Creek temperatures reaching 130 deg. F in recent years, see Bill Reidโ€™s summary of side-by-side measurements made there [and reported at an AMS meeting] showing the non-aspirated โ€œofficialโ€ equipment produces temperatures 2-3 deg. too high during light wind conditions.

Update #3 (11/9/2024): Bill Reid corrected my use of the term โ€œmountainโ€ stations to describe those not in Death Valley. Many of those stations are at desert plateau sites, so I have changed the term to โ€œhigher elevationโ€ stations. I have also asked Bill to provide additional thoughts on this issue, which will be the next blog post here.

Background

The โ€œofficialโ€ world record highest near-surface air temperature is 134 deg. F, recorded in Death Valley, California on July, 10, 1913 at Greenland Ranch, California an isolated location with no similarly sited stations with which to compare (say, within 10 miles and below sea level). Greenland Ranch was a manmade oasis created by the Borax people around the turn of the 20th Century, with water piped in from a nearby mountain. It has a rich history, but always against a backdrop of oppressive summer heat that few visitors (and even workers) could endure.

As part of my new analyses of GHCN daily high and low temperatures, John Christy suggested I take a look at the Death Valley temperature data, and the record 134 deg. temperature in particular. Several people over the years have expressed concerns that the 134 deg. reading is implausibly high, but this has been difficult to prove. Both the World Meteorological Organization and NOAAโ€™s National Weather Service continue to recognize 134 deg. F as the world record. It is quite likely that Death Valley remains the hottest location in North America; itโ€™s the world record value that is in question here.

The most extensive meteorological and historical arguments against the record Iโ€™m aware of come from a series of blog posts by storm chaser, climatologist, and weather observer William T. Reid, re-posted at Weather Underground here, which I did not read until after I did the calculations which follow. I have since read some of what Bill has written, and I encourage anyone with an interest in history to read his extensive summaries (along with old photos) of Greenland Ranch, where the world record temperature was recorded. He has done considerable library research and he found a letter from the ranch foreman who expressed disappointment that the measurements from the instrumented shelter provided by the U.S. Weather Bureau in 1911 were so much lower than what he measured under his veranda. Bill suspects (and I agree) that the reported values for some period of time might well have not been from the instrumented shelter.

The method I will use to demonstrate the near-certainty of a high bias was also included in a limited fashion in Reidโ€™s blog post (which contains a variety of meteorological arguments). I will apply the method to all years since 1911, and will show that the 134 deg. F record was approximately 10 deg. higher than what it should have been. The analyses I present are based upon the NOAA GHCN daily temperatures, with basic NOAA quality control procedures applied, thus they are from an โ€œofficialโ€ source. The GHCN dataset includes the 134 deg. F record high temperature from Death Valley.

How Can One Quality-Check the World Record Highest Temperature?

The main reason that the world record hottest temperature cannot be easily โ€œfact-checkedโ€ is that there were no other weather stations in Death Valley at the time, and the low elevation (below sea level) of Greenland Ranch is routinely tens of degrees F hotter than at the mountain stations, which are tens of miles away and thousands of feet higher.

Yet, from a meteorological standpoint, Death Valley in the summer is the perfect place to quality check those hot temperatures from more distant, higher-elevations stations. Before I explain the reasons why, letโ€™s first look at how Death Valley air temperatures compare to higher-elevation stations during July of this year (2024, which had near-record high temperatures), as well as during July of 1913. Following is a plot (Fig. 1) of July-average high temperatures (Tmax) for all stations within 100 miles of the Furnace Creek station (previously โ€œGreenland Ranchโ€, and today called Death Valley National Park [NP] station). Importantly, Iโ€™m plotting these average temperatures versus station elevation:

Fig. 1. July average maximum temperatures at stations within 100 miles of Furnace Creek, CA in 2024 (top) and 1913 (bottom), plotted against station elevation. The regression lines are fit to all stations except those near Greenland Ranch/Furnace Creek/Death Valley N.P.

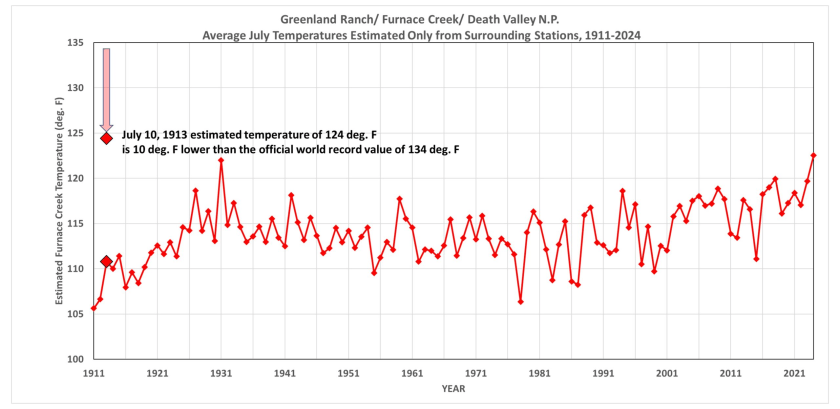
Note the strong relationship between station elevation and temperature in the 2024 data (top), something William Reid also noted. Significantly, the two lowest-elevation stations (in Death Valley) in 2024 have temperatures which are very close to the regression line that relates how the July-average high temperatures vary with station altitude (the two Death Valley stations, located below sea level, are not included in the regression). But in 1913 (bottom plot), the Greenland Ranch value departs substantially from what would be expected from the surrounding stations.

Regression lines like those in Fig. 1 can be computed in the other years, too, and used to statistically estimate what temperature the Furnace Creek station in Death Valley should have measured, based upon the surrounding, higher-altitude stations. This method allows us to estimate the Death Valley temperatures in each year, which is shown next in Fig. 2. (Bill Reid correctly points out that in the plots which follow, the results in the early years are from very few stations, and I agree that I should probably have used regression-derived lapse rates averaged from other years with more stations.)

Fig. 2. Yearly estimates of July average temperature at Furnace Creek, CA based upon all available GHCN stations within 100 miles of Furnace Creek. Each yearly estimate is based upon the station data from that year. The indicated estimate on July 10, 1913 (the date of the world record 134 deg. F reported reading) is 10 degrees cooler than the world record, at 124 deg. F. This 1-day estimate is based upon the surrounding stations only on that date. Note the 2024 value is about 0.5 deg. F above the value in 1931. Note that urban heat island effects (not accounted for here) might have biased the later half of the record to the warm side.

Meteorological Justification for the Methodology

There are solid meteorological reasons why one can use fairly distant, higher-elevation stations to check Death Valley temperatures in July. (Remember, my formal training is as a meteorologistโ€ฆ I only work in climate because it pays better. I actually took some of the temperature measurements contained in the GHCN daily dataset during summers in the late 1970s when I interned at the National Weather Service Office in Sault Ste. Marie, Michigan).

In simple terms, daytime temperatures during the warm season in dry, semi-desert or desert climates vary with altitude in a predictable and repeatable manner, and with little change over substantial distances. Evidence of this is shown in Fig. 1. This is much less true during the cool season, at night, or during cloudy (or even rainy) weather. This makes Death Valley in July one of the best places on Earth for fact-checking of very warm daytime temperature values. This applies very well to the southwestern U.S. in the summer (at least before monsoon rains arrive), where a semi-permanent high pressure ridge in May-July gets set up every year, with slowly subsiding (sinking) air producing mostly clear skies. This kind of weather feature has a large and uniform regional extent (unlike low pressure troughs, which can be sharp with strong horizontal temperature changes). This is related to something called the โ€œRossby radius of deformationโ€œ.

In simple terms, the warm, high pressure airmasses that settle in over the SW U.S. in July are spatially uniform, with strong daytime vertical mixing producing temperature lapse rates approaching the dry adiabatic value. This allows comparisons between temperature at stations up to (for example) 100 miles away. The big differences in temperatures between neighboring stations, then, are primarily due to altitude. Daytime temperatures in the summer in dry climates decrease rapidly with height (see Fig. 1), providing perfect meteorological conditions for doing the kind of comparison Iโ€™m describing here.

Estimated July Biases in the Greenland Ranch/Furnace Creek/Death Valley N.P.

Finally, we can examine the difference between the reported July average temperatures in Death Valley from the GHCN data and the estimates from the surrounding stations (Fig. 3).

Fig. 3. Estimated biases in the official GHCN July-average temperatures in Death Valley, CA based upon comparison to Death Valley estimates made from all stations within 100 miles of Furnace Creek. The 1-2 deg. F average bias over most of the record might well not be an actual bias in the official measurements, but instead a bias in the method described.

UPDATE: I will be updating Figs. 2 and 3 in a future blog post; I need to use more realistic lapse rate values in the early 20th Century when there were few stations with which to compute the lapse rate.

Note the substantial warm biases in the temperatures reported at Greenland Ranch in the first 10-15 years after the USWB installed the instrumented shelter. Again, as Bill Reid surmises, the ranch foreman was likely reporting values from a different thermometer that had poor exposure, next to a building. Also shown in green are data from a nearby station (5 miles away, at essentially the same elevation) called Cow Creek. Note that in the most recent decade, the Death Valley temperature estimates from surrounding stations agree with those measured at the current Death Valley N.P. observation site.

[I have not looked at how increasing urban heat island effects would change the details in Fig. 1-3. To the extent that urbanization has made the higher elevation stations warmer with time (I doubt urbanization is an issue at Furnace Creek), the method-estimated estimates will be correspondingly too warm, which will then cause a spurious upward trend in Fig. 2 and would reduce the computed biases seen in Fig. 3 over time, which is what we see.]

Conclusion

The bottom line is that I believe there to be sufficient quantitative evidence to say that the 134 deg. F world record hottest temperature, still recognized by the WMO and NWS, is as much as 10 deg. F too warm, likely due to observer error (which might well have been intentional). Again, for those interested in the history of Greenland Ranch (which includes the stories of those who died trying to escape the oppressive summer heat), read the fascinating history uncovered by Bill Reid, starting here.

The Climate Road to Serfdom in One Graph

Dr. Faig S Askerov, (self-described as the Former Regulatory Compliance and Environment Director, BP Azerbaijan, Georgia, and Turkey Region, PhD in Petrochemistry Scientist, Lecturer) hasย presentedย a graph and definitions that can be used as โ€œExhibit Aโ€ against the climate road to serfdom. At a time of political changeย againstย climate alarmism/forced energy transformation, even deep ecologists should question whether CO2 greening is better than wind, solar, battery industrialization.

GettyImages / Romolo Tavani

From Master Resource

By Robert Bradley Jr.

Dr. Faig S Askerov, (self-described as the Former Regulatory Compliance and Environment Director, BP Azerbaijan, Georgia, and Turkey Region, PhD in Petrochemistry Scientist, Lecturer) hasย presentedย a graph and definitions that can be used as โ€œExhibit Aโ€ against the climate road to serfdom. At a time of political changeย againstย climate alarmism/forced energy transformation, even deep ecologists should question whether CO2 greening is better than wind, solar, battery industrialization.

Greenhouse gas (GHG) calculations

1. Gross GHG Emissions

โ€ข Definition: Total emissions generated by an entity (such as a country, company, or individual) without accounting for any offsets or sequestration efforts.
โ€ข Example: A factory emits 100,000 tons of COโ‚‚ annually.

2. Net GHG Emissions

โ€ข Definition: Emissions after accounting for offsets, carbon removal, or carbon sequestration (e.g., planting trees, carbon capture technologies).
โ€ข Formula: Net GHG Emissions = Gross Emissions โ€“ (Carbon Offsets + Carbon Sequestration)
โ€ข Example: If the same factory invests in reforestation that absorbs 20,000 tons of COโ‚‚, its net emissions become 80,000 tons.

3. Carbon Neutrality

โ€ข Definition: Achieving a balance between emissions produced and emissions removed from the atmosphere through offsets. This doesnโ€™t require eliminating emissions but offsetting what remains.
โ€ข Achieved through: Renewable energy investments, Purchasing carbon credits or offsets
โ€ข Example:
A company emits 10,000 tons of COโ‚‚ but buys carbon credits from projects that absorb an equivalent amount, making it carbon-neutral.

4. Net-Zero Emissions

โ€ข Definition: Refers to reducing emissions as much as possible and using offsets or removals only for unavoidable emissions. The focus is more on eliminating emissions upfront rather than relying on offsets.
โ€ข Key Principles: Long-term, permanent reductions are prioritized. Any residual emissions must be balanced with direct removals (e.g., through carbon capture and storage).
โ€ข Example: A company redesigns operations to cut emissions by 95% and removes the remaining 5% through sequestration.

5. Zero Emissions (True Zero)

โ€ข Definition: Achieving no emissions at all from an activity, product, or process, without relying on any form of offsetting. This is technically challenging for most industries.
โ€ข Example: An electric vehicle that uses only renewable energy throughout its entire lifecycle could be considered a zero-emission vehicle.

6. Science-Based Targets

โ€ข Definition: Reduction targets aligned with the Paris Agreement goal of limiting global warming to 1.5ยฐC or 2ยฐC. Companies or governments commit to a pathway that includes GHG reduction milestones.
โ€ข Example: A company may aim to cut emissions by 50% by 2030 and reach net-zero by 2050.

7. GHG Protocol Scopes (1, 2, and 3)

โ€ข Scope 1: Direct emissions from owned or controlled sources (e.g., fuel combustion on-site).
โ€ข Scope 2: Indirect emissions from purchased electricity, heat, or steam.
โ€ข Scope 3: Indirect emissions from the supply chain and product use.

In summary, these different approaches to GHG calculations reflect varying levels of ambition and strategies. While carbon neutrality can be achieved through offsets, net-zero focuses more on eliminating emissions directly, with limited reliance on offsets for unavoidable emissions. Zero emissions is the most stringent target, aiming to produce no emissions at all.

Milibandโ€™s pledge to lower heating bills was always pure fantasy โ€“ now we have the proof

The game was up when Ed Miliband didnโ€™t come to the House to deliver a statement.

This is a man who loves to preach about his Clean Power project, and yet on Tuesday when the National Energy System Operator (Neso) finally published its analysis of hisย plans to decarbonise the entire electricityย grid in just five years, he was nowhere to be seen.

Itโ€™s becoming painfully clear that Labourโ€™s โ€˜clean powerโ€™ revolution will fail to deliver on its promises

The game was up when Ed Miliband didnโ€™t come to the House to deliver a statement.

This is a man who loves to preach about his Clean Power project, and yet on Tuesday when the National Energy System Operator (Neso) finally published its analysis of hisย plans to decarbonise the entire electricityย grid in just five years, he was nowhere to be seen. The Telegraph has the story.

If you read their report, you can understand why.

It makes for very difficult reading for an ideologue who spent the general election claiming he would cut household bills by ยฃ300 by delivering โ€œ100pc clean power by 2030.โ€ Instead, it makes clear that even with a โ€œHerculean effortโ€ โ€“ the words of the chief executive of the Neso โ€“ the best-case scenario is that costs remain the same.

Even this broken election promise โ€“ itโ€™s certainly not ยฃ300 off bills โ€“ is only achievable in a fantasy world where several impossible things magically happen at once.

First, Mr Miliband would have to rewrite the planning system, overcome global supply constraints and community dissent to build twice as many pylons and cables in the next five years as we have built in the last 10.

As even his own โ€œhead of mission controlโ€, Chris Stark, acknowledges, โ€œall planned transmission network projects must be built on time.โ€ If Ed doesnโ€™t deliver then consumers will be on the hook for billions of pounds in constraint payments, where we pay wind farms to simply switch off and sit idle.

Despite building more offshore wind than any other country bar China, we would need to contract as much offshore wind capacity in the next one to two years as in the last six combined.

As we have seen in the most recent auction round, which Mr Miliband bumped up, this approach is already driving up bills. Just last week the Institute for Fiscal Studies said that green levies, which people pay on top of their electricity bills, would rise by an extra ยฃ120 per household.

In a world where we are contracting vastly more wind power at breakneck speed, this will only go up. And even worse, the Neso report states that all of this upheaval would only cost the same as the current system if gas was priced at 100p per therm and if the carbon price rises to ยฃ147 per ton of carbon dioxide (tCO2) in 2030.

The problem? That forecast of gas prices is at the upper end of what Edโ€™s own department thinks is likely. Their central forecast is 70p per therm, and the current carbon price is just ยฃ38 per tCO2.

The International Energy Agency (IEA), the global energy watchdog, actually predicts that a global oversupply of gas is set to spark โ€œfierce competitionโ€ in the market and depress prices.

Even in a world where we unfeasibly build everything on time, despite going at a speed never before seen in this country, while battling with global supply constraints and shortages of skilled workers, Edโ€™s plans would only make sense for bill payers if he triples our carbon price, and gas prices are 42pc higher than his own departmental forecasts.

Read the full story here.

New Study: Antarctic Sea Ice Has Been Increasing Since The 1970sโ€ฆDue To Internal Decadal Variability

โ€œSince the late 1970s, Antarctic sea ice area (SIA) has slowly increased, despite significant global warming. The increase in Antarctic SIA occurred largely between 2000 and 2014.โ€

From NoTrickZone

Byย Kenneth Richard

โ€œSince the late 1970s, Antarctic sea ice area (SIA) has slowly increased, despite significant global warming. The increase in Antarctic SIA occurred largely between 2000 and 2014.โ€ โ€“ Bonan et al., 2024

Scientists attribute the long-term (1979-2022) expanding Antarctic sea ice trend, as well as the abrupt decline in sea ice extent from 2016 to 2019, to natural factors such as:

a) decadal variability

b) internal climate variability

c) intrinsic variability of the Southern Annular Mode (SAM)

d) El Niรฑo-Southern Oscillation (ENSO)

e) Indian Ocean Dipole (IOD)

f) ocean preconditioning

g) weakened circumpolar westerlies

h) zonal atmospheric wave structures

i) surface wind variability

j) Pacific decadal variability

k) Atlantic multi-decadal variability

The authors acknowledge that a โ€œunified understanding of how each process manifests spatially and temporally in the observational record is lacking.โ€

On the other hand, anthropogenic CO2 emissions are not considered as a contributing factor in 45 years of Antarctic sea ice expansion or decline.

Image Source:ย Bonan et al., 2024

Manchesterโ€™s ยฃ24m green network that doesnโ€™t contribute to net zero (and losesย money!)

The Manchester Energy Networkย uses a huge boiler on Lower Mosley Street to generate power, with excess heat from the system vented to major buildings in the city centre like Manchester Art Gallery, the Bridgewater Hall andย Manchester Centralย to keep them warm.

From NOT A LOT OF PEOPLE KNOW THAT

By Paul Homewood

Bosses have admitted โ€˜mistakes were madeโ€™ when setting up Manchesterโ€™s ยฃ24m green energy network.

The Manchester Energy Network uses a huge boiler on Lower Mosley Street to generate power, with excess heat from the system vented to major buildings in the city centre like Manchester Art Gallery, the Bridgewater Hall and Manchester Central to keep them warm.

But the council-owned network has lost more than ยฃ1m since being powered up in 2022. It was also billed as a greener way for the city to keep the lights on when town hall chiefs approved construction in 2018, but so far it has not helped meet net zero targets monitored by climate scientists at the Tyndall Centre.

Thatโ€™s because itโ€™s fuelled by gas generated from biomass, which is then certified as environmentally-friendly with Renewable Gas Guarantees of Origin (RGGOs). But the โ€˜credentialsโ€™ of RGGOs began to be questioned by the government in 2021 โ€” before the network even opened.

It was revealed earlier this year bosses ploughed on with using RGGOs because they โ€˜sought advice, but not from the Tyndall Centreโ€™.

That meant the ยฃ24m project could not help meet Manchesterโ€™s net zero targets, but it has replaced ageing infrastructure making โ€˜customerโ€™ buildings more efficient.

Now, Sarah Narici, the council boss brought in to steady the ship, has admitted โ€˜mistakes were madeโ€™ in the set-up of the system.

Appearing before a resources and governance scrutiny committee on Thursday (November 7), Ms Narici also confirmed RGGOs would no longer be used in the future. She said: โ€œThe arrangements have been made and continue to be there to exit from the RGGOs. These cannot contribute to our zero-carbon pathway.

โ€œPlease be assured the pathway put forwardโ€ฆ will fully comply with Tyndall Centre recommendations.โ€

While the move will satisfy some of the concerns over the network, more financial woes are expected to be reported at the end of the year. Thus far, the council-owned special purpose vehicle company has made a ยฃ1,324,202 loss in its first two years of operation.

Another loss is โ€˜likelyโ€™ for its third financial year which ended in April 2024, a council report from March said, with final accounts published in December.

https://www.manchestereveningnews.co.uk/news/greater-manchester-news/bosses-admit-mistakes-manchesters-24m-30318984