Death Valley World Record 134 deg. F is Biased ~10 deg. Too High

Over the years, a few commentators have have argued that the world record highest temperature of 134 deg. F at Death Valley, CA recorded on July 10, 1913 is physically implausible.

November 8th, 2024 by Roy W. Spencer, Ph. D.

Key Points:

  • Over the years, a few commentators have have argued that the world record highest temperature of 134 deg. F at Death Valley, CA recorded on July 10, 1913 is physically implausible.
  • Here I show quantitatively that the 134 deg F temperature is biased high, by about 10 deg. F.
  • Extensive historical research by William T . Reid has suggested the person making the temperature observations at Greenland Ranch likely replaced the official measurements from a thermometer in a Stevenson screen shelter with other measurements made next to the adobe living quarters.

Update #1 (11/8/2024): Fixed a few typos.

Update #2 (11/8/2024): For those messaging me about Furnace Creek temperatures reaching 130 deg. F in recent years, see Bill Reidโ€™s summary of side-by-side measurements made there [and reported at an AMS meeting] showing the non-aspirated โ€œofficialโ€ equipment produces temperatures 2-3 deg. too high during light wind conditions.

Update #3 (11/9/2024): Bill Reid corrected my use of the term โ€œmountainโ€ stations to describe those not in Death Valley. Many of those stations are at desert plateau sites, so I have changed the term to โ€œhigher elevationโ€ stations. I have also asked Bill to provide additional thoughts on this issue, which will be the next blog post here.

Background

The โ€œofficialโ€ world record highest near-surface air temperature is 134 deg. F, recorded in Death Valley, California on July, 10, 1913 at Greenland Ranch, California an isolated location with no similarly sited stations with which to compare (say, within 10 miles and below sea level). Greenland Ranch was a manmade oasis created by the Borax people around the turn of the 20th Century, with water piped in from a nearby mountain. It has a rich history, but always against a backdrop of oppressive summer heat that few visitors (and even workers) could endure.

As part of my new analyses of GHCN daily high and low temperatures, John Christy suggested I take a look at the Death Valley temperature data, and the record 134 deg. temperature in particular. Several people over the years have expressed concerns that the 134 deg. reading is implausibly high, but this has been difficult to prove. Both the World Meteorological Organization and NOAAโ€™s National Weather Service continue to recognize 134 deg. F as the world record. It is quite likely that Death Valley remains the hottest location in North America; itโ€™s the world record value that is in question here.

The most extensive meteorological and historical arguments against the record Iโ€™m aware of come from a series of blog posts by storm chaser, climatologist, and weather observer William T. Reid, re-posted at Weather Underground here, which I did not read until after I did the calculations which follow. I have since read some of what Bill has written, and I encourage anyone with an interest in history to read his extensive summaries (along with old photos) of Greenland Ranch, where the world record temperature was recorded. He has done considerable library research and he found a letter from the ranch foreman who expressed disappointment that the measurements from the instrumented shelter provided by the U.S. Weather Bureau in 1911 were so much lower than what he measured under his veranda. Bill suspects (and I agree) that the reported values for some period of time might well have not been from the instrumented shelter.

The method I will use to demonstrate the near-certainty of a high bias was also included in a limited fashion in Reidโ€™s blog post (which contains a variety of meteorological arguments). I will apply the method to all years since 1911, and will show that the 134 deg. F record was approximately 10 deg. higher than what it should have been. The analyses I present are based upon the NOAA GHCN daily temperatures, with basic NOAA quality control procedures applied, thus they are from an โ€œofficialโ€ source. The GHCN dataset includes the 134 deg. F record high temperature from Death Valley.

How Can One Quality-Check the World Record Highest Temperature?

The main reason that the world record hottest temperature cannot be easily โ€œfact-checkedโ€ is that there were no other weather stations in Death Valley at the time, and the low elevation (below sea level) of Greenland Ranch is routinely tens of degrees F hotter than at the mountain stations, which are tens of miles away and thousands of feet higher.

Yet, from a meteorological standpoint, Death Valley in the summer is the perfect place to quality check those hot temperatures from more distant, higher-elevations stations. Before I explain the reasons why, letโ€™s first look at how Death Valley air temperatures compare to higher-elevation stations during July of this year (2024, which had near-record high temperatures), as well as during July of 1913. Following is a plot (Fig. 1) of July-average high temperatures (Tmax) for all stations within 100 miles of the Furnace Creek station (previously โ€œGreenland Ranchโ€, and today called Death Valley National Park [NP] station). Importantly, Iโ€™m plotting these average temperatures versus station elevation:

Fig. 1. July average maximum temperatures at stations within 100 miles of Furnace Creek, CA in 2024 (top) and 1913 (bottom), plotted against station elevation. The regression lines are fit to all stations except those near Greenland Ranch/Furnace Creek/Death Valley N.P.

Note the strong relationship between station elevation and temperature in the 2024 data (top), something William Reid also noted. Significantly, the two lowest-elevation stations (in Death Valley) in 2024 have temperatures which are very close to the regression line that relates how the July-average high temperatures vary with station altitude (the two Death Valley stations, located below sea level, are not included in the regression). But in 1913 (bottom plot), the Greenland Ranch value departs substantially from what would be expected from the surrounding stations.

Regression lines like those in Fig. 1 can be computed in the other years, too, and used to statistically estimate what temperature the Furnace Creek station in Death Valley should have measured, based upon the surrounding, higher-altitude stations. This method allows us to estimate the Death Valley temperatures in each year, which is shown next in Fig. 2. (Bill Reid correctly points out that in the plots which follow, the results in the early years are from very few stations, and I agree that I should probably have used regression-derived lapse rates averaged from other years with more stations.)
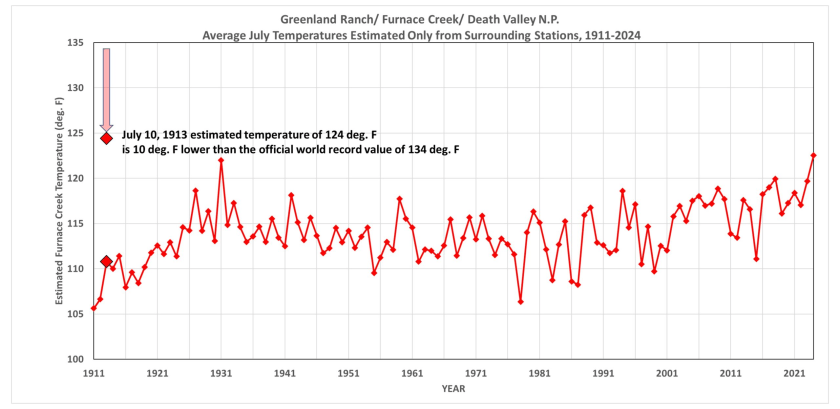
Fig. 2. Yearly estimates of July average temperature at Furnace Creek, CA based upon all available GHCN stations within 100 miles of Furnace Creek. Each yearly estimate is based upon the station data from that year. The indicated estimate on July 10, 1913 (the date of the world record 134 deg. F reported reading) is 10 degrees cooler than the world record, at 124 deg. F. This 1-day estimate is based upon the surrounding stations only on that date. Note the 2024 value is about 0.5 deg. F above the value in 1931. Note that urban heat island effects (not accounted for here) might have biased the later half of the record to the warm side.

Meteorological Justification for the Methodology

There are solid meteorological reasons why one can use fairly distant, higher-elevation stations to check Death Valley temperatures in July. (Remember, my formal training is as a meteorologistโ€ฆ I only work in climate because it pays better. I actually took some of the temperature measurements contained in the GHCN daily dataset during summers in the late 1970s when I interned at the National Weather Service Office in Sault Ste. Marie, Michigan).

In simple terms, daytime temperatures during the warm season in dry, semi-desert or desert climates vary with altitude in a predictable and repeatable manner, and with little change over substantial distances. Evidence of this is shown in Fig. 1. This is much less true during the cool season, at night, or during cloudy (or even rainy) weather. This makes Death Valley in July one of the best places on Earth for fact-checking of very warm daytime temperature values. This applies very well to the southwestern U.S. in the summer (at least before monsoon rains arrive), where a semi-permanent high pressure ridge in May-July gets set up every year, with slowly subsiding (sinking) air producing mostly clear skies. This kind of weather feature has a large and uniform regional extent (unlike low pressure troughs, which can be sharp with strong horizontal temperature changes). This is related to something called the โ€œRossby radius of deformationโ€œ.

In simple terms, the warm, high pressure airmasses that settle in over the SW U.S. in July are spatially uniform, with strong daytime vertical mixing producing temperature lapse rates approaching the dry adiabatic value. This allows comparisons between temperature at stations up to (for example) 100 miles away. The big differences in temperatures between neighboring stations, then, are primarily due to altitude. Daytime temperatures in the summer in dry climates decrease rapidly with height (see Fig. 1), providing perfect meteorological conditions for doing the kind of comparison Iโ€™m describing here.

Estimated July Biases in the Greenland Ranch/Furnace Creek/Death Valley N.P.

Finally, we can examine the difference between the reported July average temperatures in Death Valley from the GHCN data and the estimates from the surrounding stations (Fig. 3).

Fig. 3. Estimated biases in the official GHCN July-average temperatures in Death Valley, CA based upon comparison to Death Valley estimates made from all stations within 100 miles of Furnace Creek. The 1-2 deg. F average bias over most of the record might well not be an actual bias in the official measurements, but instead a bias in the method described.

UPDATE: I will be updating Figs. 2 and 3 in a future blog post; I need to use more realistic lapse rate values in the early 20th Century when there were few stations with which to compute the lapse rate.

Note the substantial warm biases in the temperatures reported at Greenland Ranch in the first 10-15 years after the USWB installed the instrumented shelter. Again, as Bill Reid surmises, the ranch foreman was likely reporting values from a different thermometer that had poor exposure, next to a building. Also shown in green are data from a nearby station (5 miles away, at essentially the same elevation) called Cow Creek. Note that in the most recent decade, the Death Valley temperature estimates from surrounding stations agree with those measured at the current Death Valley N.P. observation site.

[I have not looked at how increasing urban heat island effects would change the details in Fig. 1-3. To the extent that urbanization has made the higher elevation stations warmer with time (I doubt urbanization is an issue at Furnace Creek), the method-estimated estimates will be correspondingly too warm, which will then cause a spurious upward trend in Fig. 2 and would reduce the computed biases seen in Fig. 3 over time, which is what we see.]

Conclusion

The bottom line is that I believe there to be sufficient quantitative evidence to say that the 134 deg. F world record hottest temperature, still recognized by the WMO and NWS, is as much as 10 deg. F too warm, likely due to observer error (which might well have been intentional). Again, for those interested in the history of Greenland Ranch (which includes the stories of those who died trying to escape the oppressive summer heat), read the fascinating history uncovered by Bill Reid, starting here.

USA Oil Production Sets World Recordโ€ฆ Again

Despite the worst efforts of the incontinent temporary occupant of the White Houseโ€ฆ

From Watts Up With That?

Guest โ€œFracking A Bubba!โ€ by David Middleton

Despite the worst efforts of the incontinent temporary occupant of the White Houseโ€ฆ

MARCH 11, 2024

Data source:ย U.S. Energy Information Administration,ย International Energy Statistics

The United States produced more crude oil than any nation at any time, according to our International Energy Statistics, for the past six years in a row. Crude oil production in the United States, including condensate, averaged 12.9 million barrels per day (b/d) in 2023, breaking the previous U.S. and global record of 12.3 million b/d, set in 2019. Average monthly U.S. crude oil production established a monthly record high in December 2023 at more than 13.3 million b/d.

The crude oil production record in the United States in 2023 is unlikely to be broken in any other country in the near term because no other country has reached production capacity of 13.0 million b/d. Saudi Arabiaโ€™s state-owned Saudi Aramco recently scrapped plans to increase production capacity to 13.0 million b/d by 2027.

Together, the United States, Russia, and Saudi Arabia accounted for 40% (32.8 million b/d) of global oil production in 2023. These three countries have produced more oil than any others since 1971 (counting production in the Russian Federation of the Soviet Union prior to 1991), although the top spot has shifted among them over the past five decades. By comparison, the next three largest producing countriesโ€”Canada, Iraq, and Chinaโ€”combined produced 13.1 million b/d in 2023, only slightly more than what was produced in the United States alone.

Data source:ย U.S. Energy Information Administration,ย International Energy Statistics

After peaking at 9.6 million b/d in 1970, annual U.S. crude oil production flattened and then generally declined for decades to a low of 5.0 million b/d in 2008. Crude oil production in the United States began increasing again in 2009, as producers increasingly applied hydraulic fracturing and horizontal drilling techniques, and has increased steadily since. The only exception to U.S. production growth since 2009 was in 2020 and 2021, when demand and prices decreased because of the economic effects of the COVID-19 pandemic. In recent years, crude oil production in the Permian Basin (in western Texas and eastern New Mexico) drove the increases in total crude oil and natural gas production in the United States.

Russia was the country with the most crude oil production in 2017, but production growth in Russia has since lagged behind the United States. Average annual production in Russia peaked in 2019 at 10.8 million b/d, when it trailed the United States by 1.4 million b/d. More recently, Russia was among the OPEC+ countries that announced production cuts in November 2022, and in February 2023, it separately announced additional voluntary cuts of 500,000 b/d. Although voluntary cuts have reduced recent production in Russia, we believe sanctions and voluntary actions by companies in response to the full-scale invasion of Ukraine have been the primary cause of the cuts. Actual cuts to production appear to be smaller than anticipated, however, and we estimate that production in Russia declined by only 200,000 b/d in 2023.

Average annual production in Saudi Arabia peaked in 2022 at 10.6 million b/d, which was 1.3 million b/d less than in the United States that year. In 2023, crude oil production in Saudi Arabia declined by about 900,000 b/d because of OPEC+ cuts and further voluntary cuts Saudi Arabia made to offset weaker demand growth. Production in Saudi Arabia could not exceed the 2023 production volume in the United States because state-owned Saudi Aramcoโ€™s stated production capacity is 12.0 million b/d, with about 300,000 b/d of additional capacity from its share of the Neutral Zone area shared with Kuwait.

Principal contributor: Erik Kreil

Tags: international, Saudi Arabia, United States, liquid fuels, crude oil, Russia, oil/petroleum, production/supplyUS Energy Information Administration

The growth in US oil production has come from areas where the Federal government has little or no control over leasing and productionโ€ฆ

US Energy Information Administration

The Permian Basin

Check out our time seriesย animation of Permian Basin production

The most prolific oil producing region, the Permian Basin of Texas and New Mexico, has accounted for the vast majority of the production increase. This has been largely due to improvements in oil recovery from both new and existing wellsโ€ฆ

US Energy Information Administration

While virtually all of the Permian Basin of Texas is under private or state lands, where Biden has no control, much of New Mexicoโ€™s portion of the Permian Basin is on Federal lands. Democrats at the state and Federal levels have been slowly restricting leasing and drilling in New Mexico:

Decisions by federal and state officials last week will limit where New Mexicoโ€™s powerful oil and gas industry is able to drill. 

On Friday, Secretary of the Interior Deb Haaland announced that the department will soon ban new oil and gas leases on more than 330,000 acres of public lands within a 10-mile radius of Chaco Culture National Historical Park โ€” a UNESCO World Heritage Site of deep cultural importance to the regionโ€™s Pueblo and Tribal nations. 

The day before, the New Mexico Commissioner of Public Lands instituted a moratorium on new oil and gas leases on state trust lands within one mile of schools, daycare centers, and sporting fields used by students. Grist

Ironically, oil and gas revenues currently account for about 1/3 of the stateโ€™s education budget.

Gulf of Mexico

The second most prolific region, the Federal waters of the Gulf of Mexico, has seen no growth in production due to the Biden maladministrationโ€™s war on oil & gas leasing, permitting and drillingโ€ฆ

Offshore oil and gas permitting plummets to 2-decade low under Biden

Without stable permitting and leasing, producers may leave for โ€˜regions with a more predictable regulatory environment,โ€™ industry group says

 By Thomas Catenacci Fox News

Published October 12, 2023 11:41am EDT

Offshore oil and gas permitting under President Biden has fallen to a low the energy industry has not experienced since the Bush administration two decades ago, according to federal data reviewed by Fox News Digital.

Since January 2021, when Biden took office, the federal government has approved applications for permit to drill on just 157 new wells, according to the data compiled by Department of the Interiorโ€™s Bureau of Safety and Environmental Enforcement (BSEE). The figure represents a 29% decline compared to the same period under the Trump administration and a 55% decline compared to the same period under the Obama administration.

โ€œPolicymakers should leverage the Gulf of Mexico to help meet growing global oil demand,โ€ Erik Milito, the president of the National Ocean Industries Association, told Fox News Digital. โ€œThe Gulf of Mexico is a prime example of doing more with less.โ€

โ€œWe were producing more than 2 million barrels of oil per day in the Gulf of Mexico prior to the pandemic, despite the number of active lease blocks being much lower than they were 5, 10, or 15 years ago,โ€ he continued. โ€œWe produce a massive amount of energy with a small footprint. However, bottlenecking the permitting process is a surefire way to discourage the success of the region despite growing global demand.โ€

[โ€ฆ]Fox News

The most recent malfeasance was an attempt to essentially halt all future leasing on the shelf edge to protect a fake whale species.

Louisiana et al. vs Deb Haaland et al.

Riceโ€™s whales are primarily located in the yellow and back outlined area in the Eastern Gulf of Mexico, an area off-limits to oil & gas exploration. The Biden administration attempted to illegally remove the โ€œRiceโ€™s Whale Expanded Areaโ€ (dark blue area on map below) from this, and all future, lease sales.

When Lease Sale 261 was finally held after numerous court orders, it drew the most interest since 2015.

Lease Sale 261 brings in more than $382 million in high bids

Dec. 20, 2023

Lease Sale 261 reported to be the largest oil and gas lease auction since 2015.

Offshore staff

NEW ORLEANS โ€“ The Bureau of Ocean Energy Management (BOEM) reports that Lease Sale 261 generated $382,168,507 in high bids for 311 tracts covering 1.7 million acres in federal waters in the US Gulf of Mexico. 

BOEM says that a total of 26 companies participated in the lease sale, submitting 352 bids totaling $441,896,332.

Among the winners were Chevron, BP, Shell, Equinor, Repsol, Woodside Energy, Occidental Petroleum, Murphy Oil, Talos Energy, and Kosmos Energy. 

[โ€ฆ]Offshore Magazine

The red blocks indicate leases that drew bids in Sale 261.

Click here to open PDF

While the lamestream media incessantly tries to credit Biden for record US oil production, the fact is that his maladministration has routinely flouted the law in their treasonous war on the US oil & gas industryโ€ฆ

Biden: I Wanted โ€˜to Stop All Drillingโ€™ on the Coasts and Gulf, Got Blocked by Courts

by IAN HANCHETT 8 Aug 2023

During an interview with The Weather Channel that is set to air on Wednesday, a portion of which aired on Tuesday, President Joe Biden said that he โ€œwanted to stop all drilling on the East Coast and the West Coast and in the Gulfโ€ but was blocked by the courts from doing so.

[โ€ฆ]Breitbart

Joe fought the law andโ€ฆ