Global warming, climate change, all these things are just a dream come true for politicians. I deal with evidence and not with frightening computer models because the seeker after truth does not put his faith in any consensus. The road to the truth is long and hard, but this is the road we must follow. People who describe the unprecedented comfort and ease of modern life as a climate disaster, in my opinion have no idea what a real problem is.
When it comes to tackling climate change, the focus tends to be on ‘clean energy’ solutions – the deployment of renewable or nuclear energy; improvements in energy efficiency; or transition to low-carbon transport. Indeed, energy, whether in the form of electricity, heat, transport or industrial processes, account for the majority – 76% – of greenhouse gas (GHG) emissions.
When it comes to tackling climate change, the focus tends to be on ‘clean energy’ solutions – the deployment of renewable or nuclear energy; improvements in energy efficiency; or transition to low-carbon transport. Indeed, energy, whether in the form of electricity, heat, transport or industrial processes, account for the majority – 76% – of greenhouse gas (GHG) emissions.1
But the global food system, which encompasses production, and post-farm process such as processing, and distribution is also a key contributor to emissions. And it’s a problem for which we don’t yet have viable technological solutions.
The most worrying thing about this is that they are even wanting to quantify emissions from farming.
If there is anything that should be excluded from the Net Zero madness, it is agriculture. Nothing can be more important to the world than food, no matter how much GHGs are emitted.
What leads a country to begin winding down domestic oil and gas production while promoting the use of imported wood – a wasteful and inefficient fuel — for power generation?
What leads a country to begin winding down domestic oil and gas production while promoting the use of imported wood – a wasteful and inefficient fuel — for power generation?
What leads policymakers to shut down a nation’s last and still-functional coal generating power plant after almost 150 years of using coal and within months arrive at a situation where blackout prevention notices have to be issued to its power generators?
The Western World is in a hypnotic trance from 30 years of relentless propaganda pushing climate alarmism.
Energy Policy Mayhem
Evidence abounds of the mayhem that passes for energy policy in the West. It is only appropriate to start with Germany, the epicentre of the green trance that policymakers there have been hypnotized into. This follows decades of worship in the Church of Climate in the media and spouted by its intellectual chattering class.
Let’s start with the destruction of thousands of acres of ancient Teutonic forests – the setting for the folktales of the Brothers Grimm — to make way for wind farms. The irony is lost on Germany’s green ideologues that their energy policies threaten endangered species of birds and bats in its sacrifices at the altar of Mother Gaia. Consecrating thousands of windmill crucifixes with arms of petroleum-based glass-fiber-reinforced polyester resins manufactured in Chinese furnaces fueled by coal or natural gas may seem particularly absurd to those not steeped in that miasma of green ideology.
Another example of Germany’s green lunacy include the shutting down of their nuclear power plants, only to then approve putting dirty lignite-fired power plants back online for German households to keep warm in the winter of 2022/23.
German commentator Pierre L. Gosselin published an article earlier this year that asked bluntly, “The ‘greener’ Germany gets, the bloodier its economy becomes. How much can an economy bleed before it dies?” Adding to the economic gloom afflicting the country for the past two years, Reuters reported in July that the economy is expected to contract by 0.2% in 2024 from a previous projection of an anaemic 0.3% growth. It beggars belief to call this an “unexpected” contraction as the news wire does when the link between high energy costs and deindustrialization has been so widely discussed in the media.
Let’s turn to other absurdities. We recently learned that in the wisdom of Scandinavian planners, dairy farmers in Denmark face having to pay an annual tax of 672 krone ($96) per cow “for the planet-heating emissions they generate.” This policy proposal came in the wake of widespread farmers’ protests in Europe which escalated – across the width and breadth of the continent, from Sweden to Spain, Poland to Portugal — since they first started in the Netherlands in October 2019.
The Great European Farmer Revolt led to the shocking win in March by the populist Farmer-Citizen Movement (BBB) in the Netherlands, putting it ahead of the governing party in the Senate. In a reaction to left-wing green parties in government, farmers became an important part of the equation in the country’s political future. As part of the EU Green Deal to make agriculture consistent with being “carbon-neutral” by 2050, Brussels’ bureaucrats assured their citizens that their farms would be rendered more “sustainable”, “environmentally friendly” and “biodiverse.”
Perhaps the pride of place belongs to Ed Miliband (“Mad Ed”), UK’s Secretary of State for the oxymoronically-named Department of Energy Security and Net Zero. UK’s “net zero” policies, pursued by both the Conservatives, in power for 14-years, and the new Labour government, have compromised the country’s energy security like nothing else. In Mad Ed’s short time in office, the country’s last coal plant and its Port Talbot steel plant shut down, regulatory approvals for solar farms were rushed through over-riding local community objections, and the North Sea’s oil and gas field development have been sacrificed to an unchallenged climate lawsuit launched by Greenpeace.
Unsurprisingly, it was reported in July that Britain fell out of the top ten manufacturing nations list for the first time. Mr. Miliband’s decision not to challenge a lawsuit filed by Greenpeace has compromised the country’s investment environment. According to Brendon Long, director of research at investment company Zeus Capital, Mr. Miliband’s decision would put wider investment in Britain at risk. He said: “London has fallen out of the top 10 capital markets in terms of monies raised from initial public offerings. That might reflect that financial markets are increasingly concerned with the UK as a jurisdiction that values and defends property rights and the sanctity of honouring agreements made.”
To be fair to Mad Ed, some of these developments were already underway during the previous Tory government’s term of office. Nevertheless, he has built up a CV that would be the envy of the wildest left-wing Brussels bureaucrat. One could even ignore his cringe-worthy bizarre video of him singing and strumming a ukulele in front of a windmill.
But most egregious in the Labour government’s short record of rule is its move to cut winter fuel payments for millions of pensioners while pledging nearly £22bn for projects in unproven technologies to capture and store carbon dioxide emissions. Rubbing salt into the wound, Ed Miliband insisted in July that Labour will honour its pledge of £11.6bn in overseas climate aid.
It is not much better across the pond. President Biden promised to make climate change front and center of his administration’s policies across the whole of government. This has been followed by the duplicitously-named Inflation Reduction Act which unleashes a debt-driven tsunami of subsidies on favoured “green” industries – solar, wind, EVs, batteries, hydrogen. I have written on Biden’s fractured and contradictory energy policies elsewhere (here, here and here).
Models Not Fit For Purpose
These absurd and immiserating “net zero” policies of the West imposed at great cost to ordinary working men and women are justified by the true believers in the Church of Climate by invocations of the “climate crisis”. Mr. Miliband and his ilk would respond along the lines that when the house is on fire, you don’t muck about but do “whatever it takes”. Doubtless, the lockdown and vaccination mandates imposed by “experts” in response to Covid would be offered as an example.
These twin hysterias – Covid and climate — share much in common. Both spring from not-fit-for-purpose and impossible to validate computer models that escalated alleged risks on flimsy assumptions. An unpublished 16th March 2020 bombshell report by Professor Neil Ferguson of Imperial College, London, warned of 510,000 deaths in the country if the country did not immediately adopt a Covid suppression strategy.
By March 25th, Ferguson’s predicted half a million fatalities in the UK was adjusted downward to “unlikely to exceed 20,000”, a reduction by a factor of 25. This drastic reduction was credited to the UK’s lockdown which, however, was imposed only 2 days previously. It was later found that Dr. Ferguson’s model was not fit for purpose.
Much as Ferguson’s model drove governments to impose Covid lockdowns affecting nearly 3 billion people on the planet, Professor Michael Mann’s “hockey stick” model was used by the UN’s IPCC, mainstream media and politicians to push the man-made global warming (now called climate change or climate crisis) hysteria over the past two decades. But like Prof Ferguson’s model, Dr. Mann’s work seems more in keeping with junk science.
Hysteria attracts governments, activist academics in search of research grants, and left-wing billionaire foundations that support the vast enterprise that is the climate industrial complex. The great essayist H.L. Mencken had this to say about governments: “The whole aim of practical politics is to keep the populace alarmed (and hence clamorous to be led to safety) by menacing it with an endless series of hobgoblins, all of them imaginary.”
But it would be naïve to view the climate industrial complex as a vast conspiracy. Steve Koonin in his book Unsettled offers a more plausible explanation, seeing a “self-reinforcing alignment of perspectives and interests” devoted to promoting climate alarm. Thus, governments do practical politics a la Mencken, hubristic academics “save the planet” with junk science and hyperbolic claims, NGO’s and crony businesses grift for regulatory rents, intellectuals virtue signal with luxury beliefs and the mass of followers know little but feel a lot.
Hurricane Milton is heading towards Florida, bringing “potentially catastrophic” winds, storm surges and heavy rainfall, American forecasters have warned.
The storm is due to hit the heavily-populated city of Tampa Bay less than two weeks after the state was badly hit by Hurricane Helene.
Milton is the ninth hurricane of the 2024 Atlantic season, which continues until the end of November.
Being the BBC though, they just could not resist the usual disinformation:
This is what the IPCC actually say:
In other words, there is no evidence of trends either in the frequency or intensity of hurricanes.
The IPCC also state:
It is generally accepted that Atlantic hurricanes tend to be weaker during the cold phase of the AMO, which ran from the 1970s to 90s. But clearly the longer term data, which extends back to the 19thC, trumps any shorter term data, particularly given the known ocean cycles.
Yet there is no mention of the longer term trends by the BBC. Nor is there mention of this very clear statement from NOAA regarding both US and Atlantic hurricanes:
To cap it all, the BBC even include this deliberately deceitful chart:
The apparent increase in major Atlantic hurricanes since 1920 is due to the fact that we now have satellites to observe them in mid-ocean. This is why there is a step change in the 1990s.
A glance at US landfalling hurricanes shows there is clearly no long term increase in the strongest hurricanes:
Where would the world be today or tomorrow without gas or coal? Short answer: nowhere!
Coal and Gas make up 60% of global electricity and 50% of global primary energy. In China and India alone electricity from coal and gas account for about 65% and 75% respectively of the overall mix.
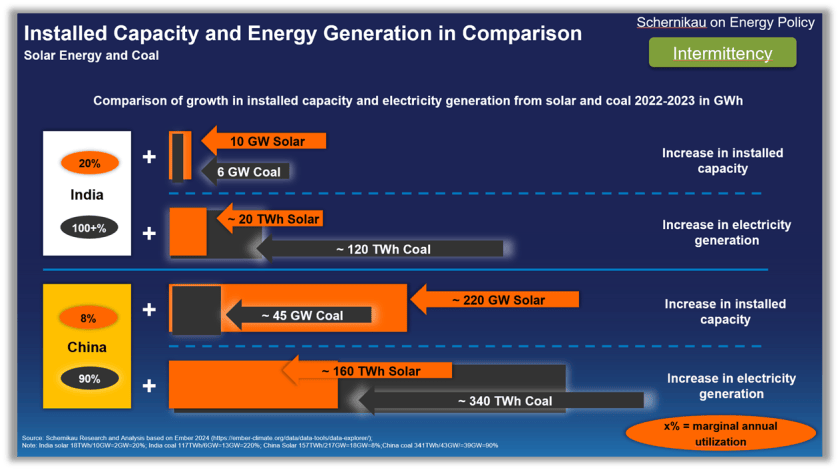
In 2023 alone, China added over 40 GW of coal capacity and generated 340 TWh of additional electricity from coal (more than half of entire Germany)
India added 6 GW of coal capacity and generated 120 TWh of additional electricity from coal
China: 220 GW added solar capacity and 160 TWh added power from Solar (India: 10 GW added solar capa, and 20 TWh power, see Figure 1)
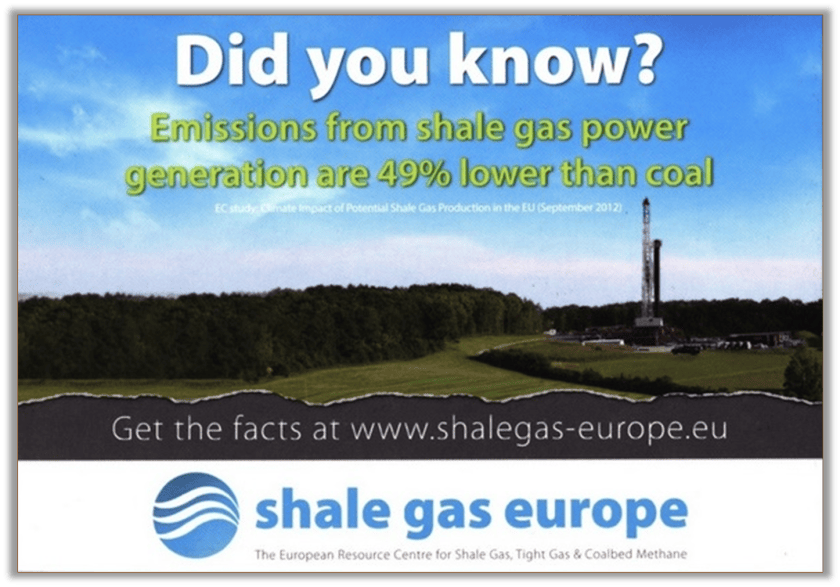
Most banks and government institutions support gas, but not coal as many scientific papers and most reports. They are modeling an economic pathway with “fewer emissions”, assuming that gas emits about half the “greenhouse gases” that coal does. Therefore, gas has been considered the “bridge towards the transition”.
Case in point of course, Germany. Germany’s energy policy towards so called “net-zero” relied on Russian gas to provide the “bridge” towards the desired “zero-emission future”. The Russian attack on the Ukraine put a forceful stop to that policy.
Liquified natural gas, LNG, reduces the dependence on pipelines and allows new suppliers and consumers to enter the market, making it seaborne. Southeast Asia and Europe, and so many more regions, started to take advantage of this new influx of “cleaner” fuel to power their thermal power plants
Then the year 2022 marked the big turning point. LNG prices skyrocketed, as Europe literally swept up the entire market and left close to “nothing” for developing nations. Heightened risks of grid failures in Bangladesh [1,2] and Pakistan [3] where just one of the many consequences.
Let’s have a look at Gas vs Coal. Is there a favorite? Can someone like me even answer such a question? Probably not completely unbiased, but let me try to give you a rundown anyway… to allow you to form an informed opinion about coal and gas.
Figure 1: 2023 wind and solar additions in India and China
Coal and gas use an established, relatively simple technology for power generation consisting of boilers, turbines, and generators. Looking at combustion for power generation only, the key advantages of gas include:
Gas burns cleaner than coal, leaving less residue and causing less particle emissions. Since gas is invisible, it also appears cleaner to transport
Gas has a higher thermal efficiency than coal during combustion
Gas power plants can be used as “peaker plants” as they ramp up and down in minutes, faster than coal, which may ramp up and down slightly slower.
There are four key advantages of coal.
Usually, not always, lower cost than gas (especially upfront investment and transportation/processing costs)
Insignificant geopolitical concerns with reserves more evenly spread around the globe with difficult to control production and transportation (because of simplicity)
Simple transportation (no pipelines, LNG terminals, regasification equipment, etc)
High energy security, coal can be stored easily with less risk (no dependency on pipelines, no tanks required, no risk of explosion)
A CEO of a medium sized US utility that switched from coal to gas for economic reasons and under “ESG pressure”, recently summarized it as follows:
“Gas is great, but still… I used to have 4 months of energy supply in my backyard, today I wake up every morning praying that there is no problem with the gas pipeline, because I have millions of customers to serve every day. My energy security is far reduced”.
Let me reiterate that we need both gas and coal for our modern existence today and we will need it tomorrow. Personally, I am convinced that we need much more of both. The choice of coal or gas or both depends on each country’s specific geographical and geological situations, which makes it obvious why Saudi Arabia uses gas, India uses coal, and why the US uses both.
However, I sense that the biggest misunderstanding about both coal and gas is their importance as a raw material input (nothing to do with energy). There is hardly any product that we use that does not require either both or at least gas or coal as a chemical “raw material” input (your phone, clothes, your car, food, your house, computers, solar panels, on and on it goes).
For example, the importance of coal for solar panels is summarized in my recent article “Coal’s importance for solar panel manufacturing”.
What is gas, what is coal, and what do we use it for?
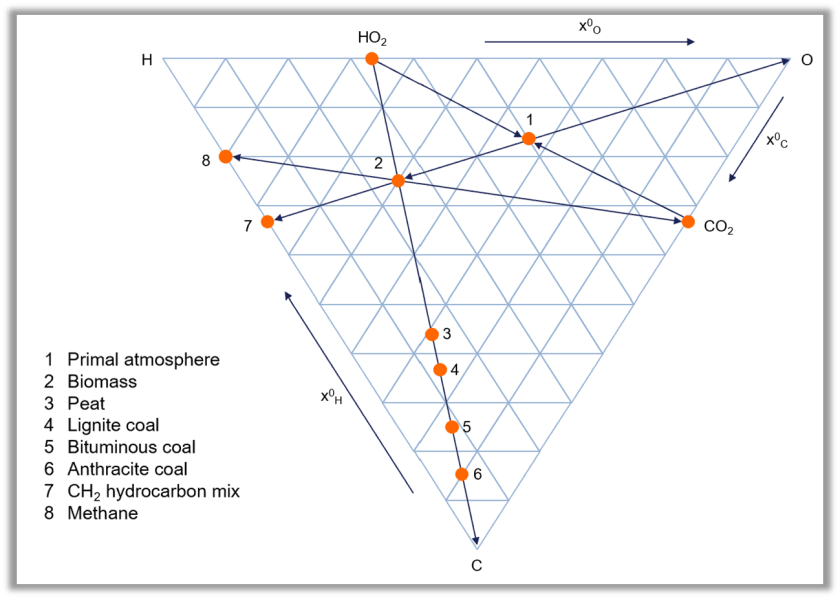
Natural gas or methane – simplified – is a hydrocarbon (CH4), consisting of one atom of carbon and four atoms of hydrogen. It is an energy dense gas, denser than hydrogen alone, and that is because of carbon. Carbon literally is a chemical miracle worker when it comes to hydrogen. Combined with hydrogen, carbon forms highly versatile and energetic “hydrocarbon” gaseous, liquid, and solid fuels (Figure 2). Higher carbon ratios yield solids and lower ratios yield gases, all possible at typical ambient temperatures and pressures. There is no need for complex equipment or pressure chambers.
Natural gas is considered a “fossil fuel” that developed from ancient plants and animals, tens to hundreds of millions of years ago. It is believed that both oil and natural gas originated from the remains of ancient marine organisms. Natural gas is extracted from underground reserves, often in combination with oil before it is “conditioned” for transport to the final consumer. Such conditioning may be as simple as preparing and sending it through a pipeline or as difficult as “making” liquified natural gas or LNG, a very cold and pressurized liquid form of gas. A fun fact, at −160°C the liquid gas volume reduces by a factor of about 600.
As per latest available resource information the from German BGR 2024 [18] we have over 200 years of known gas remaining potential available at current production rates. Remaining potential is the sum of known reserves and resources. Of course, new resources are being discovered continuously and technological advances continue to increase “the remaining life of fossil fuels”.
What is gas used for? Here are 5 main applications:
Power generation (about 25% of global power comes from gas)
Household heating and cooking
Industrial heat (glass, cement, other product manufacturing)
Feedstock for fertilizers (production of ammonia)
Other raw material input (plastics, paint, pharmaceuticals, other products)
Coal on the other hand is a solid, largely consisting of the element carbon, mined from either underground or surface mines around the world, resulting in almost 9 Bln tons p.a., making up almost 10% of all “raw materials” we mine or grow annually for human existence. Coal is also considered a “fossil fuel” that basically comes from very old trees and plants, pressurized under airtight conditions for tens to hundreds of millions of years.
Coal is one of the few raw materials that we mine that can be used as is, without further processing or cleaning. Regardless, a significant portion of coal is processed in so called “washeries” to reduce the ash (silica or sand) content to upgrade the coal and increase the carbon content.
The German BGR 2024 [19] global analysis states that we have over 2,000 years of known hard coal remaining potential available, and over 3,000 years of lignite coal, at current production rates. Remaining potential is the sum of known reserves and resources.
There are many types of coals, depending on how old the coal is and what the geological conditions of coalification were. On average, older coal is more valuable than younger coal, but it is not always true. Two main types of coal exist: (1) metallurgical coal including coking coal and anthracites, but there is more; and (2) coal that is used primarily for thermal applications, often referred to as thermal coal.
As such, the main uses for coal include the following:
Power generation (about 35% of global power comes from coal)
Industrial heat (glass, cement, other product manufacturing)
Steel making (2/3rd of global 2 Bln tons p.a. of steel are only possible because of coal)
Other raw material input through chemical reduction and other processes (silicon for computers or solar panels, chrome, nickel, aluminum, + much more such as fly ash for cement products)
Household heating (being phased out, rightly so)
Source for critical minerals and fertilizer using humates
All chemical and physical details on coal can be accessed via Kindle or in print at “Schernikau’s Coal Handbook”
Figure 2: Fuels in a Thermodynamic System C-H2-O2; Conversion of Carbohydrate to Coal, Methane and Liquid Hydrocarbons Source: Wolf 2021, from our book www.unpopular-truth.com (downloadable image available there)
The current “switching” sentiment: coal, gas, and hydrogen
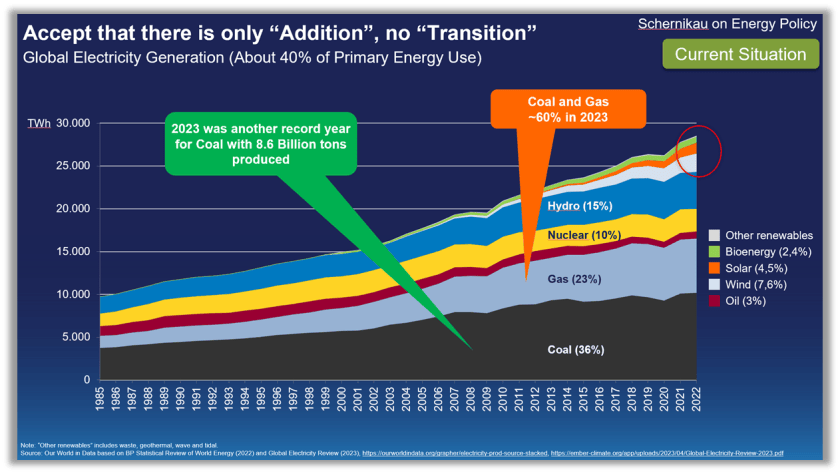
The percentage of gas in the global electricity mix has been increasing over the past two decades from about 20% in 2004 to 25% in 2023. During the same time, coal’s share of electricity reduced from 40% to just over 35%. While both coal and gas continued growing in absolute terms (Figure 3) and retained their combined share essentially unchanged, this “switch” from coal to gas was driven by two reasons:
Economic: low-cost fracking made additional abundant gas resources available especially in the US
Political: the believe that gas has less “climate impact” than coal
Global Energy Monitor’s “Global Coal Plant Tracker” [17] – an anti-coal organization – noted that the number of countries with coal power under development (pre-construction and construction) has nearly halved from 75 in 2014 to 40 in 2024. China and India combined account for 86% of current development.
They also note that new coal-fired power station proposals continue to outpace cancellations. In the first half of 2024, over 60GW of coal capacity was newly proposed or revived, compared to the 34GW that was shelved or cancelled over the same period. China plans for 1.3 Bln annual tons of new coal mine capacity. So, coal is expanding! Despite this many governments and organizations predict peak coal by end of this decade… we shall see.
Gas is expanding even faster. Coal and gas have been “competing” for decades and gas is still favored by many governments. The gas industry, closely linked to the oil industry, is generally better funded for industrial policy and lobbying than coal. The gas industry has also specifically targeted coal in some of its advertising (Figure 4).
In the pre-Russia energy communication in October 2021, the EU President van der Leyen said “Wind energy is very volatile… Alongside this, we need a stable source, nuclear, and during the transition, of course, natural gas”.
As recent as September 2024, the European Commission [17, p26] writes that “Develop a comprehensive strategy at the EU level, coordinate with Member States on how to manage natural gas during the transition and on how to secure natural gas (from where, volumes and conditions) for the next 20 years.”
There appears to be two fundamental misunderstandings in the general media, among the population, and many political and industrial leaders, about coal and gas, namely:
Misunderstanding 1: Coal and gas are interchangeable when it comes to energy and raw material resources, they clearly are not always.
Misunderstanding 2: Gas is “better for the climate” than coal making it better suited as a “transition fuel”, see next section.
The interesting point is that sometimes gas is favored because there is a belief that Hydrogen will be the sustainable solution to long-duration energy storage, and gas power plants and transmission infrastructure may be more easily converted to hydrogen power plants than what coal power plant would. “The Hydrogen future” and gas’ role is a 3rd significant misunderstanding well summarized in the book “The Hydrogen Illusion” by Prof Furfari [4]. The fundamental misunderstanding is around the belief that hydrogen is sustainable, safe, and cost effective.
Figure 3: Coal and gas growth as% of global electricity production
Source: Schernikau based on BP, Our World in Data, Global Electricity Review
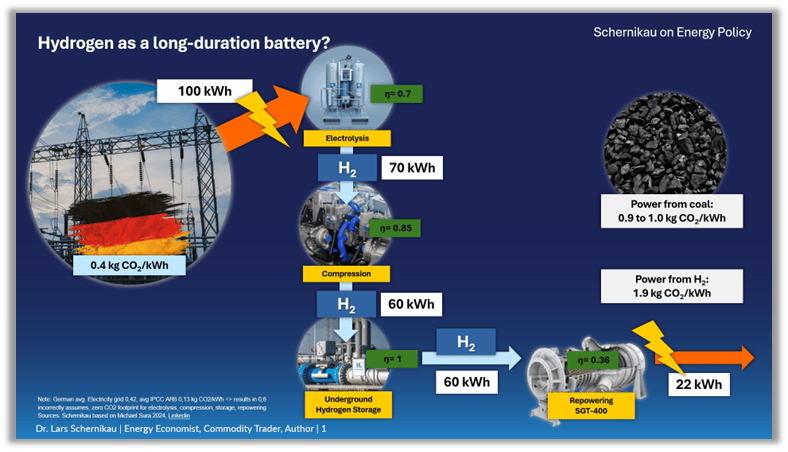
One simple point I would like to make here is that since solar and wind cannot be zero CO2, neither can hydrogen derived from excess or unutilized wind and solar. The value chain of hydrogen for storage includes “making” H2, storing H2, transporting H2 and then repowering H2. In all these steps about 65-80% of the input energy gets lost and dissipates in the form of low value, high entropy heat into the atmosphere (Figure 5). Thus, the CO2 footprint of wind and solar, when using H2 for storage, would multiply by a factor of 3 or 4! In addition, hydrogen is highly explosive, permeates practically everything including steel, and is thus a dangerous product to handle.
for example, our yet unpublished research shows that the CO2 footprint is likely at the higher end or above of the IPCC AR6 range of 9-250 gCO2/kWh for solar power
assuming 250 gCO2/kWh was correct, then a 4x increase due to hydrogen storage value chain’s energy “losses” would make solar power + H2 with 750 to 1.000 gCO2/kWh on par with “unabated” coal power plants
Even if H2 was a viable solution, which it is not, the development of a so called “hydrogen economy” does not initially require H2-ready gas power plants. Because (1) such H2-ready gas plants cannot yet be connected to the non-existing hydrogen grid, and (2) hydrogen sprinter and hybrid power plants would be well suited as well, not requiring gas [7].
Interestingly, the cost of producing hydrogen from coal with CCUS (Carbon Capture Utilization and Storage) would be about three times less expensive than producing low-carbon hydrogen through water electrolysis [17]
In addition, to safeguard the fluctuating feed-in of renewable energy sources, consideration must also be given to the continuation of alternative technological developments such as large-scale storage systems. Until these are available, coal-fired power plants can easily take, and sometimes already do take the place of H2-ready gas turbines in securing the fluctuating feed-in of renewable energy sources [8]. Also, ammonia could be co-fired in coal-fired power plants as an H2 carrier [based on IEA].
Fyi, China or India are not building gas-fired power stations but continue to build coal instead, I wonder why. It appears coal can very well be used as backup for solar?
Figure 3: Coal and gas growth as% of global electricity production Source: Schernikau based on BP, Our World in Data, Global Electricity ReviewFigure 4: Hydrogen’s “energy” inefficiency, Michael SuraFigure 5: misguided advertising for gas, dismissing methane and natural CO2 uptake
Lifecycle GHG emissions
Many discussions in the media and press have been about the lifecycle greenhouse gas emissions of gas, especially LNG. Not too long ago, The New Yorker [5] summarized it to the point “A new analysis suggests that LNG exports may well be worse for the environment than burning coal.” The peer-reviewed research referenced is from Howarth 2023 [6].
The well-established fact is that, assuming the IPCC is correct about methane’s global warming potential GWP, the relatively higher methane emissions throughout the life cycle of natural gas and LNG – from production and transportation to usage (including leaks), often offset, and in many cases exceed, the CO2 emissions advantage that gas has over coal. If one is worried about imminent human greenhouse gas induced catastrophic warming then CO2 doesn’t matter but CO2-equivalent (CO2eq) matters… over the next 20 years. This metric the IPCC measures with its 20-year Global Warming Potential GWP20.
For the record, I do not doubt that CO2 or CH4 (methane) are greenhouse gases. However, there remains scientific uncertainty and debate about the global warming potential and climate sensitivity of greenhouse gases. My detailed objection to IPCC’s GWP as well as the scientific debate and uncertainty on GWP cannot be detailed on this platform (see also [14]). For instance, Wijngaarden/Happer 2020 have analyzed GHG forcing in detail and conclude significantly lower climate sensitivities than those used by the IPCC.
In our own peer-reviewed research Schernikau/Smith 2022 “Climate Impacts’ of Fossil Fuels in Today’s Energy Systems” [7] we come to the same conclusion of gas not being “better for the climate” than coal, using data solely from the International Energy Agency (IEA in Paris) and the Intergovernmental Panel on Climate Change (IPCC in Geneva).
The main “novelty” is that we included the fact that only half the CO2 emissions from any source can contribute to warming of the planet. This is a fact that is confirmed by the IPCC, but forgotten by most, because more than half of CO2 is taken up by nature such as plant life and oceans, contributing to greening of the Earth. The global warming potential of CO2 is for molecules remaining in the atmosphere acting as “greenhouse gases”, not for those taken up by nature.
Another noteworthy study confirming that LNG is “not better for the climate” than coal was published by Prof Wodopia of Germany in 2023 [8]. He concluded “the net lifecycle greenhouse gas emissions of liquefied natural gas (LNG) from the USA or Qatar are compared with those of coal, taking sulphur dioxide emissions into account. When used in a simple-cycle gas turbine, they are higher than those of coal. In part-load operation, the results shift further in favor of coal.
Countless additional studies make similar points, here some more examples:
[9] Rosselot et al 2021: Comparing Greenhouse Gas Impacts from Domestic Coal and Imported Natural Gas Electricity Generation in China,
[10] Mar et al 2022: Beyond CO2 Equivalence: The Impacts of Methane on Climate, Ecosystems, and Health,
[11] Kemfert et al 2022: The Expansion of Natural Gas Infrastructure Puts Energy Transitions at Risk,
[12] Nature 2022: Scientists Raise Alarm over ‘Dangerously Fast’ Growth in Atmospheric Methane,
[13] IEEFA 2020, The Australian LNG Industry’s Growth – and the Decline in Greenhouse Gas Emissions Standards,”
[14] Alvarez et al 2018, Assessment of Methane Emissions from the U.S. Oil and Gas Supply Chain.
[15] Howarth, Robert W. “Howarth 2024: The Greenhouse Gas Footprint of Liquefied Natural Gas (LNG) Exported from the United States.” Energy Science & Engineering n/a, no. n/a (October 2024)
When “the science” is clear on this fact, then why does the EU support gas, but not coal? What am I missing? Why is the public being misled? Why do we continue to spend billions on replacing coal with imported LNG? Why are banks reluctant to fund coal, but not gas?
I repeat, we need more of both coal and gas, but isn’t it time to be honest with ourselves about its impact and consequences for economies and the environment?
Economic future for coal and gas
Understanding more about gas and coal, their importance for our energy needs and daily products used, but also their environmental impact, helps us make smarter energy policy decisions. I see that it is undisputed that coal and gas are on par when it comes to “the climate”. My opinion on the fallacy of measuring everything with CO2 is published here “The Dilemma of pricing CO2“.
The future of coal and gas appears to look bright, because (1) the demand for carbon and hydrogen sourced from coal and gas cannot be easily replaced when it comes to the production of our day-to-day products, and (2) because alternative ways of producing grid-ready power are either significantly more expensive and/or have a much worse impact on the environment.
For more details on energy costs please refer to my article “The Energy Trilemma” from earlier this year.
The fact that we need to continue investing in our coal and gas supply chains, power plants, and material use infrastructure, appears to be obvious.
Consider this – assuming coal and gas have a 40% power plant efficiency on average, then a global 1% efficiency improvement results in 2.5% (1/40%) less raw material used and less environmental impact. Isn’t this worth the investment? Remember that coal and gas make up almost two thirds of the world’s power generation!
Investments especially for coal but also for gas are not keeping up with demand and this will logically lead to power shortages and inflated prices. That in turn will lead to energy poverty and less GDP growth. Has anyone counted the cost to humanity from such personal and economic losses? I fear not.
[6] Howarth 2023: The Greenhouse Gas Footprint of Liquefied Natural Gas (LNG) Exported from the United States,” October 2023,
[7] Schernikau and Smith 2022 ‘Climate Impacts’ of Fossil Fuels in Today’s Energy Systems’, SSRN Electronic Journal, March 2022. https://doi.org/10.2139/ssrn.3968359
[8] Wodopia 2024: Lifecycle Emissions From Gas and Coal Do Not Support a Coal-to-Gas Shift.” SSRN Scholarly Paper. Rochester, NY, January 2024. https://doi.org/10.2139/ssrn.4674204
[9] Rosselot et al 2021: Comparing Greenhouse Gas Impacts from Domestic Coal and Imported Natural Gas Electricity Generation in China.” ACS Sustainable Chemistry & Engineering 9, no. 26 (July 2021): 8759–69. https://doi.org/10.1021/acssuschemeng.1c01517
[10] Mar et al 2022: Beyond CO2 Equivalence: The Impacts of Methane on Climate, Ecosystems, and Health, Environmental Science & Policy 134 (April 2022): 127–36. https://doi.org/10.1016/j.envsci.2022.03.027.
[11] Kemfert et al 2022: The Expansion of Natural Gas Infrastructure Puts Energy Transitions at Risk, Nature Energy, July 2022, 1–6. https://doi.org/10.1038/s41560-022-01060-3
[14] Alvarez et al 2018, Assessment of Methane Emissions from the U.S. Oil and Gas Supply Chain.” Science 361, no. 6398 (July 2018): 186–88. https://doi.org/10.1126/science.aar7204.
[15] Howarth, Robert W. “Howarth 2024: The Greenhouse Gas Footprint of Liquefied Natural Gas (LNG) Exported from the United States.” Energy Science & Engineering n/a, no. n/a (October 2024)
[16] Wijngaarden/Happer 2020: Dependence of Earth’s Thermal Radiation on Five Most Abundant Greenhouse Gases.” arXiv:2006.03098 [Physics], June 2020. http://arxiv.org/abs/2006.03098.
Hot, Hot, Hot. You will have noticed that the term “climate change” is now synonymous with “summer”. Since the northern hemisphere is where most of the world’s land, people and media are located, two typical summer months and a hot European August have been depicted as the fires of hell awaiting any and all who benefit from fossil fuels. If you were wondering what the media would do, apart from obsessing over the many small storms this year, you are getting the answer.
Hot, Hot, Hot. You will have noticed that the term “climate change” is now synonymous with “summer”. Since the northern hemisphere is where most of the world’s land, people and media are located, two typical summer months and a hot European August have been depicted as the fires of hell awaiting any and all who benefit from fossil fuels. If you were wondering what the media would do, apart from obsessing over the many small storms this year, you are getting the answer.
Fortunately, Autumn is on the way and already bringing cooler evenings in Montreal where I live. Once again open windows provide fresh air for sleeping, while mornings are showing condensation, and frost sometimes. This year’s period of “climate change” is winding down. Unless of course, we get some hurricanes the next two months. Below is a repost of seasonal changes in temperature and climate for those who may have been misled by the media reports of a forever hotter future.
Autumnal Climate Change
Seeing a lot more of this lately, along with hearing the geese honking. And in the next week or two we expect that trees around here will lose their leaves. It definitely is climate change of the seasonal variety.
Interestingly, the science on this is settled: It is all due to reduction of solar energy because of the shorter length of days (LOD). The trees drop their leaves and go dormant because of less sunlight, not because of lower temperatures. The latter is an effect, not the cause.
Of course, the farther north you go, the more remarkable the seasonal climate change. St. Petersburg, Russia has their balmy “White Nights” in June when twilight is as dark as it gets, followed by the cold, dark winter and a chance to see the Northern Lights.
And as we have been monitoring, the Arctic ice has been melting from sunlight in recent months, but is already building again in the twilight, to reach its maximum in March under the cover of darkness.
We can also expect in January and February for another migration of millions of Canadians (nicknamed “snowbirds”) to fly south in search of a summer-like climate to renew their memories and hopes. As was said to me by one man in Saskatchewan (part of the Canadian wheat breadbasket region): “Around here we have Triple-A farmers: April to August, and then Arizona.” Here’s what he was talking about: Quartzsite Arizona annually hosts 1.5M visitors, mostly between November and March.
Of course, this is just North America. Similar migrations occur in Europe, and in the Southern Hemisphere, the climates are changing in the opposite direction, Springtime currently. Since it is so obviously the sun causing this seasonal change, the question arises: Does the sunlight vary on longer than annual timescales?
The Solar-Climate Debate
And therein lies a great, enduring controversy between those (like the IPCC) who dismiss the sun as a driver of multi-Decadal climate change, and those who see a connection between solar cycles and Earth’s climate history. One side can be accused of ignoring the sun because of a prior commitment to CO2 as the climate “control knob”.
The other side is repeatedly denounced as “cyclomaniacs” in search of curve-fitting patterns to prove one or another thesis. It is also argued that a claim of 60-year cycles can not be validated with only 150 years or so of reliable data. That point has weight, but it is usually made by those on the CO2 bandwagon despite temperature and CO2 trends correlating for only 3 decades during the last century.
One scientist in this field is Nicola Scafetta, who presents the basic concept this way:
“The theory is very simple in words. The solar system is characterized by a set of specific gravitational oscillations due to the fact that the planets are moving around the sun. Everything in the solar system tends to synchronize to these frequencies beginning with the sun itself. The oscillating sun then causes equivalent cycles in the climate system. Also the moon acts on the climate system with its own harmonics. In conclusion we have a climate system that is mostly made of a set of complex cycles that mirror astronomical cycles. Consequently it is possible to use these harmonics to both approximately hindcast and forecast the harmonic component of the climate, at least on a global scale. This theory is supported by strong empirical evidences using the available solar and climatic data.”
He goes on to say:
“The global surface temperature record appears to be made of natural specific oscillations with a likely solar/astronomical origin plus a noncyclical anthropogenic contribution during the last decades. Indeed, because the boundary condition of the climate system is regulated also by astronomical harmonic forcings, the astronomical frequencies need to be part of the climate signal in the same way the tidal oscillations are regulated by soli-lunar harmonics.”
He has concluded that “at least 60% of the warming of the Earth observed since 1970 appears to be induced by natural cycles which are present in the solar system.” For the near future he predicts a stabilization of global temperature and cooling until 2030-2040. Note that several El Nino spikes have temporarily taken the GMT (Global Mean Temperature) anomaly outside the forecasted bounds.
A Deeper, but Accessible Presentation of Solar-Climate Theory
I have found this presentation by Ian Wilson to be persuasive while honestly considering all of the complexities involved.
The author raises the question: What if there is a third factor that not only drives the variations in solar activity that we see on the Sun but also drives the changes that we see in climate here on the Earth?
The linked article is quite readable by a general audience, and comes to a similar conclusion as Scafetta above: There is a connection, but it is not simple cause and effect. And yes, length of day (LOD) is a factor beyond the annual cycle.
It is fair to say that we are still at the theorizing stage of understanding a solar connection to earth’s climate. And at this stage, investigators look for correlations in the data and propose theories (explanations) for what mechanisms are at work. Interestingly, despite the lack of interest from the IPCC, solar and climate variability is a very active research field these days.
For example Svensmark has now a Cosmosclimatology theory supported by empirical studies described in more detail in the red link.
Once again, it appears that the world is more complicated than a simple cause and effect model suggests.
Fluctuations in observed global temperatures can be explained by a combination of oceanic and solar cycles. See engineering analysis from first principles Quantifying Natural Climate Change.
For everything there is a season, a time for every purpose under heaven.
What has been will be again, what has been done will be done again; there is nothing new under the sun. (Ecclesiastes 3:1 and 1:9)
All around America there is an avalanche of proposed wind and solar projects. The idea is to replace fossil fueled electric power which is the dominant source in most places. Some States even have laws to this effect.
All around America there is an avalanche of proposed wind and solar projects. The idea is to replace fossil fueled electric power which is the dominant source in most places. Some States even have laws to this effect.
Setting aside that this is an impossible goal it is interesting, even amusing, to see how this avalanche might play out in Washington State. The majority of their power comes from hydro but wind and solar are poised to wipe that out as well. This is an objective losing its way!
I became aware of the avalanche a few years ago when PJM, the nation’s biggest power system operator, announced that it was swamped by wind and solar connection requests. The combined MW of the application queue actually exceeded PJM’s peak demand.
This seemed unbelievable at the time but it is now clear that this fiasco is nationwide. People are applying to build more generating capacity than can possibly be used. That is certainly enough to knock off most of the existing generation.
The knock off happens because wind and solar typically come with what are called “take or pay contracts.” If the utility does not take the power they have to pay the generator anyway, so there is tremendous incentive to use this power instead of any other source.
Which brings us to Washington State where almost 70% of the power comes from hydro. Much of this is thanks to the Federal damming of the mighty Columbia River and its tributaries. The big gun here is the Bonneville Power Administration (BPA) which operates 31 hydro dams ranging up to the huge 6,800 MW Grand Coulee. But a number of state and local agencies run sizable hydro as well.
I do not have data specific to Washington as a whole but there is no doubt the wind and solar avalanche is underway there. For example BPA talks about “skyrocketing requests” in their 2023 Annual Report, saying this:
“Under the umbrella of Evolving Grid, we are reforming our process for managing skyrocketing requests for generation interconnections. Our intent is to shift from a first-come/first served process that studies requests individually in the order received, to a first-ready/first-served cluster study approach for large generator interconnection requests.”
This is in fact the same change as PJM made to handle their incredible queue of requests.
Then too there is the regional planning group called NorthernGrid whose region includes a good bit of Washington. They report this in their latest study:
“– The total NorthernGrid footprint, non-coincident peak load is 61,867 MW in July
— There are 2,611 MW of planned retirements
— There are 72,099 MW of planned generation additions”
The planned new generation, almost all wind and solar, exceeds peak demand by a wide margin. Pretty clearly this is true for Washington State as a whole.
What is really funny is that BPA makes no mention of what is surely a supreme threat to their power supply business. But they are a Biden-Harris federal agency so maybe mum’s the word for now.
Of course the Washington State electricity users are in the complete dark about the oncoming avalanche of what is bound to be expensive power. I can find no mention of this obvious threat.
There are lots of reasons to constrain the galloping growth of wind and solar. Issues like unreliability, excessive cost and environmental destruction. None of them is funny. But the idea that one form of renewables (wind and solar) might knock off another (hydro) is laughably stupid.
“What has come to be known as ‘weather attribution,’ research assigning causation to observed weather events, is fraught with methodological problems. Veteran climate scientist Roger A. Pielke Jr. in his Substack publication The Honest Broker calls it ‘weather attribution alchemy’.”
“What has come to be known as ‘weather attribution,’ research assigning causation to observed weather events, is fraught with methodological problems. Veteran climate scientist Roger A. Pielke Jr. in his Substack publication The Honest Broker calls it ‘weather attribution alchemy’.”
Last year was hot, unusually so. The global temperature was almost 0.3°C above 2022 levels, so much higher that even conventional analyses of global warming didn’t appear to explain it. As a recent article in Science magazine notes, iconic climate scientist James Hansen was suggesting that a new, air-pollution-driven warming mechanism might be at work. NASA’s Gavin Schmidt posited that a novel, unknown force could be involved.
Wrong, says a team of six climate scientists led by Shiv Priyam Raghuraman (University of Illinois, Champaign-Urbana). The culprit is more likely the familiar climate confounder, El Niño (technically, the El Niño-Southern Oscillation or ENSO).
our results underscore the importance of the El Niño–Southern Oscillation in driving the occurrence of global warming spikes such as the one in 2023, without needing to invoke anthropogenic forcing, such as changes in atmospheric concentrations of greenhouse gases or aerosols, as an explanation.
They add:
Global-mean surface temperature rapidly increased 0.29 ± 0.04 K from 2022 to 2023. Such a large interannual global warming spike is not unprecedented in the observational record, with a previous instance occurring in 1976–1977. However, why such large global warming spikes occur is unknown, and the rapid global warming of 2023 has led to concerns that it could have been externally driven.
And:
Here we show that climate models that are subject only to internal variability can generate such spikes, but they are an uncommon occurrence (p = 1.6 % ± 0.1 %). However, when a prolonged La Niña immediately precedes an El Niño in the simulations, as occurred in nature in 1976–1977 and 2022–2023, such spikes become much more common (p = 10.3 % ± 0.4 %). Furthermore, we find that nearly all simulated spikes (p = 88.5 % ± 0.3 %) are associated with El Niño occurring that year.
The University of Illinois research fits with an August paper by four researchers from CICERO Center for International Climate Research in Oslo, Norway. Published in the Communications Earth & Environment journal, Bjørn H. Samset et al. wrote:
2023 was the warmest year on record, influenced by multiple warm ocean basins. This has prompted speculation of an acceleration in surface warming, or a stronger than expected influence from loss of aerosol induced cooling…. We show that the strong deviation from recent warming trends is consistent with previously observed sea surface temperature influences, and regional forcing.
“Weather Attribution” Alchemy
What has come to be known as “weather attribution,” research assigning causation to observed weather events, is fraught with methodological problems. Veteran climate scientist Roger A. Pielke Jr. in his Substack publication The Honest Broker calls it “weather attribution alchemy.”
Pielke notes that the U.N.’s Intergovernmental Panel on Climate Change (IPPC) describes weather attribution research as seeking “to attribute aspects of specific extreme weather and climate events to certain causes.” The IPCC adds:
Scientists cannot answer directly whether a particular event was caused by climate change, as extremes do occur naturally, and any specific weather and climate event is the result of a complex mix of human and natural factors. Instead, scientists quantify the relative importance of human and natural influences on the magnitude and/or probability of specific extreme weather events.
Pielke offers three important aspects of weather attribution.
It is “tactical,” meaning political, “research performed explicitly to serve legal and political ends.” He notes that a key motive for the work of the UK-based World Weather Attribution (WWA) project is “increasing the ‘immediacy’ of climate change, thereby increasing support for mitigation.” WWA founder Frederike Otto has said, “Unlike every other branch of climate science or science in general, event attribution was actually originally suggested with the courts in mind.” Pielke says that “tactical science is not necessarily bad science, but it should elevate the degree of scrutiny that such analyses face, especially when they generally are not subjected to independent peer review.”
Weather attribution reflects the IPPC’s inability to find with high confidence “increasing trends in the frequency or intensity of most types of impactful extreme events — notably hurricanes, floods, drought, and tornadoes.” He writes, “For instance, the IPCC has reportedincreases in heat waves and in heavy precipitation, but not tropical cyclones (including hurricanes), floods, tornadoes or drought.” Climate activists view this as a political obstacle to their policy agenda, “a problem that can be rectified via the invention of extreme event attribution.”
The weaknesses of weather attribution should not obscure the importance of the climate issue, but that isn’t a license to ignore scientific integrity. “We live in a time when far too often calls for scientific integrity are criticized by political campaigners (including scientists),” he argues, “when certain scientific understandings do not align perfectly with this or that political agenda.”
Pielke writes that “some dismiss entirely the possibility of human-caused changes in climate while others quickly claim that every weather event is more extreme or more common due to climate change. These extreme positions are roughly aligned with the far right and far left respectively — and discussion of climate science and policy has long been dominated by these extremes.”
Up to $41 billion of the funds distributed to climate causes by the World Bank between 2017 and 2023 are unaccounted for due to poor accounting standards, according to an audit from Oxfam International published Thursday.
World Bank on glass building. Mirrored sky and city modern facade. Global capital, business, finance, economy, banking and money concept 3D rendering illustration.
Up to $41 billion of the funds distributed to climate causes by the World Bank between 2017 and 2023 are unaccounted for due to poor accounting standards, according to an audit from Oxfam International published Thursday.
“The Bank is quick to brag about its climate finance billions — but these numbers are based on what it plans to spend, not on what it actually spends once a project gets rolling,” Kate Donald, head of Oxfam International’s Washington D.C. Office, said in the release. “This is like asking your doctor to assess your diet only by looking at your grocery list, without ever checking what actually ends up in your fridge.”
CARDIFF, WALES – JULY 11: A close-up of an Oxfam store sign on July 11, 2023 in Cardiff, Wales. (Photo by Matthew Horwood/Getty Images)
The auditors were unable to determine whether the climate cash was spent “on climate-related initiatives intended to help low- and middle-income countries protect people from the impacts of the climate crisis and invest in clean energy,” according to Oxfam.
The World Bank is the largest provider of environmental funding of all multi-national financial institutions, Oxfam reported, and plans to allocate 45% of its annual financing to green initiatives between July 1, 2024, and June 20, 2025. The U.S. is the largest shareholder in the Bank, holding over 15% of its voting shares as of May 31.
“Climate finance is scarce, and yes, we know it’s hard to deliver. But not tracking how or where the money actually gets spent? That’s not just some bureaucratic oversight — it’s a fundamental breach of trust that risks derailing the progress we need to make at COP this year,” Donald said in the release.
The World Bank’s poor record-keeping practices made performing the audit “painstaking and difficult,” Oxfam reported.
“We had to sift through layers of complex and incomplete reports, and even then, the data was full of gaps and inconsistencies,” Donald said in the release. “The fact that this information is so hard to access and understand is alarming —it shouldn’t take a team of professional researchers to figure out how billions of dollars meant for climate action are being spent. This should be transparent and accessible to everyone, most importantly communities who are meant to benefit from climate finance.”
Oxfam and the World Bank did not immediately respond to requests for comment.
All content created by the Daily Caller News Foundation, an independent and nonpartisan newswire service, is available without charge to any legitimate news publisher that can provide a large audience. All republished articles must include our logo, our reporter’s byline and their DCNF affiliation. For any questions about our guidelines or partnering with us, please
In the essay below, many of the remarks by Florida Governor Ron DeSantis echo what we have been saying here at Climate Realism about hurricane Milton as well as Helene and hurricanes in general: Hurricane Milton is Historic, but Not Unprecedented, Nor Climate Driven, and Milwaukee Journal Sentinel Presents Master Class on Hurricane Milton and Climate Misinformation. Previously, CR took on media claims about hurricane Helene in: No, Media. Hurricane Helene was not Worsened by Climate Change.
Governor DeSantis provided a spectacular example of political leadership while demonstrating his climate science knowledge and credibility when he addressed a news conference regarding the state’s situation and status in dealing with the aftermath of Hurricane Milton. You can watch the full video here.
His significant remarks regarding Florida’s hurricane history and impacts as well as actions being taken to address Hurricane Milton’s outcome merit being displayed in print as best as possible as well as being listened to at several websites that carried his extraordinarily competent news conference remarks.
Toward that end, I have tried to summarize and encapsulate his key remarks and capture the many hurricane climate science perspectives addressed by Governor DeSantis as an example of competent climate science political leadership and knowledge.
In response to a reporter’s question attempting to connect “human caused global warming” to increasing numbers and impacts of hurricanes and tornadoes Governor DeSantis noted:
“Tornadoes – I think you can go back and find tornadoes for all human history, for sure, especially in Florida.
How does this storm rate – in kind of – the history of storms.
I think this storm hit with a barometric pressure of – what was it – about 950 millibars when it hit,”
“If you go back to 1851, there’s probably been 27 hurricanes that have had lower barometric, so the lower the barometric pressure, the stronger it is”.
“I think there have been about 27 hurricanes that have had lower barometric pressure on landfall than Milton did, and of those, 17 occurred I think prior to 1960.”
“The most powerful hurricane on record since the 1850s in the state of Florida occurred in the 1930s, the Labor Day Hurricane, barometric pressure on that was 892 millibars,”
“It totally wiped out the Keys. We’ve never seen anything like it, and that remains head and shoulders above any powerful hurricane that we’ve ever had in the state of Florida.”
“The deadliest hurricane the state has ever faced was the Okeechobee hurricane in 1928, which killed more than 4,000 people.”
“Fortunately, we aren’t going to have anything like that this time.”
“So, I just think people should put this in perspective there.”
“They try to take different things that happen with tropical weather and act like it’s something, there’s nothing new under the sun”.
You know, this is something that the state has dealt with for its entire history, and it’s something that will continue to deal with.”
“I think what’s changed is we’ve got 23 million people, a storm that hits are likely to hit more people and property than it would have 100 years ago, and so the potential for that damage has grown, but what’s also changed is our ability to do the prevention, to pre-stage the assets,”
“I mean, we never did the pre-staging of power assets until I became governor. Now, people like expect that, but that wasn’t what was done in the past.”
“That’s why people would be out with power for three weeks when we have hurricanes, we thought that that’s not good. Now we have to pay to get these guys to come in, but my view is, the quicker you get everyone hooked up, the better off the economy is going to be anyway.”
In response to another reporter’s question regarding the claim that human caused global warming was causing increasing intensification of storms Governor DeSantis noted:
“Oh, I think most people remember 2004, right, where it seemed like we had storms occur every other week”
“You know that we had no hurricanes at all from 2006 to 2016.”
“There was a time period we had a lot of hurricanes in the 1940s.”
“So, this situation has a lot of similarities to what happened in 2004.”
What a breath of fresh air from a competent political leader addressing climate science reality instead of politically contrived climate alarmism speculation and hype.
Here in New York we have our own unique and special acronym for how we think we are going to make our future emissions-free electrical grid work with predominantly wind and solar generation. The acronym is DEFR — the “Dispatchable Emissions-Free Resource.” When the sun goes down and the wind stops blowing in the dead of winter, we will crank up the DEFR to keep us all warm and cozy. There will of course be zero carbon emissions, because by definition the DEFR is “emissions-free.”
Here in New York we have our own unique and special acronym for how we think we are going to make our future emissions-free electrical grid work with predominantly wind and solar generation. The acronym is DEFR — the “Dispatchable Emissions-Free Resource.” When the sun goes down and the wind stops blowing in the dead of winter, we will crank up the DEFR to keep us all warm and cozy. There will of course be zero carbon emissions, because by definition the DEFR is “emissions-free.”
Unfortunately nobody is quite sure what this DEFR might be. There are only a few options. Nuclear could work, but in New York it is completely blocked by regulatory obstruction and the certainty of decades of litigation. Batteries are wildly too expensive and physically not up to the job. That leaves many green energy advocates grasping at hydrogen as the last remaining option. Granted, we don’t yet have any meaningful production of hydrogen from carbon-free sources. But it seems so simple: just use wind and solar generators to run electrolyzers to make hydrogen from water; then store the hydrogen in some big caverns, and burn it when you need it. No carbon is involved. Problem solved!
I’ve had a few posts over the past couple of years commenting on some of the many issues that make this “green” hydrogen fantasy infeasible. This post from June 2022 noted that the cost of making hydrogen from water is unlikely ever to fall below, or even close to, the cost of getting new natural gas out of the ground; this post from August 2024 discussed numerous other problems with hydrogen, like its lower energy density compared to natural gas, and the prospective need for a whole new infrastructure of pipelines, power plants, delivery trucks and consumer appliances.
Now comes along a new study focusing on a different piece of the costs of using hydrogen as a main energy source for the economy. The issue is the cost of storing the hydrogen from the time of its production until it is needed for use. The new study appeared in the scientific journal Joule on October 8 with the title “Carbon abatement costs of green hydrogen across end-use sectors.” (The link goes just to a lengthy introduction and abstract. You’ll need to pay $35 to get the whole article, but the introduction at the link tells you what you need to know.)
Perhaps most significant about this new study is the authors. They are Roxana Shafiee and Daniel Schrag, both of whom work at Harvard and have impeccable climate cult credentials, including multiple appointments at various Harvard sub-schools and institutes (Harvard University Center for the Environment, Harvard Department of Earth and Planetary Sciences, Harvard Paulson School of Engineering and Applied Sciences, Harvard Kennedy School Belfer Center for Science and International Affairs — you get the idea). These are not people who can be dismissed as “climate deniers.”
Shafiee and Schrag correctly recognize that the cost of producing hydrogen from water is just a piece, and possibly a small piece, of the cost of getting useful hydrogen to a consumer at point of use. They criticize green hydrogen enthusiasts for paying insufficient attention to other costs, and particularly to the costs of “storage and distribution”:
Hydrogen generated via electrolysis using renewable energy (green hydrogen) has gained prominence as a potential strategy in decarbonizing hard-to-abate sectors of the economy, in which electrification is technically challenging or prohibitively expensive. Many governments have set policy targets and, in some cases, financial incentives for green hydrogen production, with the expectation that production costs will fall rapidly in the coming decades, providing low-cost carbon abatement opportunities across many sectors. Yet, many recent analyses do not consider the storage and distribution costs of delivering green hydrogen to different sectors or how these costs may vary across end uses.
So Shafiee and Schrag set out to correct those deficiencies. To their credit, S&S have figured out that the costs of distribution and storage infrastructure are highly dependent on how intensely that infrastructure is used. (As far as I can determine, not one of the thousands of people in the vast New York energy regulatory bureaucracies has yet figured out this simple principle.) The more often the storage gets cycled, the lower the charge for each unit of energy stored and then used. S&S note that some sectors, particularly industries like petrochemicals and steel, can cycle hydrogen storage many times per month, thus driving down costs. Unfortunately, the same does not apply to the power sector:
Although low costs of hydrogen storage and distribution (<$1/kgH2) are possible through economies of scale, this requires high utilization of storage and distribution infrastructure, which is not applicable to all end-use sectors. If storage and distribution infrastructure is used at a low rate, costs increase significantly. Salt cavern storage costs increase from less than $0.50/kgH2 to $6/kgH2, on average, if stores are cycled fewer than 10 times per year, for example, in the context of seasonal changes in demand (e.g., heating or electricity generation).
That’s right: hydrogen produced and stored for purposes of home heating only gets cycled once per year at most. To understand the significance of the costs cited, recall that the energy-equivalence conversion factor from $/kgH2 to $/MMBTU (the units in which natural gas prices are customarily quoted) is 8. $6/kgH2 converts to $48/MMBTU. And that’s just for the intra-year storage. Meanwhile, the current price for Henry Hub natural gas is $3.06/MMBTU, and most of it does not need to be stored for any significant period because it gets produced roughly as needed to meet demand.
So kudos to S&S for figuring out that cost of storage for hydrogen is a big and unrecognized issue. But unfortunately, they only go as far as considering intra-year storage. There is also a huge issue of multi-year storage if green hydrogen is to become the backup for a grid powered mostly by wind and sun. In a post on September 28, 2023, I covered a Report then just out from Britain’s Royal Society dealing with issues of long-term energy storage to back up wind and solar generators. The Royal Society had collected weather data for Britain for some 37 years, which had revealed that there are worst-case wind and sun “droughts,” comparable to rain droughts, that may occur only once every 20 years or more. A storage solution to back up wind and solar electricity generation without fossil fuel back-up needs to cover these worst-case droughts.
The Royal Society Report includes the following graph of potentially needed withdrawals from storage to cover these worst case droughts:
The graph shows that of the storage needed for full back-up over the 37 year period of data, fully half would only have been called on twice, and about a quarter would only have been called on once. Perhaps S&S should go back to their laptops to figure out how much salt cavern storage costs per unit of energy stored when it only gets called on once in 37 years. If storage that gets cycled once per year costs $6/kgH2, does storage that gets cycled once per 37 years cost $222/kgH2? The blended cost — between the storage that gets cycled once per year and the rarely-used part that gets cycled only once every 10 or 20 or even 37 years — would look to be around $100/kgH2, equivalent to $800/MMBTU of natural gas. That’s more than 250 times the current price of natural gas, and of course is only the cost of storage. The cost of actually producing the hydrogen would be additional.
I understand that there are people moving forward on setting up some of this hydrogen infrastructure, funded with government subsidies. It’s almost impossible to imagine how much subsidies it would take to make such a system fully functional. It will never happen.




You must be logged in to post a comment.