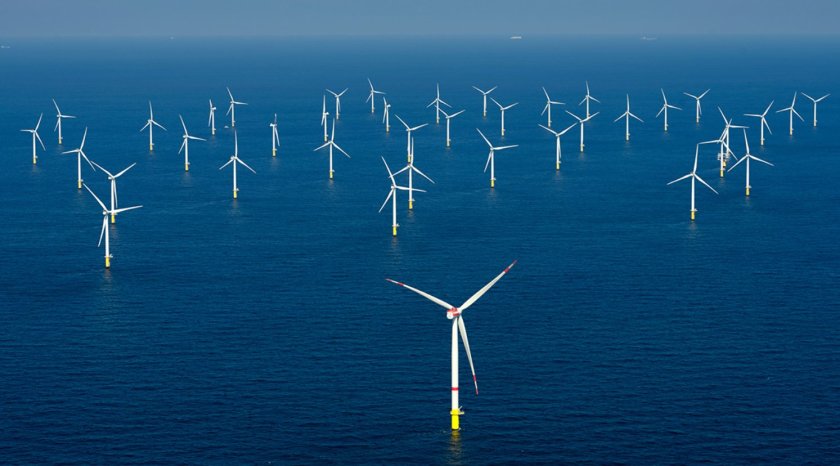
U.S. Offshore Wind: GE Vernova’s Big Problems

Facing a series of costly physical problems and a becalmed market, GE Vernova, the largest offshore wind turbine developer in the U.S., has informed European authorities that it plans to lay off up to 900 workers around the world as it scales back its offshore business. The Maritime Executive reported that the General Electric wind development spinoff notified the European Works Council for France of its planned downsizing.

From Master Resource

By Kennedy Maize

“European energy companies Orsted, Equinor and BP have taken a combined $5 billion of writedowns on U.S. offshore wind projects that are mostly in development, in part because their existing power sales contracts would not cover the cost of building and financing the projects.” (- Reuters, below)

Facing a series of costly physical problems and a becalmed market, GE Vernova, the largest offshore wind turbine developer in the U.S., has informed European authorities that it plans to lay off up to 900 workers around the world as it scales back its offshore business. The Maritime Executive reported that the General Electric wind development spinoff notified the European Works Council for France of its planned downsizing.

Under EU law, member states have established councils to “facilitate the information and consultation of employees with a focus on transnational issues….” A third or more of the cuts could come in the U.S. company’s two plants in France.

In an emailed statement, Cambridge, Mass.-based GE Vernova said, “On 19 September 2024 we submitted a proposal to our European Works Council related to proposed changes in our offshore wind business globally. The proposal reflects industrywide challenges for wind and aims to transform our offshore wind business into a smaller, leaner and more profitable business within GE Vernova.”

The once-giant conglomerate General Electric spun off its electric generating subsidiaries GE Power and GE Renewable Energy into GE Vernova (NYSE:GEV) in April. The company has sold some 55,000 wind turbines now in service and 7,000 gas turbine generators. While the overall company is profitable, with predicted 2024 revenues of $34-$35 billion.

But wind power problems have hit the company in the third quarter, GE Vernova said, producing flat earnings for the year. The company news release said, “The Wind segment is now expected to generate an approximately $300 million EBITDA loss in the third quarter 2024 given these costs, despite Onshore Wind delivering a fifth straight quarter of profitability. The company expects the wind segment to be modestly profitable in the fourth quarter.” The company reported a $117 million loss for the offshore wind business in the 2024 second quarter.

Earlier this year, GE Vernova dropped development of its 18-MW Halide offshore wind turbine, deciding to focus on its existing 13-MW and 15-MW machines. The Maritime Executive said, “The retrenchment was cited as the reason New York State canceled three selected projects that planned to use the larger turbines.”

Then on July 13, a blade on a 13-MW turbine shattered at the operating and under construction 804-MW Vineyard 1 project some 15 miles off Nantucket Island, spreading debris that washed up on the island and onshore on Cape Cod. The U.S. Interior Department shut the project down.

Then on Aug. 22 at the UK’s Dogger Bank offshore project — at 3.6 GW the world’s largest developing wind farm — a blade on a Halide turbine failed during commissioning, causing further headaches for GE Vernova. Bloomberg commented, “This was the latest failure by a GE Vernova blade in recent months — the string of incidents have been a public black eye for the company’s struggling offshore wind business. Another blade failed at the same Dogger Bank project in May, while a July failure at the Vineyard Wind project in the US led to shards of fiberglass washing ashore and closing beaches in one of the Northeast’s most expensive vacation destinations.”

GE Vernova’s offshore retreat may be good news for its competitors for the U.S. market. Denmark’s Vestas Wind System has just won an 816-MW order to power New York’s Empire 1 wind project with its 15-MW turbines, marking the company’s first offshore U.S. order. According to Vestas, the order includes “supply, delivery, and commissioning of the turbines, as well as a five-year comprehensive service agreement….”

Empire 1 was supposed to be the first of a two-phase, 2 GW project being developed by Norway’s 67% state owned Equinor along with BP, to supply power to the New York Power Authority, the Long Island Power Authority, and Con Edison. Equinor and BP tossed the second phase overboard in January, explaining, “This agreement reflects changed economic circumstances on an industry-wide scale and repositions an already mature project to continue development in anticipation of new offtake opportunities.”

Offshore wind in the Northeast has been struggling. Reuters reported last November, “Offshore wind developers have threatened in recent months to cancel contracts to sell power in New York after earlier dropping agreements in Massachusetts, Connecticut and New Jersey as soaring inflation, interest rates and supply chain problems led to much higher costs to build projects than anticipated.

“European energy companies Orsted, Equinor and BP have taken a combined $5 billion of writedowns on U.S. offshore wind projects that are mostly in development, in part because their existing power sales contracts would not cover the cost of building and financing the projects.”

American Legislative Exchange Council Adopts Energy Security ARC Model

The American Legislative Exchange Council (ALEC)’s draft model legislation, which bills itself as a “common sense energy agenda for the future,” has now become official model policy.

From Watts Up With That?

By Tim Benson

The American Legislative Exchange Council (ALEC)’s draft model legislation, which bills itself as a “common sense energy agenda for the future,” has now become official model policy.

The Affordable, Reliable and Clean Energy Security Act (Energy Security-ARC) states: “Energy Security is paramount to economic growth. Energy Security that is Affordable, Reliable, and Clean leads to prosperity for our families and communities.” The legislation was drafted by ALEC’s Energy, Environment and Agriculture Task Force.

According to ALEC, member-submitted draft model policies such as Energy Security-ARC are “discussed, debated, and voted on by ALEC task force members. Policies that receive final approval by legislators on the ALEC Board of Directors become official ALEC model policy.” The model policy is then disseminated to policymakers across the country in the hope that it will eventually be introduced in, and adopted by, state legislatures.

Energy Security-ARC has four sections. The first calls for energy security, declaring that a fuel source “must be primarily produced domestically within the United States,” and that the “infrastructure necessary to deliver energy to the customer should minimize reliance on foreign nations for critical materials or manufacturing.”

According to the U.S. Energy Information Administration, the United States imported roughly 8.51 million barrels of petroleum per day (b/d), 76% of which (6.48 million b/d) is crude oil. Some 52% of petroleum imports to the United States came from Canada, with another 11% coming from Mexico, 5% from Saudi Arabia, 4% from Iraq, and 3% from Brazil. Virtually all the natural gas imported by the United States comes from Canada.

The second section, concerning affordability, states that an “affordable” energy source must “have a stable and predictable cost,” be cost-effective and less expensive compared with other forms of energy resources, and be “readily available 24/7.” “Renewable” energy sources such as wind and solar would not meet these criteria.

The third section, covering reliability, establishes that for an energy source to be considered reliable, it must “be readily available to meet energy demands 24/7 with minimal interruptions during high usage periods,” and, when used for power generation, must have a “minimum” capacity factor of 50%. It must be capable of dispatchable electricity output at any time and able “to ramp up or down electricity generation within one hour” in order to stabilize the electrical grid. This resource must also have the ability to “complement and provide backup to renewable energy sources during periods of low availability.”

The fourth section declares that this energy source must be clean; it defines “green” energy as a resource that either “releases reduced air pollutants,” is generated by nuclear reactors, or is generated by natural gas.

Energy costs have significantly risen under the Joe Biden–Kamala Harris administration. According to a recent analysis from The Heartland Institute, Biden’s energy policies have sent costs upward by $2,548 since 2021. This is due to a 23% increase in the price of residential electricity, a 19% spike in the price of industrial electricity, a 69% explosion in the price of home heating oil, a 52% rise in the price of oil, and a 32% increase in the price of natural gas.

Cameron Sholty, executive director of Heartland Impact, The Heartland Institute’s advocacy arm, noted: “It’s important that state lawmakers are well-versed in the challenges facing their electrical grid and have conversations and policy ideas at the ready because these challenges are not going to subside as new technologies like EVs [electric vehicles] and data centers expand operations.” 

“States can be part of the solution and be leaders in their states and regions and can play a pivotal role in ensuring the long-term geopolitical and economic security of the country,” he continued.

“Rapidly rising energy prices are not accidental. They are the predictable result of Biden’s war on abundant, affordable and reliable energy,” the Heartland analysis states.

“Despite the fact that his climate agenda is directly responsible for the steep rise in energy prices, the Biden administration does not seem to be bothered whatsoever by the blunt reality that higher energy prices are making life much more difficult for the overwhelming majority of Americans.”

Tim Benson is a senior policy analyst at The Heartland Institute, a national, free-market think tank headquartered in Arlington Heights, Illinois.


ALEC is “America’s largest nonpartisan, voluntary membership organization of state legislators dedicated to the principles of limited government, free markets and federalism.” Its Energy, Environment and Agriculture Task Force “operates under the principles of free-market environmentalism . . . to promote the mutually beneficial link between a robust economy and a healthy environment, to unleash the creative powers of the free market for environmental stewardship, and to enhance the quality and use of our natural and agricultural resources for the benefit of human health and well-being.”

This article was originally published by RealClearEnergy and made available via RealClearWire.

NOAA’s U.S. Temperature Data Demonstrate that Population Growth UHIs & Measurement Inadequacies Drive Tavg Increasing Outcomes – Not Climate Change

NOAA’s U.S. contiguous U.S. summer (June through August) measured minimum and maximum temperatures trends over the period 1895 through 2024 (shown below from NOAA’s Climate at a Glance Times series data website) show clear and distinct differing temperature trend increasing growth compared to the calculated average temperature trend outcome.

From Watts Up With That?

Guest essay by Larry Hamlin

NOAA’s U.S. contiguous U.S. summer (June through August) measured minimum and maximum temperatures trends over the period 1895 through 2024 (shown below from NOAA’s Climate at a Glance Times series data website) show clear and distinct differing temperature trend increasing growth compared to the calculated average temperature trend outcome.

The minimum temperature trend outcomes after 1985 climb significantly faster than do the maximum measured temperature trend outcomes. U.S. population data shows an increase of about 100 million during the 1980 to 2023 period.

Since the average temperature is not a measured value but instead the calculated mathematical average of the minimum and maximum measured temperatures {(TMax + TMin)/2} the average temperature calculated trend outcome is controlled and dominated by the much larger increase occurring in the minimum measured temperature trend versus the maximum measured temperature trend.    

This differing trend distinction can be more clearly seen in the graphs below where the NOAA Climate at a Glance website time period interval is broken into the time intervals from 1895 to 1950 and 1950 to 2024 (where the Tavg value is controlled by Tmin not Tmax) respectively as shown below.

This outcome is consistent with and reflects the results of Dr. Spencer’s recent study shown below and found here.

Dr. Spencer also provided another study which displayed in graphical form the UHI impacts of U.S. and Global wide temperatures during the period June 1850 through June 2023 as shown below and found here.

In addition to large population growth UHIs acting as a prime driver of rising calculated Tavg temperature outcomes, these temperature measurements are also being significantly impacted by NOAA’s improper siting of thousands of temperature measurement stations.

These thousands of improperly sited temperature measurement devices do not meet NOAA/NWS siting standards and are located far too close to artificial heat sinks that falsely increase both maximum and minimum temperature measurements as addressed in detail here with an example clearly illustrating this huge system wide measurement problem shown below.

As noted in this report (page 18) the year 2019 Oak Ridge National Laboratory measurement station data accuracy experiment showed that flawed station siting temperature measurement impact outcomes were much greater during the evening periods (heat sink contributions to minimum temperatures were a factor of 3 larger than maximum day temperature contributions) versus during the day.      

NOAA bases its evaluation of U.S. and global average temperature anomaly value changes over time by using and comparing the calculated Tavg values over time.

As indicted by the temperature measurement graphs and studies noted above NOAA’s contiguous U.S. calculated Tavg increasing trend values since about 1985 are clearly driven upward by station measurement siting flaws and UHI Tmin outcomes versus Tmax measured outcomes.

This results in NOAA’s calculated Tavg assessments of increasing temperature anomalies over time being a flawed and exaggerated claim driven by NOAA’s measurement siting inadequacies and population growth driven UHI impacts – and not “climate change”.

This outcome is also applicable to NOAA’s global wide calculated Tavg temperature anomaly increasing trend assessments as well.

Elites’ Energy Fantasies Abound

Electricity is slippery stuff, in that it can be difficult to properly grasp what it is or how to quantify it. We can blame the school system. Teachers who were taught social politics at University must somehow teach mathematics and physics.

From Science Matters

By Ron Clutz

Stephen Barrett reports on ruminations from technically challenged overlords in his Spectator Australia article by way of John Ray’s blog The chattering climate class and their war on coal. Excerpts in italics with my bolds and added images.

The Climate Chattering Class is now telling each other:
No Such Thing as Baseload Electrical Power.

Electricity is slippery stuff, in that it can be difficult to properly grasp what it is or how to quantify it.  We can blame the school system. Teachers who were taught social politics at University must somehow teach mathematics and physics.

There is a reason for everything in the world and that reason usually comes down to physics until politics gets mixed in. This is a problem. In politics, the same big lie can be repeated many times, as loudly as possible, until people accept it as truth or give up trying to argue the toss.

Readers will be familiar with the nameplate rating on wind farms and solar plants. It lists the rated output under ideal circumstances, measured in watts. If a heater has 1,000W we all understand it is telling us the output at one instant in time. Consumption is a different thing and is measured in watts/hour. Reversing this, we can understand we are seeing a generator’s nameplate watts as the size of the generator and watt hours as how much it provides.

An interesting idea making its way around the energy conversation
at present is that there is no such thing as baseload energy.

The lie is perpetrated by the political system which is, at present, intending to destroy the concept (and existence) of baseload energy. Baseload is created by heavy generators that operate all day, every day, and are typically cheap. The disadvantage of this structure is that baseload plants usually take time to reach full production. Then, they need to run for extended periods of time to be economically viable. Coal and nuclear are the only two types feasible for most of the Australian market.

Gas and diesel plants can provide electricity but they are expensive when operated in this way. Peaking power is where gas comes to the fore. It can be fired up quickly and make electricity rapidly. This is ideal for peaks when people come home from their day and want heating or cooling and to cook. Gas can cover this surge very happily. Diesel is lovely stuff and great in remote locations where there is no access to the grid or if the grid fails. It might not be pretty, but it delivers when needed.

In the whole clean grid argument, those words should be enshrined…
‘When it is needed.’

Coal, nuclear, gas, and diesel will deliver when needed. Reliability has been ignored by the chattering classes who have created the current disaster of high prices and brownouts that continue to destroy various industries.

Perhaps that is the whole point of ‘renewable’ energy.  I put that in quotes because the best figures I can find are that they only return seven-tenths of the power used to build them.

Every wind tower is a hallmark to coal-fired power being able to carry inefficient freeloaders. Freeloaders because renewable technologies can never produce energy when it is needed, only when it wishes.

Solar and wind dump themselves on the energy market, making it impossible for reliable supplies to remain economic. If they had to obey the same bidding rules, they would never survive.

Let’s compare the costs of wind, solar, and nuclear. To do this we can look at the Shepherds Flat Wind Farm, Topaz Solar Farm, and Barakah Nuclear Power Plant.

We can skittle the first anti-nuclear claim about taking too long to build. Barakah was completed within eight years. The global average for modern nuclear plant construction (globally) is between seven and eight years. Sadly in Australia we have a less than helpful public service that thrives on inefficiency that might drag out this timeline.

The nameplate ratings on these plants were 845MW for Shepherds Flat, 550MW for Topaz and 5,600MW for Barakah. Nuclear can appear expensive if you compare build cost against the nameplate rating but not markedly. Shepherds Flat cost $2 billion, Topaz $2.5 billion, and Barakah $24.4 billion. Comparing build cost to nameplate rating, Shepherds Flat Wind cost 42 cents/MW, Topaz Solar 22 cents/MW, and Barakah Nuclear 23 cents/MW.

Looking at the size per dollar, nuclear is almost as good as solar and better than wind. The issue already demonstrated is not size as much as provision. That nameplate value is giving you one second of use. One second later, you are going to need that much again. This means the Watt/Hrs is crucial.

This is where wind and solar fail massively. The watts produced are not as important as the Watt Hours provided to the market. Assuming a generous 25-year life span for Shepherds Flat, 30 years for Topaz, and a mean-spirited 60 years for Barakah (when it is likely to still be running 100 years after it started), I calculated the GWh per annum compared to the Build Price over the life of the project. That is Build Price divided by annual GWh times lifespan.

Shepherds Flat was $40,000, Topaz $75,000 and Barakah $9,300.

On this measure, nuclear is significantly cheaper, but the price of firming wind and solar is not added to their totals. So that you can have power on those hot still days of summer when the wind doesn’t blow or the cold nights of winter when the sun is not shining you will need either nuclear or coal to provide you with the electricity you need.

We can discuss batteries some other time, but the new super battery has been coming about as long as perpetual motion and flying cars. Lithium ion batteries are old tech that has been developed to a point of maturity where there is little left to squeeze out of them and without mountains we are not going to get enough pumped hydro no matter how economically bad that model is.

If I magically had the power I would build more coal-fired stations, only because nuclear will need time to be made legal and that cannot be predicted. Nuclear however beats wind and solar to bits as far as costs and output and reliability are concerned.

Rule of Law vs. Eco-obstruction

The activist climate fringe finds their cause in trouble. Their termite cause is losing to consumers who want the best energies in terms of price and reliability; losing with taxpayers who are on the hook for ‘energy transition’ bribes; losing with the public that is tired of the rhetoric, exaggeration, and now targeted inconvenience. And, losing with nature as energy sprawl accelerates with industrial wind, solar, and batteries.

From Master Resource

By Robert Bradley Jr.

“[I am] worried that events like this could harm the cause to which I (and so many) have devoted my life. From a communications standpoint, the protest seemed like an even bigger mess than the soup-splattered painting.” – Michael Mann (below)

The activist climate fringe finds their cause in trouble. Their termite cause is losing to consumers who want the best energies in terms of price and reliability; losing with taxpayers who are on the hook for ‘energy transition’ bribes; losing with the public that is tired of the rhetoric, exaggeration, and now targeted inconvenience. And, losing with nature as energy sprawl accelerates with industrial wind, solar, and batteries.

Yet the anti-modern-living Deep Ecologists myopically target carbon dioxide (CO2), the green greenhouse gas, the gas of life. Turning to civil disobedience only inflames the public against a selfish fringe. Yet the apologists are out in force.

“There seems to be no end to the destruction being wrought by Big Oil,” complained climate activist Assaad Razzouk on social media. He quoted from a Guardian article that said “lobbyists working for major North American oil and gas companies were key architects of anti-protest laws that increase penalties and could lead to non-violent environmental and climate activists being imprisoned up to 10 years.”

The “peaceful protests” are being squashed by authoritarian government. The Guardian article, “Revealed: How the Fossil Fuel Industry Helps Spread Anti-Protest Laws Across the US,” stated:

Amid ongoing record oil and gas expansion in the US, activists say they have turned to protests and non-violent civil disobedience such as blocking roads and chaining themselves to trees, machinery and equipment as a way to slow down construction, raise public awareness, and press for more urgent climate action by governments and corporations.

Losing Fight

The climate movement has encountered a populist revolt, as documented by Politico. “Conservatives are aggressively targeting efforts to reduce carbon emissions across the continent.”

Leaders across the continent who have embraced aggressive climate policies are facing a political backlash as the programs drive up the cost of electricity, home heating and even ordinary goods. In New York, Washington, Pennsylvania and California — and even Canada — concerns about the costs of curbing greenhouse gas emissions are fueling voter revolts and prompting some liberals to scale back or reframe their own climate ambitions.

What sociologists call the “radical flank effect” has alarmed at least one leading climate alarmist. “I have devoted much of my time and effort over the past several decades to the cause of meaningful climate action,” wrote Michael Mann.

[I am] worried that events like this could harm the cause to which I (and so many) have devoted my life. From a communications standpoint, the protest seemed like an even bigger mess than the soup-splattered painting.

Keep on with selfish, nutty displays, and public opinion will continue to side with common sense and civil discourse, not obstructionism. It is a futile, wasteful cause. Carbon dioxide (CO2) deserves a lot better–and wind, solar, and batteries a lot worse, another story.

First hint of energy squeeze and Big Tech drops the wind and solar purity, and launches into nuclear power

Google, Oracle, Microsoft were all raving fans of renewable energy, but all of them have given up trying to reach “net zero” with wind and solar power. In the rush to feed the baby AI gargoyle, instead of lining the streets with wind turbines and battery packs, they’re all suddenly buying, building and talking about nuclear power. For some reason, when running $100 billion dollar data centres, no one seems to want to use random electricity and turn them on and off when the wind stops. Probably because without electricity AI is a dumb rock.

From JoNova

By Jo Nova

All those sustainable dreams, gone pfft

Google, Oracle, Microsoft were all raving fans of renewable energy, but all of them have given up trying to reach “net zero” with wind and solar power. In the rush to feed the baby AI gargoyle, instead of lining the streets with wind turbines and battery packs, they’re all suddenly buying, building and talking about nuclear power. For some reason, when running $100 billion dollar data centres, no one seems to want to use random electricity and turn them on and off when the wind stops. Probably because without electricity AI is a dumb rock.

In a sense, AI is a form of energy. The guy with the biggest gigawatts has a head start, and the guy with unreliable generators isn’t in the race.

It’s all turned on a dime. It was only in May that Microsoft was making the “biggest ever renewable energy agreement” in order to power AI and be carbon neutral. Ten minutes later and it’s resurrecting the old Three Mile Island nuclear plant. Lucky Americans don’t blow up their old power plants.

Oracle is building the world’s largest datacentre and wants to power it with three small modular reactors. Amazon Web Services has bought a data centre next to a nuclear plant, and is running job ads for a nuclear engineer.  Recently, Alphabet  CEO Sundar Pichai, spoke about small modular reactors. The chief of Open AI also happens to chair the boards of two nuclear start-ups.

The AI Boom Is Raising Hopes of a Nuclear Comeback

The AI boom has left technology companies scrambling for low-carbon sources of energy to power their data centers. The International Energy Agency estimates that electricity demand from AI, data centers, and crypto could more than double by 2026. Even its lowball estimates say that the added demand will be equivalent to all the electricity used in Sweden or—in the high-usage case—Germany.

Australia uses ten times as much electricity as Microsoft, but is still fantasizing about reaching 82% renewable by 2030 with no nuclear power “because it will cost too much and take too long”.  Microsoft uses 24 TWh of energy a year and employs 220,000 people, and knows it needs a nuclear plant to be competitive (and reach, albeit frivolous weather changing ideals). Australia uses 274 TWh of electricity, and employs 14 million people but is going to aim for frivolous climate witchery anyway, and do it the double-hard way.

Who needs to be competitive, right?

Pierre Gosselin discusses how Germany risks being left behind because it has switched off all its nuclear plants. At least it has some power lines to France. Australia has no nukes, not much hydro, no mountains to spare, is the driest inhabited continent on Earth, and it has no powerlines to anywhere. We are the crash test dummy. Soon most big companies will have more reliable power than we do.

Strongest Solar Flare Yet of Solar Cycle 25 Took Place Earlier Today…CME To Strike This Weekend with Widespread Auroras Possible

Solar Cycle 25 is nearing its solar maximum and – as is typical during this phase of a solar cycle – there has been a lot of solar activity in recent weeks with numerous sunspots. The strongest solar flare yet during this current solar cycle took place earlier today with an explosion originating from sunspot region known officially as “AR3842”. NASA’s Solar Dynamics Observatory recorded today’s blast as an X9.0 (where X-class denotes the most intense flares) and it may result in widespread auroras this weekend as the “coronal mass ejection” strikes Earth.

Sunspot region AR3842 (circled) unleashed the strongest flare yet of the current Solar Cycle #25 and the CME strikes Earth this weekend with auroras on the table. Image courtesy NASA

From Watts Up With That?

Overview

Solar Cycle 25 is nearing its solar maximum and – as is typical during this phase of a solar cycle – there has been a lot of solar activity in recent weeks with numerous sunspots. The strongest solar flare yet during this current solar cycle took place earlier today with an explosion originating from sunspot region known officially as “AR3842”. NASA’s Solar Dynamics Observatory recorded today’s blast as an X9.0 (where X-class denotes the most intense flares) and it may result in widespread auroras this weekend as the “coronal mass ejection” strikes Earth.

Sunspot region AR3842 (circled) unleashed the strongest flare yet of the current Solar Cycle #25 and the CME strikes Earth this weekend with auroras on the table. Image courtesy NASA

Details

Solar flares are powerful bursts of energy which can impact radio communications, electric power grids, navigation signals and pose risks to spacecraft and astronauts. Today’s solar flare – the strongest yet for Solar Cycle 25 – peaked at 8:18 AM (ET) and was captured by NASA’s Solar Dynamics Observatory as a bright flash. Today’s flare is classified as an X9.0 flare where X-class denotes the most intense type.

Radiation from the flare ionized the top of Earth’s atmosphere according to spaceweather.com triggering shortwave radio blackouts over Africa and Europe, the sunlit portion of Earth at the time of eruption. The shortwave radio blackouts experienced over Europe and Africa were a result of the radiation from the solar flare reaching Earth and ionizing the upper atmosphere upon arrival. This ionization creates a denser environment for high-frequency shortwave radio signals, which facilitate long-distance communication, to travel through. As these radio waves pass through ionized (electrically charged) layers, they lose energy due to increased collisions with electrons which can weaken or entirely absorb the radio signals. 

Graphic courtesy NOAA/Space Prediction Center

Preliminary coronagraph images show a “halo” coronal mass ejection or CME – a plume of plasma and magnetic field – emerging from the blast site which is likely to strike the Earth on Sunday, October 6th. As a result, auroras are on the table this weekend in the usual northern latitude areas and potentially farther to the south compared to normal. A couple of days ago on October 1st, there was an X7.1 class solar flare that originated from the same sunspot region and its associated CME is closing in on Earth and likely to arrive by tomorrow, October 4th, potentially causing a strong geomagnetic storm.

This uptick in solar activity during the past several weeks comes as Solar Cycle 25 near its maximum phase which is likely to be reached sometime in 2025. Solar Cycle 25 began during December of 2019 and is expected to continue until around 2030. The cycle is characterized by the sun’s transition from a relatively calm state to one that is active and then back to quiet again…often over about an 11-year time period. There has not been a single day in 2024 or 2023 that featured a spotless sun and only one such day took place in 2022. During the last solar minimum phase in 2019, there were 281 spotless days which made up 77% of the year.

Meteorologist Paul Dorian
Arcfield
arcfieldweather.com

Follow us on Facebook, Twitter, YouTube

Massive Electricity Price Rises Expected as National Grid Confirms Gas is the Only Back-Up for Intermittent Renewables

The cat is finally out of the bag. It is planned that Britain by 2030 will produce 95% of its electricity from so-called green sources with 5% coming from gas. The pretence that electricity can be stored at scale to support unreliable renewables is nowhere to be seen in a recent Guardian interview with Fintan Slye, the head of National Energy System Operator (NESO). “There will continue to be a significant amount of power plants in reserve for the cold, dull, windless weeks of winter, but they will run for only limited periods,” observes Slye, whose operation was recently nationalised and is responsible for balancing supply and demand across the National Grid.

From The Daily Sceptic

By Chris Morrison

The cat is finally out of the bag. It is planned that Britain by 2030 will produce 95% of its electricity from so-called green sources with 5% coming from gas. The pretence that electricity can be stored at scale to support unreliable renewables is nowhere to be seen in a recent Guardian interview with Fintan Slye, the head of National Energy System Operator (NESO). “There will continue to be a significant amount of power plants in reserve for the cold, dull, windless weeks of winter, but they will run for only limited periods,” observes Slye, whose operation was recently nationalised and is responsible for balancing supply and demand across the National Grid.

His remarks both clarify and strike fear at the same time. There is no back-up at scale for intermittent breezes and sunbeams and this has been obvious for some time, although the subject is rarely discussed in mainstream media and politics. Reserve gas generation is the only game in town if all life in Britain is not to grind to a halt during a windless, winter freeze. But keeping an entire fleet of gas turbines on standby will cost a huge amount of money, causing electricity prices to soar. The planned destruction of Britain’s own gas and oil industry will hardly help future sourcing and pricing, let alone national security.

Britain already has some of the highest electricity prices in the developed world and doubling, trebling or quadrupling charges will help destroy what is left of industry and condemn the population to drastically falling standards of living. As always with green punch-down lunacy, the poorest in society will be the hardest hit. Many people will be priced out of basic necessities they have always taken for granted such as light, heat, refrigeration, cooking facilities and electronic goods to access the online world.

One commonly peddled fantasy can be found in the Guardian article. “Conversely, there will be days when Great Britain generates far more electricity from renewable sources than it can use or store, so there are likely to be greater exports to neighbouring countries,” notes Slye. But of course weather does not stop at national boundaries. Nearby countries are likely to share similar windy conditions and with every operator trying to offload energy, the price offered would drop like a stone towards zero.

Already in the U.K., the National Grid is forced to pay renewable operators to stop producing energy. Last year, ‘constraint’ payments of nearly £1 billion were paid. It might be noted that this is not far short of the amount recently saved by scrapping the pensioners’ winter fuel allowance. But these sums are chicken feed compared with the overall subsidies paid to renewable energy operators, with over £12 billion added to the annual fuel bills of consumers. The more renewable generating capacity is added to the mix, the more the constraint payments and subsidies are likely to increase. With bunce like this, it is hardly surprising that Ecotricity boss Dale Vince, who runs onshore windmills, recently gifted £5 million to improve the election chances of the Labour party.

It is likely that the Mad Miliband is set on a 75-80% contribution to the grid from the breezes and the beams. Again we must be obliged to the Guardian for covering the subject in such detail and pointing out so vividly the further difficulties that are likely to arise when the wind drops during the 18 hours of winter darkness. Basically, the price goes up, in fact it soars up to 20 times higher. In March 2023, the Guardian reported that the grid was forced to buy gas-generated power in a windless cold period at £1,950 per megawatt hour (MWh). The usual price is around £100 MWh. One industry source  is reported to have said the price of sourcing power from gas peaking plants had “raised eyebrows”. Vitol is the largest oil trader in the world and knows something about securing the best market-determined rate. At this time it offered a price of £5,750 per MWh although the offer from its Rye House subsidiary was not accepted.

In an article published by the Manhattan Contrarian, Francis Menton discusses the “disastrous economics” of trying to power an electric grid with 100% intermittent renewables. The move inevitably brings about large increases in the actual price of electricity that must be paid by consumers. But he doesn’t just rely on theoretical calculations. “In those jurisdictions that have succeeded in getting generation from renewable up to as high as about 30% of their total electricity supply [Britain hit around 34% in 2023], the result has been an approximate tripling in the price of electricity for their consumers,” he states. Furthermore, he continues: “As the percentage of electricity coming from renewables increases, the consumer price increases accelerate.”

In his social media blockbuster Climate: The Movie, Martin Durkin introduces it as the story of how an eccentric environmental scare grew into a powerful global industry. “Climate change is an invented scare of self-interest and snobbery, cynically promoted by a parasitic, publicly-funded establishment hungry for power and money,” he charges. He could not have summed up better the drive to the command-and control Net Zero project.  Deliberately making energy more expensive by ‘de-carbonising’ the U.K. grid by 2030 is just one of the many economic and societal changes being planned by the new Labour hegemony.

Chris Morrison is the Daily Sceptic’s Environment Editor.

18 yr. Plateau September Arctic Ice 2024

Earlier observations showed that Arctic ice extents were low in the 1940s, grew thereafter up to a peak in 1977, before declining. That decline was gentle until 1996 which started a decade of multi-year ice loss through the Fram Strait. There was also a major earthquake under the north pole in that period. In any case, the effects and the decline ceased in 2007, 30 years after the previous peak. Now we have a plateau in ice extents, which could be the precursor of a growing phase of the quasi-60 year Arctic ice oscillation.

From Science Matters

By Ron Clutz

September daily extents are now fully reported and the 2024 September monthly results can be compared with those of the previous 17 years.  MASIE showed 2024 at 4.6M km2  and SII was slightly lower, reaching 4.4M for the month.  Analysis below shows that the 2024 annual Minimum month was 75k km2 lower than the 18 year average, and was 256 km2 greater than 2007.  The 18 yr. trendlines are virtually flat and matching the averages of 4.6M km2 for the period since 2007.

In August, 4.27M km2 was the median estimate (range 4.11 to 4.54) for the September monthly average extent from the SIPN (Sea Ice Prediction Network) who use the reports from SII (Sea Ice Index), the NASA team satellite product from passive microwave sensors. The SII actual ice extent average was ~100k km2 higher than estimated.

The graph below shows September comparisons through day 274 (Sept. 30).

The graph has some unusual things to note. The typical September is shown by the black line, which reaches the daily minimum on day 260 and ends the month ~100k km2 higher than the beginning. 2024 was unusual by matching average the first half, appearing on day 255 to hit minimum, then going above average on day 260.  Surprisingly, the last two weeks MASIE showed a steady loss of ice extent down to a minimum on day 272, and recovering the last two days.  Instead of a slight gain, MASIE showed September 2024 losing ~400k km2 by month end.

2007 also started matching average, but went down steeply losing more than half a wadham below average on day 261, then recovering slightly but ending ~800k km2 below average on day 274.

The orange line shows SII starting much lower than MASIE, then the dataset is missing six days mid month. Finally, ice extents rise above MASIE by the end, reaching ~200k km2 above the SII month beginning. I calculated the monthly average for SII from the data provided, though the official number may differ once it is reported.

The table shows ice extents in the regions for 2024, 18 year averages and 2007 for day 274. Averages refer to 2006 through 2023 inclusive.

Region2024274Day 274 Ave2024-Ave.20072742024-2007
 (0) Northern_Hemisphere44461175013499-5673824196873249243
 (1) Beaufort_Sea280737564271-283534503548-222811
 (2) Chukchi_Sea3502612143021359581065349196
 (3) East_Siberian_Sea32040930783812571311320098
 (4) Laptev_Sea20722016974537475237446-30226
 (5) Kara_Sea33939310-3897115857-15518
 (6) Barents_Sea015734-157344851-4851
 (7) Greenland_Sea163963250200-86237353210-189247
 (8) Baffin_Bay_Gulf_of_St._Lawrence3814157714-1957351770-13629
 (9) Canadian_Archipelago112998388756-275757302221-189223
 (10) Hudson_Bay03062-30621936-1936
 (11) Central_Arctic29682863001441-331552723382.15244904

The major deficits are in Beaufort, Greenland sea and Canadian Archipelago. Only Chukchi shows an offsetting surplus.  Overall, the NH ice extent is 567k km2 or 11% below average.

Summary

Earlier observations showed that Arctic ice extents were low in the 1940s, grew thereafter up to a peak in 1977, before declining.  That decline was gentle until 1996 which started a decade of multi-year ice loss through the Fram Strait.  There was also a major earthquake under the north pole in that period.  In any case, the effects and the decline ceased in 2007, 30 years after the previous peak.  Now we have a plateau in ice extents, which could be the precursor of a growing phase of the quasi-60 year Arctic ice oscillation.

Background 

A commenter previously asked, where do they get their data? The answer is primarily from NIC’s Interactive Multisensor Snow and Ice Mapping System (IMS). From the documentation, the multiple sources feeding IMS are:

Platform(s) AQUA, DMSP, DMSP 5D-3/F17, GOES-10, GOES-11, GOES-13, GOES-9, METEOSAT, MSG, MTSAT-1R, MTSAT-2, NOAA-14, NOAA-15, NOAA-16, NOAA-17, NOAA-18, NOAA-N, RADARSAT-2, SUOMI-NPP, TERRA

Sensor(s): AMSU-A, ATMS, AVHRR, GOES I-M IMAGER, MODIS, MTSAT 1R Imager, MTSAT 2 Imager, MVIRI, SAR, SEVIRI, SSM/I, SSMIS, VIIRS

Summary: IMS Daily Northern Hemisphere Snow and Ice Analysis

The National Oceanic and Atmospheric Administration / National Environmental Satellite, Data, and Information Service (NOAA/NESDIS) has an extensive history of monitoring snow and ice coverage.Accurate monitoring of global snow/ice cover is a key component in the study of climate and global change as well as daily weather forecasting.

The Polar and Geostationary Operational Environmental Satellite programs (POES/GOES) operated by NESDIS provide invaluable visible and infrared spectral data in support of these efforts. Clear-sky imagery from both the POES and the GOES sensors show snow/ice boundaries very well; however, the visible and infrared techniques may suffer from persistent cloud cover near the snowline, making observations difficult (Ramsay, 1995). The microwave products (DMSP and AMSR-E) are unobstructed by clouds and thus can be used as another observational platform in most regions. Synthetic Aperture Radar (SAR) imagery also provides all-weather, near daily capacities to discriminate sea and lake ice. With several other derived snow/ice products of varying accuracy, such as those from NCEP and the NWS NOHRSC, it is highly desirable for analysts to be able to interactively compare and contrast the products so that a more accurate composite map can be produced.

The Satellite Analysis Branch (SAB) of NESDIS first began generating Northern Hemisphere Weekly Snow and Ice Cover analysis charts derived from the visible satellite imagery in November, 1966. The spatial and temporal resolutions of the analysis (190 km and 7 days, respectively) remained unchanged for the product’s 33-year lifespan.

As a result of increasing customer needs and expectations, it was decided that an efficient, interactive workstation application should be constructed which would enable SAB to produce snow/ice analyses at a higher resolution and on a daily basis (~25 km / 1024 x 1024 grid and once per day) using a consolidated array of new as well as existing satellite and surface imagery products. The Daily Northern Hemisphere Snow and Ice Cover chart has been produced since February, 1997 by SAB meteorologists on the IMS.

Another large resolution improvement began in early 2004, when improved technology allowed the SAB to begin creation of a daily ~4 km (6144×6144) grid. At this time, both the ~4 km and ~24 km products are available from NSIDC with a slight delay. Near real-time gridded data is available in ASCII format by request.

In March 2008, the product was migrated from SAB to the National Ice Center (NIC) of NESDIS. The production system and methodology was preserved during the migration. Improved access to DMSP, SAR, and modeled data sources is expected as a short-term from the migration, with longer term plans of twice daily production, GRIB2 output format, a Southern Hemisphere analysis, and an expanded suite of integrated snow and ice variable on horizon.

http://www.natice.noaa.gov/ims/ims_1.html

Footnote

Some people unhappy with the higher amounts of ice extent shown by MASIE continue to claim that Sea Ice Index is the only dataset that can be used. This is false in fact and in logic. Why should anyone accept that the highest quality picture of ice day to day has no shelf life, that one year’s charts can not be compared with another year?

MASIE is rigorous, reliable, serves as calibration for satellite products, and continues the long and honorable tradition of naval ice charting using modern technologies. More on this at my post Support MASIE Arctic Ice Dataset

Microsoft ‘Buys’ Nuclear Power Plant to Run AI – and it’s Showing Us the Future

On September 20th there was an announcement by a little known energy company located in Baltimore Pennsylvania:

Constellation announced today the signing of a 20-year power purchase agreement with Microsoft that will pave the way for the launch of the Crane Clean Energy Centre (CCEC) and restart of Three Mile Island Unit 1, which operated at industry-leading levels of safety and reliability for decades before being shut down for economic reasons exactly five years ago today. Under the agreement, Microsoft will purchase energy from the renewed plant as part of its goal to help match the power its data centers in PJM use with carbon-free energy.

From The Daily Sceptic

By Nick Bowler

On September 20th there was an announcement by a little known energy company located in Baltimore Pennsylvania:

Constellation announced today the signing of a 20-year power purchase agreement with Microsoft that will pave the way for the launch of the Crane Clean Energy Centre (CCEC) and restart of Three Mile Island Unit 1, which operated at industry-leading levels of safety and reliability for decades before being shut down for economic reasons exactly five years ago today. Under the agreement, Microsoft will purchase energy from the renewed plant as part of its goal to help match the power its data centers in PJM use with carbon-free energy.

There are two highly significant things about this announcement. The first is that the company operates a nuclear reactor at Three Mile Island, the site of one of the world’s biggest nuclear accidents. The reactor was due to be decommissioned in the next few years and the plant shut down completely, but it now has been given a new lease of life with this deal. If Constellation gains approval from its local authorities to go ahead with the project, it will truly be a turning point for the future of nuclear energy.

The second significant fact is that the purchaser of the entire output of this reactor for the next 20 years is Microsoft. The technology giant will build a new plant to develop AI nearby, and it will need the output of a nuclear reactor to guarantee the energy requirements of the project.

The anticipated huge surge in energy demand from this sector (all of which has to be in the form of electricity) is prompting AI companies to make deals with energy companies to secure their slice of the cake in a world where energy security is becoming less and less certain.

AI is set to surpass even the huge energy consumption requirements of digital crypto-currency transactions and storage.

It takes a very long time to build a new nuclear power station, so the spotlight is now turning to small modular reactors (SMRs) for a faster turnaround. These can be built and commissioned a great deal more quickly than conventional reactors, assuming of course that the political will is there to approve their construction in the first place.

There are many companies eyeing the opportunity presented by this new technology. Amongst others, Rolls Royce is getting in on the act – with an emphasis already on “clean and affordable”, tying the technology in to the green revolution in order to win Government backing.

All of this provides both a problem and a solution for the Labour Government’s drive towards Net Zero. It is becoming increasingly clear to many people that the limitations and costs of Net Zero are going to far outweigh the benefits of trying to reach the lofty goals contained in the eco-aspirations of the current Government.

In particular, as many articles on this website have attested to, it will be impossible to rely on renewable sources of energy without a constant power backup. As fossil fuels are ruled out, that leaves only one currently viable source at reasonable price levels: nuclear energy.

However, nuclear energy comes with a severe political taint due to a long history of fear-mongering and negativity, associated for decades with Labour party opposition to the Trident missile system.

The political activism group Campaign for Nuclear Disarmament (CND), which opposes all forms of nuclear energy, saw a surge in membership when Tony Blair announced plans to expand U.K. nuclear power capacity in 2007.

This rekindling of public anxiety at that time must contain a warning to the Labour Government when it comes to try to ‘sell’ nuclear to its supporters and the public. But how much choice will it really have in the matter? The catalyst for the change is coming from the AI revolution, which doesn’t look like it has any intention of being stopped in its tracks.

This is what Yann lecCun, the Chief AI Scientist at Meta had to say about the deal with Constellation:

AI datacentres will be built next to energy production sites that can produce gigawatt-scale, low-cost, low-emission electricity continuously.

Basically, next to nuclear power plants.

The advantage is that there is no need for expensive and wasteful long-distance distribution infrastructure.

Note: yes, solar and wind are nice and all, but they require lots of land and massive-scale energy storage systems for when there is too little sun and/or wind. Neither simple nor cheap.

AI datacenters will be built next to energy production sites that can produce gigawatt-scale, low-cost, low-emission electricity continuously.
Basically, next to nuclear power plants.
The advantage is that there is no need for expensive and wasteful long-distance distribution… https://t.co/bVxNmYZiQh— Yann LeCun (@ylecun) September 22, 2024

AI and nuclear energy are a marriage made in heaven it seems. It holds out hope for a more sensible energy policy in the U.K. to be developed after all. But expect to see all kinds of hand-wringing and hypocritical statements from the Government as it tries to make nuclear power palatable to its Left-wing supporters.