MEDIA ADVISORY: Hurricane Milton Historic, Not Unprecedented

Hurricane Milton is on track Wednesday to be one of the biggest storms to ever hit the Tampa Bay, Florida area, and is one of the few Category 5 hurricanes on record in the satellite era (1966-onwards). It may join Hurricane Michael in 2018 as the only Category 5 hurricanes to form in the Gulf of Mexico in October and make landfall at that strength.

Press Release from The Heartland Institute

It is wrong to blame human activity and โ€˜climate changeโ€™ for strength of hurricane

Storm of similar size and strength hit Tampa Bay area in 1848 and 1921 when human contributions to carbon dioxide in atmosphere was negligible

Even the United Nationsโ€™ Intergovernmental Panel on Climate Change (IPCC) says thereโ€™s no climate signal in tropical storms

ARLINGTON HEIGHTS, IL (October 8, 2024) โ€“ Hurricane Milton is on track Wednesday to be one of the biggest storms to ever hit the Tampa Bay, Florida area, and is one of the few Category 5 hurricanes on record in the satellite era (1966-onwards). It may join Hurricane Michael in 2018 as the only Category 5 hurricanes to form in the Gulf of Mexico in October and make landfall at that strength.

While the history of Gulf hurricanes growing this strong and making a direct hit on Tampa Bay shows this is a rare occurrence, it is not unprecedented and โ€œclimate changeโ€ driven by human emissions of carbon dioxide is not to blame.

Climate and environment experts at The Heartland Institute โ€“ James Taylor, Anthony Watts, H. Sterling Burnett, Linnea Lueken, and Steven Milloy โ€“ are available to the media to provide historical context for this storm.

They provide quotes below the following facts and perspective section of this release. To reach them for comment, please contact Vice President and Director of Communications Jim Lakely at media@heartland.org or call/text 312-731-9364.

FACT: Milton not without precedent

Storms of similar size and strength struck the Tampa Bay area in 1848 and 1921. And the National Oceanic and Atmospheric Administration has tracked at least 146 hurricanes that have formed in the Gulf since 1851.

Historical data show there has been little to no long-term trend since 1900 in Florida major hurricane activity through Hurricane Helene, which hit the panhandle last month.

People born in the 1950s or later did not experience the record-high hurricane activity of the 1940s, and the early 1900s activity was likely under-reported as virtually no one lived in Florida in 1900.

The following plot shows the intensity of major hurricanes (100 knots or greater maximum sustained wind speed) striking Florida since 1900, updated through Helene:

FACT: No trend in hurricane โ€œintensificationโ€

Many may claim that the rapid intensification of Milton is unprecedented. That is also false. As the chart below shows โ€“ based on a study in the journal Geophysical Research Letters โ€“ there is no significant upward trend in โ€œrapid intensificationโ€ in hurricanes that form in the North Atlantic and Gulf of Mexico in the last 33 years.

FACT: No upward trend in hurricane activity

There is also no upward trend in global cyclone activity since 1980.

FACT: IPCC says no climate signal in tropical storms

Climate science itself says there is no connection between climate change and hurricane strength or frequency. In Table 12.12 on Page 90 โ€“ Chapter 12 of the UN Intergovernmental Panel on Climate Change (IPCC) Sixth Assessment Report (2023). Emergence of Climate Impact Drivers (CIDs) in time periods, shows no indication of a connection in the present, nor in the future.

The color in the table below corresponds to the confidence of the region with the highest confidence: white colors indicate where evidence of a climate change signal is lacking or the signal is not present, leading to overall low confidence of an emerging signal. Note the colors for Tropical Cyclones in the table screencap below:

The following statements may be used with attribution. For more information about historical trends, please visit The Heartland Instituteโ€™s Climate at a Glance website.

  • Florida, and especially the Tampa area, has been enjoying a golden age of hurricane avoidance.
  • The Tampa area is uniquely vulnerable to hurricane strikes and a major hurricane strike will likely be catastrophic, even apocalyptic. Scientists tell us it is remarkable that no major hurricanes have struck Tampa for more than a century, and Tampa has long been overdue for another major hurricane.
  • The fact that such a remarkable streak without a major hurricane strike may finally come to an end is not an indictment of climate change, but an illustration of how hurricanes are becoming rarer as the planet modestly warms.
  • Climate scammers will undoubtedly attempt to link Hurricane Milton to climate change. However, hurricane activity โ€“ affecting Florida and America as a whole โ€“ is less frequent and severe than was the case decades ago. Climate change may not make all hurricanes disappear, but hurricanes are becoming less frequent and severe as the planet modestly warms.
  • Meteorologists report that upper atmosphere wind shear will likely disrupt Hurricane Milton and reduce its power and speed before its Florida landfall. Scientists have long connected warmer global temperatures with stronger upper atmosphere wind shear inhibiting hurricane formation and strength. This is why warmer water temperatures have not โ€œsuperchargedโ€ hurricanes.
  • Florida recently underwent an 11-year period without a major hurricane strike (ending in 2017), which is by far the longest such period in recorded history.
  • Florida recently underwent a 10-year period without a single hurricane strike of any size (ending in 2016), which is by far the longest such period in recorded history.
  • From 2009 through 2017, the U.S. experienced fewer hurricane strikes than during any other time period in recorded history.
  • The United States recently underwent a record 11 years without a major hurricane strike of Category 3 or higher (2005-2017).

James Taylor
President
The Heartland Institute


โ€œWe, of course, donโ€™t know at this stage how powerful Milton will be when it makes landfall or where precisely it will strike, but if it hits Tampa Bay as is forecast, it will cause massive destruction. If it does, however, neither the hurricane itself in terms of strength or speed of formation, the timing in the hurricane season, nor the location will be unprecedented as so many stories have claimed. Neither data, nor the IPCCโ€™s most recent assessment, provide any support for the claim that climate change is causing a worsening of hurricanes.

โ€œRather, the damage Milton wreaks in Tampa Bay, or wherever it ultimately makes landfall, will be the only unprecedented thing about it and that is not due to changed climate conditions but rather changed demographics. There is simply more people, property, and infrastructure in and around Tampa Bay than there was when similar hurricanes made a direct strike on the city in 1921 and 1848 โ€“ 103 and 176 years of global warming ago respectively.

โ€œIn 1921, Tampa Bayโ€™s population was 135,000. Now it sits at more than three million. Hopefully, most people will heed the early warnings afforded by available technology and get out of harmโ€™s way so fatalities, if any, will be low. But you canโ€™t move homes and infrastructure, so the damage will be quite high โ€“ not due to the changing nature of hurricane, but to the expanding bulls-eye effect: more people and stuff in harmโ€™s way means more damage.

โ€œI pray wind shear knocks it down and/or it strikes a less inhabited area of the nation.โ€

H. Sterling Burnett, Ph.D.
Director, Arthur B. Robinson Center on Climate & Environmental Policy
The Heartland Institute
Managing Editor, Environment & Climate News


โ€œWhile many in the media have been painting Hurricane Milton as โ€˜unprecedentedโ€™ with it being โ€˜juicedโ€™ by climate change, a review of the factual record and scientific literature say otherwise. Tampa Bay has experienced major hurricanes in 1848 and in 1921, well before climate change was ever conceived.

โ€œFurther, the Intergovernmental Panel on Climate Change (IPCC) in their most recent report showed clearly, they found no signature of climate change affecting hurricanes in any way. Miltonโ€™s 897mb lowest pressure isnโ€™t even unprecedented, being the fifth lowest on record. While Milton remains dangerous, the attempt to paint it as a monster driven by climate change just doesnโ€™t hold up under scrutiny and is unhelpful to those affected.โ€

Anthony Watts

Senior Fellow

The Heartland Institute


โ€œUndoubtedly the focus of the media after Hurricane Milton will be on the climate change angle, despite the facts, and rapid-attribution con โ€˜studiesโ€™ will quickly come out to support the media narrative. It is a shame that instead of focusing on things that would actually help decrease the impact of natural hurricanes โ€“ such as storm resilient infrastructure and dispatchable power โ€“ the media will almost certainly promote fake news in order to generate even more fear and confusion.

โ€œIn the past, Floridaโ€™s government (especially recently) has been pretty good about responding to these disasters quickly and staying focused on helping people rather than wasting time playing the climate change card and shifting responsibility onto the people for daring to demand stable and affordable power. Let us hope this trend continues.โ€

Linnea Lueken Research Fellow
Arthur B. Robinson Center on Climate and Environmental Policy
The Heartland Institute


โ€œThe Tampa Bay area has been hit by mega-hurricanes at least twice before (1848 and 1921), there is no trend in hurricanes hitting Florida, no aspect of hurricanes is outside the range of natural variability, and itโ€™s impossible for emissions to affect hurricanes in the first place since emissions physically canโ€™t warm the oceans. Blaming hurricanes on emissions is an absolutely bankrupt claim.โ€

Steven Milloy Senior Policy Fellow, E&E Legal
Policy Advisor, The Heartland Institute


The Heartland Institute is a national nonprofit organization founded in 1984 and headquartered in Arlington Heights, Illinois. Its mission is to discover, develop, and promote free-market solutions to social and economic problems. For more information, visit our website

Hellfire, brimstone and societal collapse coming at 6pm, say the โ€œexpertsโ€

With four weeks to go โ€™til D-Day for the parasitic blob (the US Election), the headlines today are biblical hellfire with photos. Earthโ€™s vital signs have hit record extremes they tell us. In all the years weโ€™ve been recording things, which is practically nothing, storms, floods, droughts and the mental health of jellyfish have never been worse, which is obviously why food crops are higher than ever before, the Earth is greening and more humans are alive than have ever existed.

From JoNova

By Jo Nova

With four weeks to go โ€™til D-Day for the parasitic blob (the US Election), the headlines today are biblical hellfire with photos. Earthโ€™s vital signs have hit record extremes they tell us. In all the years weโ€™ve been recording things, which is practically nothing, storms, floods, droughts and the mental health of jellyfish have never been worse, which is obviously why food crops are higher than ever before, the Earth is greening and more humans are alive than have ever existed.

Like soothsayers with chicken entrails, captive scientists are squawking disaster like their funding depends on it:

Earthโ€™s โ€˜vital signsโ€™ show humanityโ€™s future in balance, say climate experts

by Damien Carrington, The Guardian

โ€œWeโ€™re already in the midst of abrupt climate upheaval, which jeopardises life on Earth like nothing humans have ever seen,โ€ said Prof William Ripple, of Oregon State University (OSU), who co-led the group. โ€œEcological overshoot โ€“ taking more than the Earth can safely give โ€“ has pushed the planet into climatic conditions more threatening than anything witnessed even by our prehistoric relatives.

Itโ€™s โ€œlike nothing humans have ever seenโ€ says Prof Ripple, who has forgotten the Eemian, the ice ages, the Toba supervolcano, countless asteroids, and the Black Plague.

Weโ€™re panicking about a couple of degrees of warming, but cavemen had it hotter and colder, and for 150,000 years their air conditioners didnโ€™t work.

Vostok Ice Cores

Itโ€™s like the modern โ€œscientistsโ€ are trying to erase all of prehistory

What weโ€™re dealing with is nothing like what humans have already suffered through.  Humans saw the seas rise by 125 meters (twice) โ€” children used to play on the continental shelf until all their beaches disappeared, their homes washed away, and their favourite reefs were destroyed. Humans saw ice caps a mile thick roll over Manhattan and humans saw the wall of ice melt away too.

Things were so bad, at some point humans waved good-bye to an entire species of hominid which had brains bigger than our own, and the vast forests of the Sahara desert turned to dust, the fish died, the rivers stopped flowing and the communities that existed for thousands of years were wiped out.

Nothing weโ€™re dealing with today is remotely as bad as what humans have already dealt with.

Every kind of disaster will hit โ€œBillions of peopleโ€:

The hyperbole knows no bounds. The โ€œmillions of climate refugeesโ€ that didnโ€™t happen, are now โ€œbillionsโ€.

No disaster is off limits to the Scare-fairies:

โ€œClimate change has already displaced millions of people, with the potential to displace hundreds of millions or even billions. That would likely lead to greater geopolitical instability, possibly even partial societal collapse.โ€

Every bad thing under the sun is caused by climate change. Thatโ€™s how we know it isnโ€™t science.

The climate is doing just fine, but the The State of Climate Science is a tragedy.

REFERENCE (if you can call it that)

William Ripple, et al including Michael Mann and Naoimi Oreskes (2024) The 2024 state of the climate report: Perilous times on planet Earth, BioScience, biae087, https://doi.org/10.1093/biosci/biae087

Meet the 108-Year-Old 1916 Major Hurricane that Brought 8 Feet of Flood Water to Asheville, NC & Covered All of Biltmoreย 

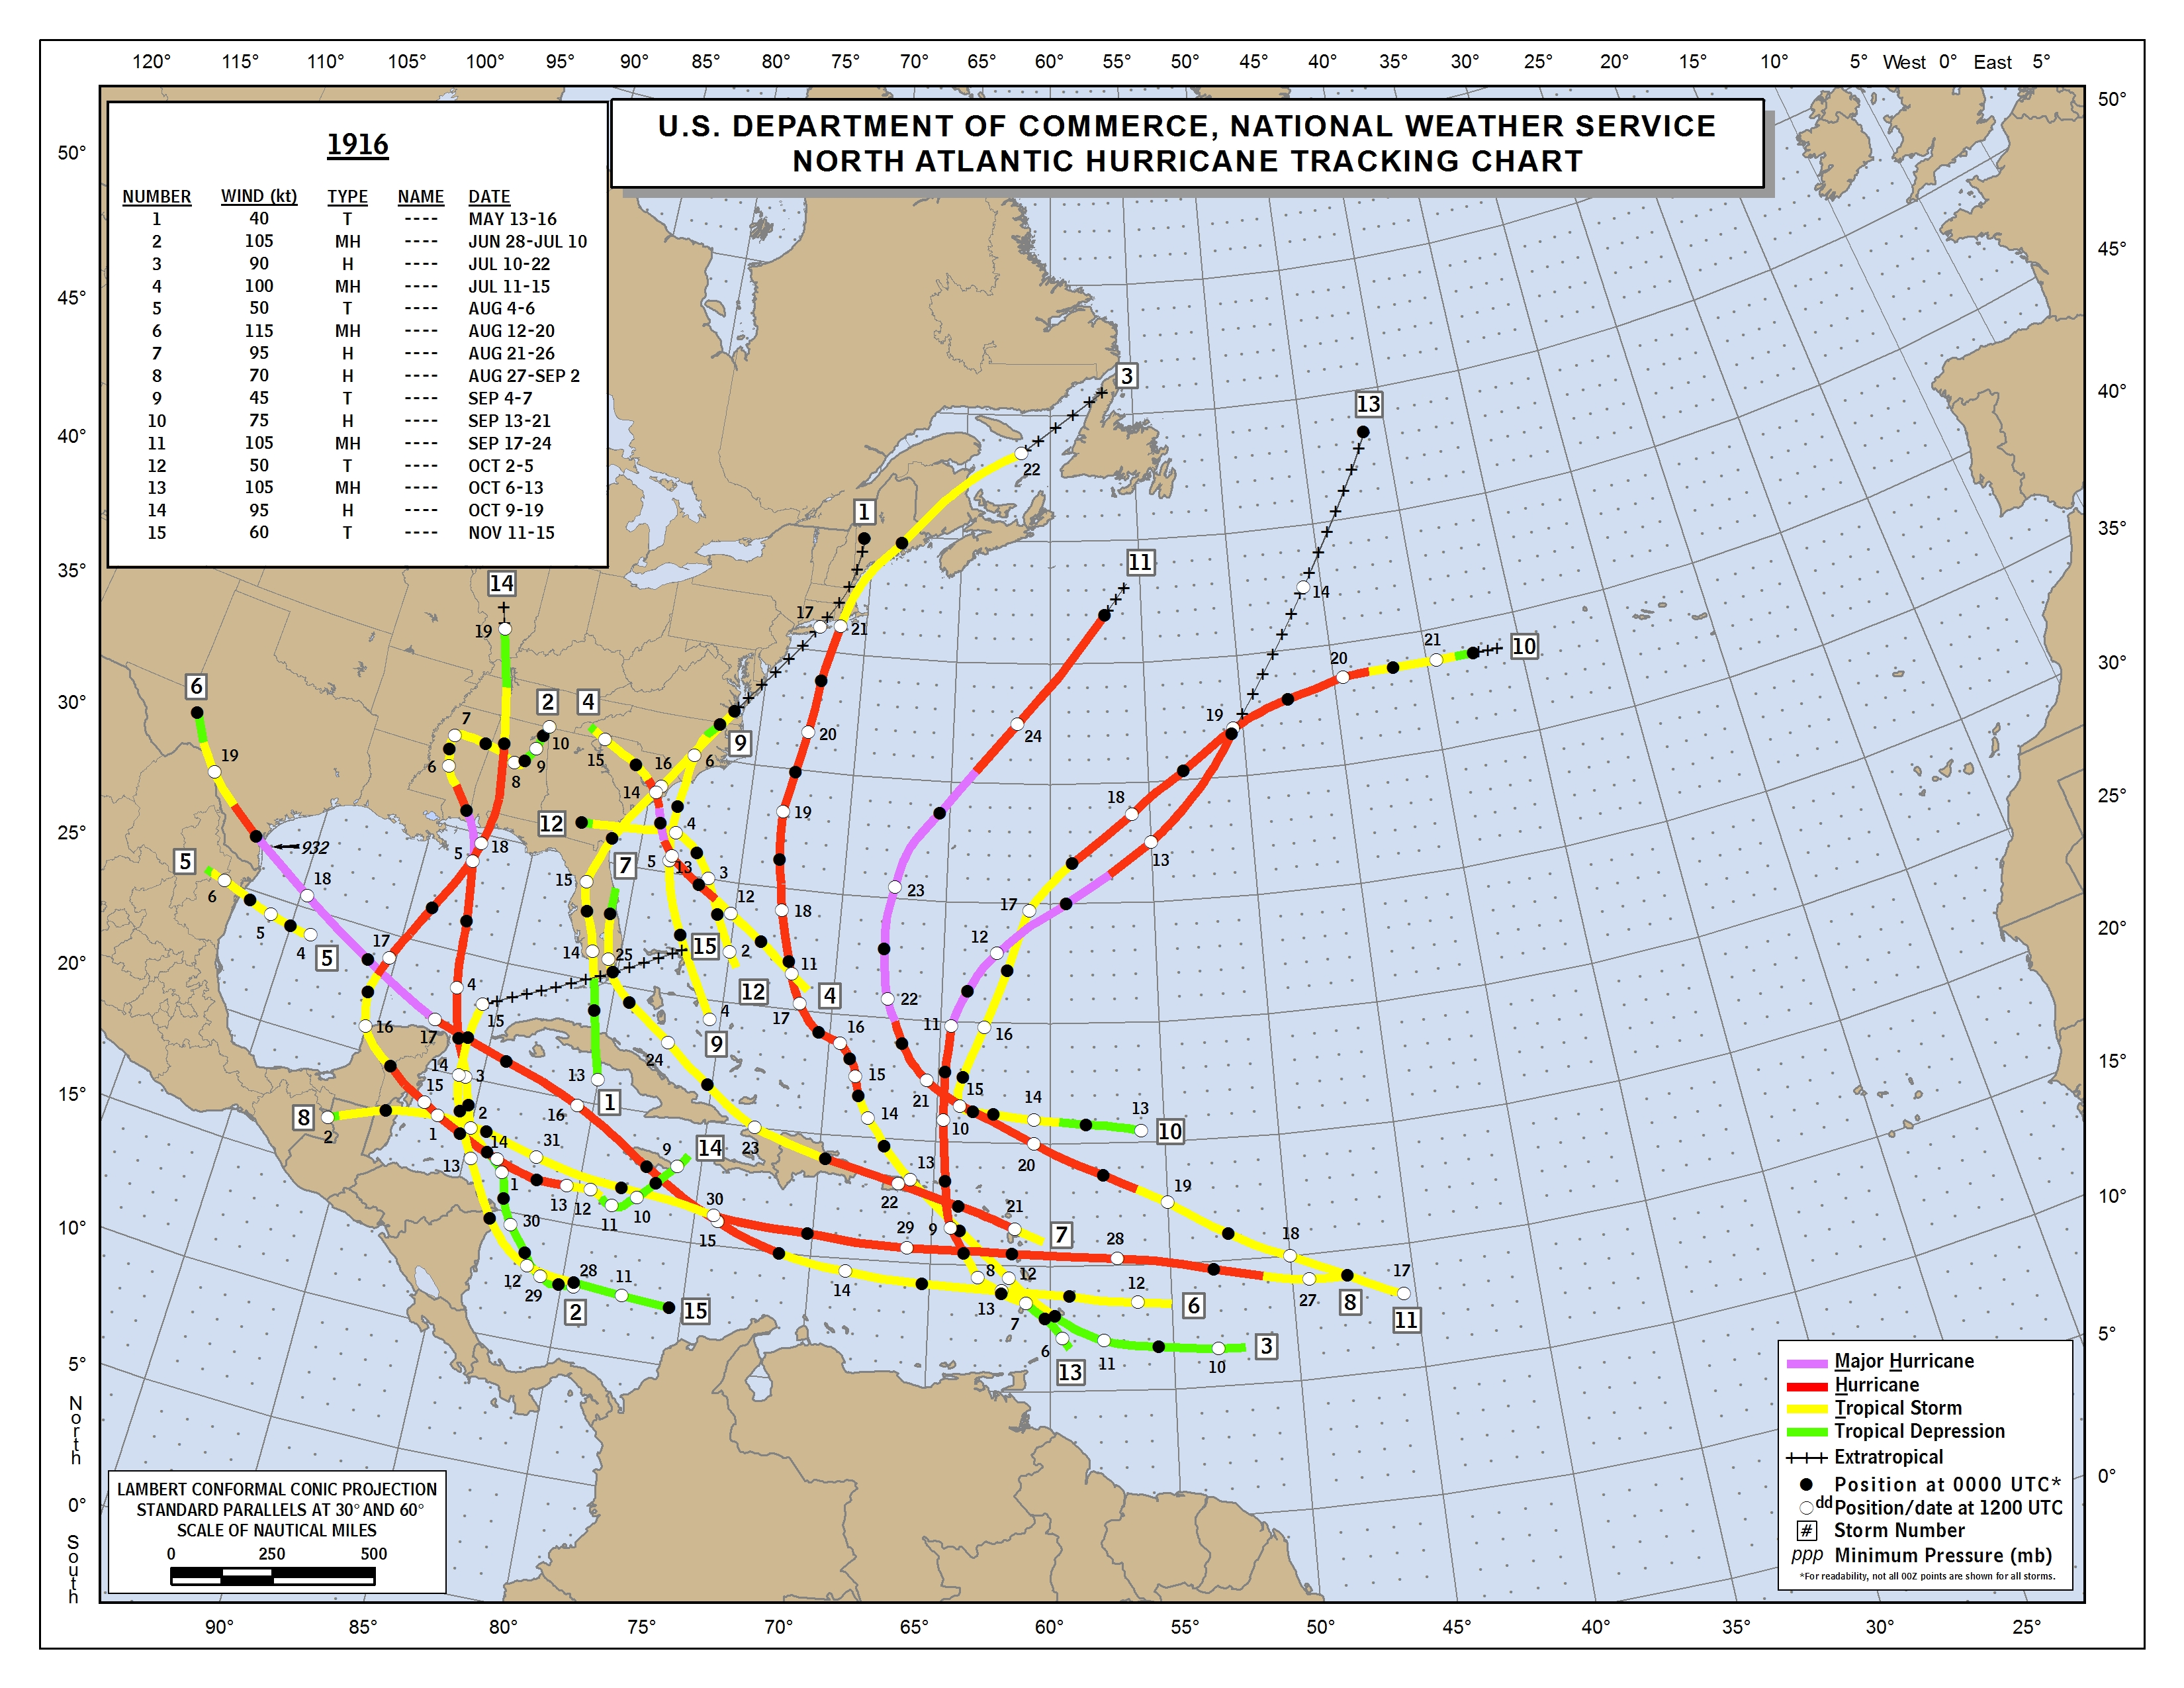
With all the climate alarmist hype about Hurricane Helene (and yet more coming with Milton) it seems appropriate to introduced everyone to the Year 1916 Major Hurricane Number 4 that preceded the year 2024 Hurricane Helene visit to Asheville with the headlines shown below and discussed in the WUWT articleย here.

From Watts Up With That?

Guest essay by Larry Hamlin

With all the climate alarmist hype about Hurricane Helene (and yet more coming with Milton) it seems appropriate to introduced everyone to the Year 1916 Major Hurricane Number 4 that preceded the year 2024 Hurricane Helene visit to Asheville with the headlines shown below and discussed in the WUWT article here.

NOAAโ€™s 1916 Atlantic Hurricane season outcome data is presented below and foundย here.

The 1916 Major Hurricane Asheville culprit is Number 4 on the list at a time when names were not given to hurricanes and there were no satellites, hurricane hunter aircraft or long-range weather radar systems available to identify and track storms.  

There were 15 numbered Atlantic storms in 1916 even though there easily could have been many more that were never observed during this season because of observation inadequacies compared to todayโ€™s available technology.

The Map below is expanded to better show the origin and path of Major Hurricane Number 4 which starts in about the middle of the Map with a square with the number 4 identifying this event.

Major Hurricane Number 4 moves onto the coastline of South Carolina and then finishes by moving into North Carolina and Tennessee as it moved rapidly over the period July 11 to July 15 and ended as a tropical storm and depression in the Asheville area.

Colorado State Universityโ€™s comprehensive Northern Hemisphere Tropical Cyclone Activity data identify the following pertinent information regarding the 1916 Atlantic hurricane year metrics using their extensive basin archives data base information.

The 1916 Atlantic season had 10 hurricanes as shown below compared to 9 hurricanes so far in this yearโ€™s 2024 season.  

The 1916 Atlantic season had 5 major hurricanes as shown below compared to 4 major hurricanes (including Milton) so far in this yearโ€™s 2024 season.

The 1916 Atlantic season had a total ACE component of 144 as shown below compared to the 2024 season total 115.6 as of October 7, 2024.

The Atlantic Season 30-year ACE average (1991 โ€“ 2020) is at a value of 122.5 so the year 1916 was an above average ACE hurricane year.

In 1916 3 major hurricanes crossed into the contiguous U.S. land region with 2 additional other hurricanes making land strikes as well thus totaling 5 inland hurricane strikes in all.

In 1916 the deepest land strike into the U.S. was Hurricane Number 14 which came up from the Gulf of Mexico and reached into and across the states of Florida, Alabama, Tennessee, Kentucky and ended in Illinois as shown on the map.

Apparently the โ€œhurricanesโ€ of 1916 did not know that future โ€œclimate changeโ€ was needed to allow hurricanes to reach that high into the U.S.   

If politically driven climate alarmist propagandists had been around 108 years ago it seems certain that the year 1916 outcomes would also have been characterized as being a clear โ€œsignโ€ that hurricanes are getting worse because of โ€œclimate changeโ€.         

Heat transfer and meltwater flows in ice sheets

This post challenges the conventional framework for simulating meltwater flows on glaciers and ice sheets.

TOPSHOT – Meltwater flows from the Greenland ice sheet into the Baffin Bay near Pituffik, Greenland on July 17, 2022 as captured from the ground during a NASA mission along with University of texas scientists to measure melting Arctic sea ice. – New observations from ICESAT-2 show remarkable Arctic Sea ice thinning in just three years. Over the past two decades, the Arctic has lost about one-third of its winter sea ice volume, largely due to a decline in sea ice that persists over several years, called multiyear ice, according to a new study. The study also found sea ice is likely thinner than previous estimates. (Photo by Kerem Yรผcel / AFP) / The erroneous mention appearing in the metadata of this photo by Kerem Yรผcel has been modified in AFP systems in the following manner: [as captured from the ground] instead of [during an airborne mission]. Please immediately remove the erroneous mention from all your online services and delete it from your servers. If you have been authorized by AFP to distribute it to third parties, please ensure that the same actions are carried out by them. Failure to promptly comply with these instructions will entail liability on your part for any continued or post notification usage. Therefore we thank you very much for all your attention and prompt action. We are sorry for the inconvenience this notification may cause and remain at your disposal for any further information you may require. (Photo by KEREM YUCEL/AFP via Getty Images)

From Climate Etc.

by Dan Hughes

This post challenges the conventional framework for simulating meltwater flows on glaciers and ice sheets.

Increased melting rates due to potential increases in temperature would add liquid water directly into the oceans. An additional aspect is that the meltwater, on reaching the base of glaciers, might lead to increased sliding of the glaciers and the consequent calving at the terminus.

The World Resources Institute (WRI) has summarized the IPCC AR6 results regarding melting of Greenland and Antarctica ice:

Should warming reach between 2 degrees C (3.6 degrees F) and 3 degrees C (5.4 degrees F), for example, the West Antarctic and Greenland ice sheets could melt almost completely and irreversibly over many thousands of years, causing sea levels to rise by several meters.

Temperature Increase1.5 C (2.7 F)2.0 C (3.6 F)3.0 C (5.4 F)
Global mean sea level rise by 21000.28 โ€“ 0.55 m(0.92 โ€“ 1.80 ft)0.33 โ€“ 0.61 m(1.08 โ€“ 2.00 ft)0.44 โ€“ 0.76 m(1.44 โ€“ 2.40 ft)

Meltwater flows on the surface of and with glaciers and other ice sheets are important relative to the addition of liquid water into Earthโ€™s oceans, and to bulk motions of the glaciers and ice sheets. Glacial meltwater might flow along the surface like a stream or river, accumulate in surface lakes, flow downward into open crevasses or moulins, accumulate as lakes interior to the ice mass, flow as a sheet of liquid between the ice bottom and bedrock, or flow enclosed in channels partially or completely embedded within the ice mass.

Flows that reach the boundary of the ice sheet deplete the ice mass balance and can contribute to sea level rise if the flow reaches the sea.  Meltwater remaining on the surface of the glacier or ice sheet can refreeze and have no impact on the glacier mass balance.  Flows reaching the base of the glaciers by way of crevasse and moulins are considered to provide potential lubrication and flotation that enhances bulk ice motions.

How solid is the foundation for simulating glacial meltwater flows that are included in projections of ice sheet melting?

Glacial meltwater flows have been modeled for more than four decades using thermal-hydraulic modeling.  The widely used Springer-Hutton formulation is based on principles of continuum mechanics, and detailed mathematical reduction to the standard 1-dimensional channel- average form for engineering applications. A steady-state energy balance equation is applied to flow of liquid water in ice channels embedded in large ice masses. The Spring-Hutter system considers the case of evolution in time and space of the flow area of the channel. Changes in flow area are caused by ice melting and dynamics of the ice in which channels are located. There have been numerous studies providing clarifications, modifications and applications of Spring-Sutter framework.

New paper

I have conducted a detailed analysis of the Spring-Sutter equations and their solutions in this paper [EDHmelt]

The paper clarifies and improves calculations of the role of viscous dissipation of kinetic energy into thermal energy as this physical process appears in models of meltwater flows embedded in and at the boundaries of glaciers and ice sheets.

Meltwater flows on the surface of and within glaciers and other ice sheets are important relative to the addition of liquid water into Earthโ€™s oceans, and to bulk motions of the glaciers and ice sheets. Glacial meltwater might flow along the surface like a stream or river, accumulate in surface lakes, flow downward into open crevasses or moulins, accumulate as lakes interior to the ice mass, flow as a sheet of liquid between the ice bottom and bedrock, or flow enclosed in channels partially or completely embedded within the ice mass.

Flows that reach the boundary of the ice sheet deplete the ice mass balance and can contribute to sea level rise if the flow reaches the sea.  Meltwater remaining on the surface of the glacier or ice sheet can refreeze and have no impact on the glacier mass balance.  Flows reaching the base of the glaciers by way of crevasse and moulins are considered to provide potential lubrication and flotation that enhances bulk ice motions.

A dimensionless form for steady-state energy balance for the liquid, accounting for effects of meltwater on the bulk liquid, is developed and solved. Analytical solutions of the temperature distribution along the channel are developed. The solutions explicitly illustrate effects of viscous dissipation of kinetic energy into heat, and the consequence effects on melting ice at the liquid-ice interface.

The paper shows that:

  • Letting viscous dissipation of kinetic energy go directly into melting is not correct
  • The energy equations are not complete because they do not account for meltwater entering the bulk liquid
  • The Spring-Hutter accounting for meltwater entering the bulk liquid is not correct.

Rising battery fires cloud electric vehiclesโ€™ future

Contributing to the slowing sales of electric vehicles in the United States and Europe are growing concerns about the safety of their lithium-ion batteries, which can spark spectacular fires, quickly engulfing the vehicle in flames and smoke and spewing toxic fumes.

From CFACT

By Bonner Cohen, Ph. D.

Chinaโ€™s grip on EV supply chain makes U.S. dangerously dependent

Contributing to the slowing sales of electric vehicles in the United States and Europe are growing concerns about the safety of their lithium-ion batteries, which can spark spectacular fires, quickly engulfing the vehicle in flames and smoke and spewing toxic fumes.

The internet is awash in videos of EVs going up in flames in tightly packed underground parking garages.

Other incidents include a factory fire in South Korea that killed 22 workers and blazes at battery-recycling centers in Scotland that required extensive firefighting efforts, Steve Goreham noted in The Wall Street Journal. And in New York, e-scooter fires resulted in 270 blazes last year, which claimed 18 lives.

Across the pond, a recent freedom of information request from the insurer QBE found that EV battery fires in the U.K. jumped 46% last year, DailySkeptic.com reported.

โ€œCar and bus fires were up 33% and 22% respectively and it is noted that there are now three battery fires per day compared with two in 2022,โ€ DailySkeptic.com said.

โ€œBattery-powered vehicles account for a small share of car fires, but controlling EV fires can be difficult,โ€ a 2023 Clemson University analysis notes. โ€œTypically, an EV fire burns at 5,000 degrees Fahrenheit (2,760 Celsius), while a gasoline-powered vehicle on fire burns at 1,500 F (815 C). It takes about 2,000 gallons of water to extinguish a burning gasoline-powered vehicle, putting out an EV fire can take 10 times more.โ€

EV batteries can ignite for several reasons, including a crash with another vehicle, overheating or external or internal short-circuiting. In all three cases, the resulting fire can result in the total loss of the vehicle. The Clemson analysis acknowledged that EV battery fires are โ€œa growing public safety concern.โ€

Itโ€™s no wonder that insurance premiums for EVs are higher than those for conventional vehicles. According to the National Association of Insurance Commissioners, insuring an EV can cost as much as 20% more than insuring a gas-powered car, CNBC reported.

Teslas are among the costliest EVs to insure. A MoneyGeek analysis found that four of the five EVs with the highest insurance premiums were Teslas.

As more EVs go on the road (albeit slower than the industryโ€™s backers had hoped), the number of battery fires will likely grow. According to the auto industry tracker Edmunds, EVs accounted for 6.8% of new-vehicle sales in the U.S. as of this past May.

In other words, despite generous tax credits for qualified buyers, over 93% of new-car purchasers chose gasoline-powered vehicles. This skittishness on the part of the public can probably be traced to EVsโ€™ higher prices and repair costs, limited range, lack of adequate recharging infrastructure and worries about the safety of EV batteries.

Though sales of EVs continue to creep up, the auto industryโ€™s earlier exuberance is yielding to reality.

โ€œTesla sales are down. Ford is scaling back its EV rollout. General Motors is delaying an electric truck and holding back on its investments in EV battery mining,โ€ The Verge reported in early September.

The situation for European EV makers is even more ominous. Almost one-fifth (19.5%) of EVs sold in Europe last year came from China, a figure that is expected to rise to 25% by the end of 2024, according to an analysis by Transport & Environment.

While most of those cars were manufactured by Tesla, Dacia and BMW in China, Chinese brands are forecast to garner 11% of the European market this year, rising to 20% in 2027, the analysis said. In a bid to throw a lifeline to struggling European automakers, the European Union is slapping import tariffs on Chinese brands. The Biden administration announced tariffs on Chinese EVs and other projects in August.

Brussels and Washingtonโ€™s efforts to shield their respective EV manufacturers from Chinese competition cannot overcome one harsh reality: Chinaโ€™s iron grip on the EV global supply chain. According to a Sept. 17 House Energy and Commerce Committee report, China accounts for approximately two-thirds of global EV battery-cell production, while the U.S. manufactured just 7% as of 2022.

In other words, most of the raw materials in the batteries powering โ€œAmerican-madeโ€ EVs are controlled by the government in Beijing. The forced transition to electric vehicles leaves the American transportation sector dangerously reliant on China.

EV battery fires pose a public safety hazard. Even worse, however, are the national security implications of playing directly into the hands of our greatest geopolitical rival.

This article originally appeared in the Washington Times

Windmills and sunshine will never deliver net zero. But you know what might?

Donโ€™t watch it if you donโ€™t want to get angry โ€“ to my mind, itโ€™s one of the most depressing clips on the internet. For the purposes of research, Iโ€™ve just subjected myself to it again and fear I may need to book an appointment with my dentist because it made me grind my teeth so hard.

Nuclear power plant with yellow field and big blue clouds

Britain is becoming a case study in the consequences of shamefully wasting nuclear know-how

Donโ€™t watch it if you donโ€™t want to get angry โ€“ to my mind, itโ€™s one of the most depressing clips on the internet. For the purposes of research, Iโ€™ve just subjected myself to it again and fear I may need to book an appointment with my dentist because it made me grind my teeth so hard. The Telegraph has the story.

In a short interview filmed in 2010, Nick Clegg, at his most smug and I-know-best, casually dismisses the possibility of increasing the supply of nuclear energy in the UK on the grounds that the benefits would not be realised until 2022.

Grrr โ€ฆ oh, there go my crowns!

It is, of course, 20/20 hindsight to point out that action then would have resulted in the nuclear reactors coming online just as Russia invaded Ukraine.

Nevertheless, itโ€™s long been apparent that many politicians, the chattering classes and environmentalists (letโ€™s call them โ€œClegg-nutsโ€) have a massive blindspot about nuclear power.

With the UKโ€™s last remaining coal-fired power station and steel-making blast furnace shutting in the same week, thereโ€™s been lots of discussion of how our energy policy has resulted in higher electricity prices than any other country in Europe, which has in turn hollowed out a once-proud industrial heritage.

But actually the problemโ€™s much worse than that: weโ€™ve hamstrung our ability to compete in the industries of the future too.

It was once hoped that rich countries could reduce their carbon emissions not only by switching to renewable sources but also by reducing energy consumption. You only need to look at whatโ€™s happening in the US to realise this is becoming an increasingly forlorn hope.

The proliferation of artificial intelligence (AI), to name just one area, looks set to cause a huge spike in electricity use. Data centres already account for 3.5pc of all the electricity consumed in the US today and this figure is forecast to rise to 9pc in just five years, according to Barclays.

Whatโ€™s more, unlike manufacturing or other industries that operate during daytime business hours, data centres run around the clock, which means they must be able to access steady baseload power 24/7. Couple this with the ambitious net zero pledges of most tech companies and thereโ€™s really only one answer.

Microsoft and Amazon have recently signed deals with nuclear power plants and Google is looking to do the same. Constellation Energy is planning to reactivate a nuclear reactor at its Three Mile Island site in Pennsylvania, after striking a deal to provide power for Microsoftโ€™s AI operations. The site became infamous because of an accident in 1979.

The US Department of Energy recently put out a report showing that including nuclear in the energy mix reduces costs by about a third compared to a combination of renewables and storage. And this is in the US where solar tends to be cheaper because thereโ€™s so much unused land and, you know, the sun actually shines.

So, what should we say to the Clegg-nuts who believe that nuclear power is too time-consuming, too costly and too risky? The obvious rebuttal is: compared to what? The UK is fast-becoming a case study in the consequences of shamefully wasting your nuclear know-how.

But rather than bang my head against that particular wall again, letโ€™s take a (very) different tack.

Imagine aliens arriving on earth. Contrary to the Hollywood propaganda, theyโ€™re not here to wipe out, enslave or harvest us. In fact, theyโ€™re just passing through and want to offer us the energy technology being used by every other sentient species in the known universe.

This will result in fewer deaths per terawatt-hour of electricity produced โ€“ 100 times fewer than gas and 1,000 times fewer than coal. It will produce less carbon dioxide (which theyโ€™ve noticed has been building up on our admittedly very pretty planet) over the whole life-cycle of the energy source, even compared to solar and wind.

The required fuel is relatively abundant and spread around the world (not just the dodgy parts). It also contains 100,000 times more energy per kg than oil and occupies 2m times less space. This means it would be easy to maintain strategic reserves โ€“ granting energy self-sufficiency to any country that wants it and reducing the chances of geopolitical tension over access to hydrocarbons.

What would mankind say to this intergalactic gift?

Read the full story here.

Right, CNN, There Is No Such Thing As A Climate Haven, There Never Has Been

A recent CNN article, โ€œPeople moved to Asheville to escape extreme weather. They forgot its tragic history,โ€ claims that Asheville North Carolina, which recently suffered catastrophic flooding in the aftermath of Hurricane Helene, was once considered a โ€œclimate havenโ€ but now is suffering from extreme weather because of climate change. This is false. Itโ€™s a confused article, flashing back and forth between an accurate depiction of historical floods and false climate claims.

Flooding in 1916, Asheville North Carolina

From ClimateRealism

By Linnea Lueken

Flooding in 1916, Asheville North Carolina. Archival Photography by Steve Nicklas, NOS, NGS, Public domain, via Wikimedia Commons

A recent CNN article, โ€œPeople moved to Asheville to escape extreme weather. They forgot its tragic history,โ€ claims that Asheville North Carolina, which recently suffered catastrophic flooding in the aftermath of Hurricane Helene, was once considered a โ€œclimate havenโ€ but now is suffering from extreme weather because of climate change. This is false. Itโ€™s a confused article, flashing back and forth between an accurate depiction of historical floods and false climate claims. In the end, CNNโ€™s article shows that the damage caused by Helene is nothing new for Asheville. Location and weather, not climate change, are responsible for the recent tragedy.

CNN begins by explaining that โ€œsomeโ€ media outlets (only one local station was referenced) claimed that Asheville was a โ€œclimate havenโ€ because it is far from the coast and isnโ€™t often struck by wildfires and other โ€œclimate extremes.โ€

โ€œSo-called climate migrants have long been arriving here from places like California, Arizona, and the coastal Carolinas, said Jesse Keenan, associate professor of sustainable real estate and urban planning at Tulane University,โ€ CNN writes, and follows it up with examples of people on internet forums claiming that Asheville lacks the threat of natural disasters that other cities across the country face.

These people were obviously misinformed, there is no place in the world that is โ€œsafeโ€ from occasional extreme weather and natural disasters โ€“ regardless of climate change.

To prove that Helene was caused by climate change, CNN references a โ€œrapid climate analysis published Tuesday by scientists from Lawrence Berkeley National Laboratory found fossil fuel pollution caused over 50 percent more rainfall in parts of Georgia and the Carolinas,โ€ and that global warming made rain 20 times more likely in the affected area. This is hogwash. Rapid attribution studies are not a genuine analysis of the weather, they analyzed nothing but counterfactuals within computer models. Presenting them as evidence is deceptive and the scientists responsible know it.

Frequent readers of Climate Realism know that the media heavily relies on attribution modelling rather than actual available historical data to push the climate narrative, simply because attribution models start with the assumption that human emissions have an impact on the weather. Real world data does not give this impression, in fact hurricane data does not show any increase in the intensity or frequency of tropical cyclones.

While Climate Realism has already covered alarmism surrounding Helene twice recently (here, and here) itโ€™s worth noting the flip-flopping within CNNโ€™s own article. After all the initial claims about climate-enhanced weather, the article suddenly shifts and admits that Asheville has, in fact, suffered similar disasters in the past, well before the modern warming period.

Asheville, CNN writes, โ€œis vulnerable to flooding, as a long history attests.โ€ CNN goes on to describe back-to-back hurricane strikes in 1916 that triggered โ€œbiblicalโ€ floods and was devastating to the city and people who lived there. CNN also lists a similar scenario as recently as 2004, where two storms โ€œconcentrated their highest rainfall on western North Carolina, killing 11 people.โ€

Had CNN checked it would have found, โ€œevery single county in North Carolina has had at least two major flood disasters since 1950 โ€“ either from rising rivers or hurricane surge,โ€ as the North Carolina Flood Insurance website reports.

These instances of past extreme weather events debunk the narrative that Helene was somehow unprecedented or showed signs of โ€œclimate fingerprintsโ€ as claimed by the so-called experts CNN cited.

Climate Realism wasnโ€™t alone in noticing that North Carolina has never been a climate haven. On the Yahoo News page where the CNN post was republished, multiple commenters made similar observations:

The locals are knowledgeable about the danger they face by living in the valley, evidently determining that it is worth the risk. Newcomers, many of which were apparently horribly misinformed, from California and other places did not do their research and so have been taken by a terrible surprise. Media outlets like CNN do not have any excuse for burying the truth under climate hysteria and alarmist narratives when they clearly are aware of the regionโ€™s weather history.

โ€œFree Market Electricityโ€

โ€œA free market in electricity would terminate the current provisions of landmark federal statutes, such as the Power Act of 1935, Public Utility Holding Company Act of 1935, Public Utility Regulatory Policies Act of 1978, Energy Policy Act of 1992, Energy Policy Act of 1995, and Inflation Reduction Act of 2022.โ€

xr:d:DAFWyUEuoD0:66,j:5066942255216636231,t:23060710

From Master Resource

By Robert Bradley Jr.

โ€œA free market in electricity would terminate the current provisions of landmark federal statutes, such as the Power Act of 1935, Public Utility Holding Company Act of 1935, Public Utility Regulatory Policies Act of 1978, Energy Policy Act of 1992, Energy Policy Act of 1995, and Inflation Reduction Act of 2022.โ€

My new AIER primer defines and applies the free-market classical liberal worldview to electricity. This is particularly important because this sound perspective has been both forgotten and misapplied.

Forgotten regarding the criticisms of traditional public utility regulation that emerged in the 1960s; misapplied regarding the current mandatory open access era involving central planning at the wholesale level with ISOs/RTOs.

My major points with quotations follow:

1. Electricity is a free-market product with a clear free market, classical liberal meaning: the separation of government and electricity in all phases and in the whole.

โ€œA free market in electricity is defined as the absence of government ownership, control, or regulation. Electricity and government are separate, apart from legal protection against force or fraud. Government neutrally upholds the enforceability of private contracts and other market norms under the rule of law.โ€

โ€œโ€ฆ contra government direction and control, from municipal ownership to franchise protection and cost-based rate ceilings (public-utility regulation); to mandatory open access for outside parties (an uncompensated taking); to renewable requirements (the forced energy substitution of wind and solar).โ€

โ€œGrid electricity was never considered a common-pool resource at odds with definable private property rights and efficient operation. The โ€˜commonsโ€™ theory of governmental organization arose only with the government-mandated open-access transmission, itself a clear violation of private property rights.โ€

2. Electricity, while having unique qualities, is subject to market forces and does not require government intervention or ownership. The US power sector has a clear free market history for empirical evaluationโ€”and no demonstrable market failure.

โ€œHighly coordinated multiphase operation, evident in petroleum and natural gas (in a free market), was required by the uniqueness of electricity. Governmental franchise protection was not necessary.โ€

โ€œThe market era was characterized by declining rates, expanding usage, and reliable serviceโ€ฆ. Market-directed integrated operations resulted in unprecedented affordability and continuous, coordinated service.โ€

3. Electricity is the second-most regulated sector of the U.S. economy today, next to money and banking (outside of the military industrial complex). It is an unholy mix of public utility regulation; government-enabled dilute, intermittent wind and solar; and mandatory open access.

โ€œToday, a growing number of regions are subject to rising power rates, conservation appeals, and service interruptions.โ€

4. Mandatory open access has introduced its own problems under de facto socialism, particularly pricing for reliability.

โ€œEconomic calculation has bedeviled ISO/RTOsโ€ฆ. Some regions have implemented โ€˜capacity chargesโ€™ to reward generators for standby capacity. Others have banked on โ€˜energy onlyโ€™ prices, betting that ample capacity would be incited by periodic price windfalls.โ€

โ€œConsumer welfare and โ€˜the obligation to serveโ€™ have been lost in the transition to central planning, as well as in the governmental quest for decarbonization. Worse, agency errors โ€ฆ have been protected by sovereign immunity.โ€

5. Public policy going forward begins with federal deregulation of electricity (state deregulation would need to follow).

โ€œA free market in electricity would terminate the current provisions of landmark federal statutes, such as the Power Act of 1935, Public Utility Holding Company Act of 1935, Public Utility Regulatory Policies Act of 1978, Energy Policy Act of 1992, Energy Policy Act of 1995, and Inflation Reduction Act of 2022.โ€

โ€œCompetition could entail direct rivalry with duplicate facilities, or it could be a single firm maintaining a market against potential rivals. Either way, the private and public costs of government intervention could be bypassed and market signals established.โ€

UAH September 2024: NH Land Up, SH Landย Down

The post below updates the UAH record of air temperatures over land and ocean. Each month and year exposes again the growing disconnect between the real world and the Zero Carbon zealots.ย  It is as though the anti-hydrocarbon band wagon hopes to drown out the data contradicting their justification for the Great Energy Transition.ย  Yes, there has been warming from an El Nino buildup coincidental with North Atlantic warming, but no basis to blame it on CO2.ย ย 

From Science Matters

Byย Ron Clutz

The post below updates the UAH record of air temperatures over land and ocean. Each month and year exposes again the growing disconnect between the real world and the Zero Carbon zealots.  It is as though the anti-hydrocarbon band wagon hopes to drown out the data contradicting their justification for the Great Energy Transition.  Yes, there has been warming from an El Nino buildup coincidental with North Atlantic warming, but no basis to blame it on CO2.  

As an overview consider how recent rapid cooling  completely overcame the warming from the last 3 El Ninos (1998, 2010 and 2016).  The UAH record shows that the effects of the last one were gone as of April 2021, again in November 2021, and in February and June 2022  At year end 2022 and continuing into 2023 global temp anomaly matched or went lower than average since 1995, an ENSO neutral year. (UAH baseline is now 1991-2020). Now we have an usual El Nino warming spike of uncertain cause, unrelated to steadily rising CO2 and now moderating.

For reference I added an overlay of CO2 annual concentrations as measured at Mauna Loa.  While temperatures fluctuated up and down ending flat, CO2 went up steadily by ~60 ppm, a 15% increase.

Furthermore, going back to previous warmings prior to the satellite record shows that the entire rise of 0.8C since 1947 is due to oceanic, not human activity.

gmt-warming-events

The animation is an update of a previous analysis from Dr. Murry Salby.  These graphs use Hadcrut4 and include the 2016 El Nino warming event.  The exhibit shows since 1947 GMT warmed by 0.8 C, from 13.9 to 14.7, as estimated by Hadcrut4.  This resulted from three natural warming events involving ocean cycles. The most recent rise 2013-16 lifted temperatures by 0.2C.  Previously the 1997-98 El Nino produced a plateau increase of 0.4C.  Before that, a rise from 1977-81 added 0.2C to start the warming since 1947.

Importantly, the theory of human-caused global warming asserts that increasing CO2 in the atmosphere changes the baseline and causes systemic warming in our climate.  On the contrary, all of the warming since 1947 was episodic, coming from three brief events associated with oceanic cycles. And now in 2024 we have seen an amazing episode with a temperature spike driven by ocean air warming in all regions, along with rising NH land temperatures, now oscillating near its peak.

Chris Schoeneveld has produced a similar graph to the animation above, with a temperature series combining HadCRUT4 and UAH6. H/T WUWT

See Also Worst Threat: Greenhouse Gas or Quiet Sun?

September 2024 NH Land Spike Warms More than SH Land Drops

With apologies to Paul Revere, this post is on the lookout for cooler weather with an eye on both the Land and the Sea.  While you heard a lot about 2020-21 temperatures matching 2016 as the highest ever, that spin ignores how fast the cooling set in.  The UAH data analyzed below shows that warming from the last El Nino had fully dissipated with chilly temperatures in all regions. After a warming blip in 2022, land and ocean temps dropped again with 2023 starting below the mean since 1995.  Spring and Summer 2023 saw a series of warmings, continuing into October, followed by cooling. 

UAH has updated their tlt (temperatures in lower troposphere) dataset for September 2024. Posts on their reading of ocean air temps this month are ahead of the update from HadSST4.  I posted last month on SSTs using NH Pulls Oceans Warmer August 2024.  These posts have a separate graph of land air temps because the comparisons and contrasts are interesting as we contemplate possible cooling in coming months and years.

Sometimes air temps over land diverge from ocean air changes. In July 2024 all oceans were unchanged except for Tropical warming, while all land regions rose slightly. Then in August we saw a warming leap in SH land, slight Land cooling elsewhere, a dip in Tropical Ocean temp and slightly elsewhere. Now in September a dramatic drop in SH land, overcome by a greater NH land increase. End result is an upward bump in Global anomaly.

Note:  UAH has shifted their baseline from 1981-2010 to 1991-2020 beginning with January 2021.  In the charts below, the trends and fluctuations remain the same but the anomaly values changed with the baseline reference shift.

Presently sea surface temperatures (SST) are the best available indicator of heat content gained or lost from earthโ€™s climate system.  Enthalpy is the thermodynamic term for total heat content in a system, and humidity differences in air parcels affect enthalpy.  Measuring water temperature directly avoids distorted impressions from air measurements.  In addition, ocean covers 71% of the planet surface and thus dominates surface temperature estimates.  Eventually we will likely have reliable means of recording water temperatures at depth.

Recently, Dr. Ole Humlum reported from his research that air temperatures lag 2-3 months behind changes in SST.  Thus cooling oceans portend cooling land air temperatures to follow.  He also observed that changes in CO2 atmospheric concentrations lag behind SST by 11-12 months.  This latter point is addressed in a previous post Who to Blame for Rising CO2?

After a change in priorities, updates are now exclusive to HadSST4.  For comparison we can also look at lower troposphere temperatures (TLT) from UAHv6 which are now posted for September.  The temperature record is derived from microwave sounding units (MSU) on board satellites like the one pictured above. Recently there was a change in UAH processing of satellite drift corrections, including dropping one platform which can no longer be corrected. The graphs below are taken from the revised and current dataset.

The UAH dataset includes temperature results for air above the oceans, and thus should be most comparable to the SSTs. There is the additional feature that ocean air temps avoid Urban Heat Islands (UHI).  The graph below shows monthly anomalies for ocean air temps since January 2015.

Note 2020 was warmed mainly by a spike in February in all regions, and secondarily by an October spike in NH alone. In 2021, SH and the Tropics both pulled the Global anomaly down to a new low in April. Then SH and Tropics upward spikes, along with NH warming brought Global temps to a peak in October.  That warmth was gone as November 2021 ocean temps plummeted everywhere. After an upward bump 01/2022 temps reversed and plunged downward in June.  After an upward spike in July, ocean air everywhere cooled in August and also in September.   

After sharp cooling everywhere in January 2023, all regions were into negative territory. Then there is a remarkable spiking of Tropical ocean temps from -0.4 up to + 1.3 in January 2024.  The rise was matched by other regions in 2024 January through May, before dropping lower. Now in September comes an upward bump in NH and Tropics pulling up Global anomaly.

Land Air Temperatures Tracking in Seesaw Pattern

We sometimes overlook that in climate temperature records, while the oceans are measured directly with SSTs, land temps are measured only indirectly.  The land temperature records at surface stations sample air temps at 2 meters above ground.  UAH gives tlt anomalies for air over land separately from ocean air temps.  The graph updated for September is below.

Here we have fresh evidence of the greater volatility of the Land temperatures, along with extraordinary departures by SH land.  Land temps are dominated by NH with a 2021 spike in January,  then dropping before rising in the summer to peak in October 2021. As with the ocean air temps, all that was erased in November with a sharp cooling everywhere.  After a summer 2022 NH spike, land temps dropped everywhere, and in January, further cooling in SH and Tropics offset by an uptick in NH. 

Remarkably, in 2023, SH land air anomaly shot up 2.1C, from  -0.6C in January to +1.5 in September, then dropped sharply to 0.6 in January 2024, matching the SH peak in 2016. Then through May 2024 NH and Tropical land temps spiked to new highs, before dropping down.  Now in August SH land spiked up, then reversed down in September.  NH and Tropics bumped upward, and Global land anomaly rose slightly

The Bigger Picture UAH Global Since 1980

The chart shows monthly Global anomalies starting 01/1980 to present.  The average monthly anomaly is -0.04, for this period of more than four decades.  The graph shows the 1998 El Nino after which the mean resumed, and again after the smaller 2010 event. The 2016 El Nino matched 1998 peak and in addition NH after effects lasted longer, followed by the NH warming 2019-20.   An upward bump in 2021 was reversed with temps having returned close to the mean as of 2/2022.  March and April brought warmer Global temps, later reversed

With the sharp drops in Nov., Dec. and January 2023 temps, there was no increase over 1980. Then in 2023 the buildup to the October/November peak exceeded the sharp April peak of the El Nino 1998 event. It also surpassed the February peak in 2016. In 2024 March and April took the Global anomaly to a new peak of 1.05C.  The cool down started with May dropping to 0.90C, and in June a further decline to 0.80C.  The warming level rose again and has persisted through September.

The graph reminds of another chart showing the abrupt ejection of humid air from Hunga Tonga eruption.

TLTs include mixing above the oceans and probably some influence from nearby more volatile land temps.ย  Clearly NH and Global land temps have been dropping in a seesaw pattern, nearly 1C lower than the 2016 peak.ย  Since the ocean has 1000 times the heat capacity as the atmosphere, that cooling is a significant driving force.ย  TLT measures started the recent cooling later than SSTs from HadSST4, but are now showing the same pattern. Despite the three El Ninos, their warming had not persisted prior to 2023, and without them it would probably have cooled since 1995.ย  Of course, the future has not yet been written.

The Cost Of Milibandโ€™s Flywheels

Mad Miliband did no tell us how much his crazy plan to build giant flywheels up and down the country would cost

From Watts Up With That?

NOT A LOT OF PEOPLE KNOW THAT

By Paul Homewood

Mad Miliband did no tell us how much his crazy plan to build giant flywheels up and down the country would cost, but Paul Burgess came up with these numbers:

So that 250 kW job would cost a total of about $75000, assuming $300/kW.

If we convert that to ยฃ300/kW and assume that Milibandโ€™s flywheels would be needed to replace 30GW of gas and coal plants, we would be looking at a total of some ยฃ9 billion. The idea, after all, is that they are needed to provide system inertia, which is currently only provided by spinning generators โ€“ gas, coal and nuclear principally.

I seem to recall reading that battery storage would also be required, in order to smooth delivery of power; this could add to those theoretical costs.

It seems unlikely that flywheels would last more than a few years, certainly not without plenty of maintenance. Either way, the cost of flywheels would be considerable.

###


Here it the transcript of the above video, which is also archived on our ClimateTV page, , a collection of over six hundred videos, featuring new interviews and analysis, and covering dozens of media sources discussing, debating and analyzing the latest in climate science, climate politics, and energy policy, including topics concerning temperature, sea level, polar bears, ocean acidification, extreme weather, censorship, wild fires, and more..

Hello everyone. Well there I was peacefully making my hydrogen video, you know, explaining the myth and the delusions about hydrogen, when in came a comment on one of my videos saying what do I think of Milanโ€™s flywheel idea. And when that came in, I didnโ€™t know about it. I was busily working and whilst Iโ€™m aware of what flywheels are used for in the energy system, which is to really stabilize frequencies and take care of very very small time increments to smooth things out, I wasnโ€™t aware that our energy minister Ed Miliband had completely lost the plot with claims that flywheels are going to help balance our grid in terms of storage taking and you know, uh excess energy which we still pay the full price for of course and moving it into periods of high demand.

This is a nuts idea and Ed Miliband is easily the most dangerous um person in the UK at the moment because heโ€™s going to ruin our economies. I mean this last week weโ€™ve closed, we know weโ€™ve closed Tata Steel, weโ€™ve closed our last Coal Mine, uh weโ€™re doing away with Grangemouth um costing thousands of jobs. What weโ€™reโ€ฆ weโ€™ve stopped new um exploration of the North Sea and uh and so on and so on and so on and we areโ€ฆ this man is so dangerous heโ€™s fanatical but the worst thing is he really doesnโ€™t understand the most basic basic things about energy.

Now let me give you one of my problems when I go to research these things and like flywheels I look for how much storage, how much energy they can store. Youโ€™d think that would be a simple issue because thatโ€™s measured in megawatt hours, kilowatt hours, gigawatt hours, but itโ€™s measured in hours. But no, all you get is oh this flywheel can do 20 megawatts. Well thatโ€™s meaningless unless I know what time it can maintain that for because that gives me the amount. And Iโ€™ve actually been in situations of public meetings when Iโ€™ve gone up to so-called experts who didnโ€™t understand the difference between a kilowatt and a kilowatt hour and I find that amazing.

So the kilowatt hour is the amount of energy that means one kilowatt for 1 hour. A kilowatt is meaningless unless you know how long it can last. It it itโ€™s meaningless and yet all the time journalists and even you know promotions videos just use the megawatts or the kilowatts without giving me the storage.

So it always takes me extra time to try to find out how much storage is in these things.

Now from the outset here I knew that flywheels can store a very little amount of energy and so Iโ€™m going to explain in this video just how stupid this man is and the idea is to avoid blackouts in Britain. Well Iโ€™m sorry to say this isnโ€™t going to help at all with blackouts.

Well flywheels arenโ€™t new, theyโ€™ve been used for a long time. I mean the early steam engine used them to smooth out the power as it were and thatโ€™s their role, smoothing out energy over small increments of time. And even if you look at the Modern engine here youโ€™ll see we still use flywheels. Youโ€ฆ this is a this is a four-cylinder engine and the flywheel helps smooth out the power. It carries theโ€ฆ the has the inertia between The Strokes as it were. Thatโ€™s the role of flywheels.

We will now take a look at Ed Milibandโ€™s bonkers plan. So there is the claim is to prevent Net Zero blackouts because of the intermittent nature of solar and wind. But it doesnโ€™t do that. In fact it doesnโ€™t do that at all.

The national Energy System operator, thatโ€™s ESO, is the brand new organization taken over from the National Grid and is publicly owned and they state: โ€œIf thereโ€™s a sudden change in system frequencyโ€ โ€“ and note the word frequency there please โ€“ โ€œthe weight and inertia of generators means they carry on spinning even if theyโ€™ve lost power. This avoids a sudden change of frequency giving time for our control room to restore the balance.โ€ So what weโ€™re talking about there is frequency. Yeah, tiny amounts of time to adjust tiny things as it were. That is what they saying there. They carry on.

The scale of the problem is shown by the number of contracts awarded for so-called stability Services expected to Total more than 100 by the time all are operational probably in 2026. ESO is now planning to open an entire new stability service Market to encourage the construction of more flywheels or other services that back up the grid. So weโ€™re still talking about frequency.

But then they go on to say ESO said the schemes would save the consumer money by cutting the need for maintaining backup power stations and importing power from overseas via interconnectors. And that is what Iโ€™m going to challenge. A spokesman said the Pathfinders alone are expected to provide consumers with savings of ยฃ14.5 billion between 2025 and 2035. Wow. So it sort of saves us for importing power from overseas. Well thatโ€™s not frequency. Thatโ€™s acting as a backup. Thereโ€™s a huge difference between using flywheels as a frequency adjuster doing tiny little adjustments to stabilize the frequency on the network to using it as a backup to restore power because the question then becomes how much energy do flywheels store and how long can they last.

So letโ€™s look at an example now which used to be the worldโ€™s biggest until recently when China built a slightly bigger one and letโ€™s look at the one thatโ€™s in the USA and they call it a 20 megawatt one, a 20 megawatt flywheel system. Weโ€™ll take a look now as an example.

Letโ€™s take this Beacon 20 megawatt flywheel plant in the USA. This is what they said to justify it: โ€œBeacon power is building the world largest flywheel energy storage system in Stevenson New York. The 20 megawatt system marks a milestone in flywheel energy storage technology. Our similar systems have only been applied in testing and small scale applications. The system utilizes 200 carbon fiber flywheels levitated in a vacuum chamber. The flywheels absorb grid energy and can steadily discharge one megawatt of electricity for 15 minutes.โ€ Now remember that figure โ€“ one Mega for 15 minutes. โ€œThe system takes a place of supplemental natural gas power plants that have been used to balance supply and demand in Grid activity prior boosting energy production during Peak demand and lowering production during Peak Supply.โ€ That is utter nonsense that I will now prove.

So how much energy have we stored in that, the biggest at the time um flywheel um plant in the world?

Well it was a quarter of 1 megawatt which isโ€ฆ thatโ€™s all it is. One megawatt for 15 minutes is a quarter of a megawatt hour. We need 7,200 gigawatt hours for the one and day example Iโ€™ve often used when we went nine days without wind in the UK and that is 7,200,000 megawatt hours. But weโ€™ve only a quarter of one. And I can tell you now that would support the national grid for just 1/1200th of a second. Thatโ€™s it.

And even the bigger one thatโ€™s been built in China is 50% bigger so basically you still have well overโ€ฆ well below 100th of a second support for the Grid. In other words there is not enough storage no matter what system you use. So thatโ€™s what weโ€™re into.

So clearly clearly there is no element of uh grid storage to balance the grid for Renewables with flywheels.

None whatsoever. All there is is the frequency adjustment.

Itโ€™s worth following up what happened to that Beacon power plant and again in this statement here they go on about it being used for the regulation of power grid operations not just for the frequency adjustment. โ€œThe storage systems are designed to help utilities match Supply with varying Demand by storing Excess power in arrays of 2,800 flywheels at off peak times for use during Peak demand.โ€ No no no. But letโ€™s carry on with the history.

Beacon power was founded in Wilmber Massachusetts in 97 as a subsidiary of SatCon Technology Corporation, the maker of Alternative Energy Management Systems. The company went public in 2000 and in June 2008 Beacon power opened new headquarters in Tyngsboro um with financing from Massachusetts state agency. There we are, the big subsidy.

In 2009 Beacon received loan guarantee from the United States Department of energy. There we are again for $43 million to build a 20 megawatt flywheel power plant in Stevenson New York which is what weโ€™re talking about. The DOE loan for 43 million was awarded in 2010 with a plan to be online by 2011. It was also awarded 24 million from the DOE for a second flywheel plant. On the 30th of October 2011, the company filed for chapter 11 bankruptcy protection under the United States Bankruptcy Court in Delaware. As part of the bankrupt Court proceedings Beacon power agreed in November 18 to sell it Stevenson facility to repay the DOE loan.

So that one and it was the worldโ€™s largest at the time went bust the same year that it opened and it already had a total of 43 million plus a further um sum of 24 million so totaling 67 million pumped into it.

Lasted for months and went bust.

So at this point we can clearly state that flywheels have no capacity, no ability to store any significant amount of energy at all. They have a role in adjusting the frequency um of of stabilizing the frequency of the energy Supply mainly caused by by the varying amount of intermittent energy coming in. So thereโ€™s a big and growing need for that but no question of them being able to store energy to transfer it from uh um excess time to a high demand time. Not at all. Weโ€™re talking hundredths of a second uh for that plant and even the biggest one is still less less than a hundredth of a second for the UK power supply. No chance at all. But let us move on to another aspect of it just to finally put the nail in the coffin.

Looking at the cost of these flywheels, my source is from this paper โ€œA review of flywheel energy storage rotor materials and structuresโ€. I quote: โ€œThe capital cost per unit power of a FESS system with a rated power output of 250 kW and a maximum expected storage time of 50 minutes is $250 to $350 a kilowatt.โ€ Thatโ€™s the capital cost if you like. โ€œBut the corresponding unit energy cost is between 1,000 to $5,000 a kilowatt hour.โ€ $1,000 to $5,000 a kilowatt hour. That is $763 to 3,816 per kilowatt hour when gas today and weโ€™re talking wholesale prices here is 65p per kilowatt hour. That is 1173 times to 5,871 times more expensive.

But not toโ€ฆ the international renewable energy agency estimates that the unit energy insulation costs of FESS will decrease by 35% by 2030 from the current estimate and itโ€™s their estimate of $1,500 to $6,000 per kilowatt hour down to $1,000 to $3,900 a kilowatt hour. Wow. So if you hang on in hope youโ€™ll only have to pay ยฃ763 to 2,977 per kilowatt hour. Just 1173 to 4,610 times the price of gas. So putting a um 2 kilowatt fire on for an hour would only cost you around ยฃ6,000 and that is providing youโ€™re buying those kilowatt hours at wholesale prices.

Look it doesnโ€™t really matter what the exact price is. No matter what it is itโ€™s exorbitant. It is totally out of the question as backup. But the capacity Factor itself, the amount of energy the flywheel system can store is so small you know a couple of seconds for the National Grid as to be inconsequential. It is not for backup storage. It is totally misrepresented in the press and frankly a lot of the advocates for it have no understanding of of The Logical background to it of the actual math, the actual calculations. And as the engineering part of me looks at these things it is natural to look at the costs and the viability things because Iโ€™m into a world that works not a theoretical world.

So now I hope this has armed you, the viewers of this, has armed you with the answers to why flywheel energy storage has backup to intermittence is actually not good, is incredibly expensive, can only be used for really frequency regulation, ironing out the frequencies and even that is very very expensive. And of course we need more of this, a lot more of this now because of the intermittent nature and the varying all over the place of all these intermittent inputs. So itโ€™s an extra cost of the energy you know.

Iโ€™m just exasperated quite frankly at the world that puts all this forward. I canโ€™t keep up with all the false stories coming through the Press almost every day um and just to tell you by the way uh some of you may may want to know I wear glasses because um Iโ€™ve been having a left eye trouble but I had an operation last Thursday during the making with this video actually and so maybe in a month or so Iโ€™ll be able to take the glasses off. At the moment of course it looks absolutely deplorable my eye so I donโ€™t want to distract people with that. Itโ€™llโ€ฆ people would concentrate on that rather than what Iโ€™m saying.

So um thatโ€™s it. I hope youโ€™ve enjoyed the video and I hope it has yet again armed you um to bring the sanity back into this renewable Madness.

Just one more thing before I leave you um Brian cat the engineer physicist um this week actually passed to me a small video from Carl Sagan um which I think explains um what the danger is in the west, why all these um why all these governments so deplorable at managing all this um. I was on GB news again yesterday um and again thereโ€™s an ex-minister was on after me and someone had already met in the green room and you know clear they they know nothing of what theyโ€™re talking about. Yesterday was about The Madness of carbon capture um but um this short video I think is the nearest Iโ€™ve seen uh to explaining how the madness happens because it is madness and so Iโ€™m going to leave you with that now.

Iโ€™m going to leave you with this short video that I think is worthwhile listening to. So thank you for watching.

There thereโ€™s two kinds of dangers. One is what I just talked about that weโ€™ve arranged a society based on science and technology in which nobody understands anything about science and technology and this combustible mixture of ignorance and power sooner or later is going to blow up in our faces. I mean who is running the science and technology in a democracy if the people donโ€™t know anything about it. And the second reason that Iโ€™m Iโ€™m worried about this is that science is more than a body of knowledge. Itโ€™s a way of thinking, a way of skeptically interrogating the universe with a fine understanding of human fallibility.

If if we are not able to ask skeptical questions, to interrogate those who tell us that something is true, to be skeptical of those in Authority, then weโ€™re up for grabs for the next charlatan political or religious who comes ambling along. It itโ€™s a thing that Jefferson lay great stress on. It wasnโ€™t enough he said to Shrine some rights in a in a constitution or a Bill of Rights. The people had to be educated and they had to practice their skepticism and their education otherwise we donโ€™t run the government, the government runs us.

Never a truer word said.