Global warming, climate change, all these things are just a dream come true for politicians. I deal with evidence and not with frightening computer models because the seeker after truth does not put his faith in any consensus. The road to the truth is long and hard, but this is the road we must follow. People who describe the unprecedented comfort and ease of modern life as a climate disaster, in my opinion have no idea what a real problem is.
Obviously it would be a calamity for Britons to get used to Tomatoes reliably ripening in Summer, and swimming pools being warm enough to use, because they might demand more of the same. Imagine if you could visit a British beach and be confident of actually swimming in the water, I mean for longer than 5 minutes?
Apparently you soft Brits have become so used to mild global warming weather, an almost normal Summer felt freezing cold.
Average months now feel cold thanks to climate change
Published: July 3, 2024 9.20pm AEST Matthew Patterson Postdoctoral Researcher, Atmospheric Physics, University of Reading
People in the UK love discussing the weather. For the first two weeks of June 2024, the cold, dull conditions were all they could talk about. Major news outlets like the BBC, the Guardian, Daily Mail and Daily Telegraph all carried stories on this theme.
The colder start to June was driven by winds from the north, bringing cool polar air down towards the UK. However, in the second half of the month, a high-pressure system took over and temperatures picked up, reaching 30.3°C on Wednesday 26.
In reality, June 2024 temperatures were pretty typical, about 0.4°C below the long-term average. The month was drier than usual and sunshine hours were slightly above average for the UK as a whole, though significantly below average in parts of Scotland and Northern Ireland.
Such a rapid rate of warming means we have come to normalise extreme heat, while relatively cold or even average conditions feel unusual and thus newsworthy.
…
Public normalisation of hotter temperatures may also affect our perception of climate change and thus our willingness to act on it. Ecologists describe a phenomenon called “shifting baseline syndrome”, which is the idea that as the environment degrades, each new generation accepts the degraded situation they experience as normal. This also applies to climate change, as people forget or have no experience of the climate in the not-too-distant past.
Obviously it would be a calamity for Britons to get used to Tomatoes reliably ripening in Summer, and swimming pools being warm enough to use, because they might demand more of the same. Imagine if you could visit a British beach and be confident of actually swimming in the water, I mean for longer than 5 minutes?
Clearly it is time to shut down the British economy and put an end to this subversive warmth, it is time to restore proper British Junuaries. Otherwise Britons might all end up like Australians, drinking beer in the sun and calling relatives who live in cold places to tell them how nice the weather is.
History will record that the United Nations has established itself as the greatest organizational perpetrator of junk science in modern times, if not of all time, with current UN Secretary-General Antonio Guterres destined to be singled out for his personal contribution to the distorted UN climate alarmism.
At Financial Post’s Junk Science Week, Terence Corcoran highlights the hysterical alarmist statements by the UN chief promoting IPCC agenda, the article being The UN emperor has no science. Excerpts in italics with my bolds and added images.H/T John Ray.
Guterres Mangles Metaphors To Pitch Extreme Climate Alarmism
History will record that the United Nations has established itself as the greatest organizational perpetrator of junk science in modern times, if not of all time, with current UN Secretary-General Antonio Guterres destined to be singled out for his personal contribution to the distorted UN climate alarmism.
Since his appointment in 2019, Guterres and the UN have lived up to our standard formal definition of junk science. It occurs when:
scientific facts are distorted,
risk is exaggerated (or underplayed), and
“the science” adapted and warped by politics and ideology to serve another agenda.
That definition encompasses a wide range of activities among scientists, NGOs, politicians, journalists, media outlets, cranks and quacks who manipulate science for political, environmental, economic and social purposes. It also nicely captures the entire United Nations’ climate crusadeand the work of its institutional creation, the Intergovernmental Panel on Climate Change (IPCC).
But no single official can top Guterres as a purveyor of IPCC hype and doom, a living embodiment of Hans Christian Andersen’s fabled emperor who believes he is fully, stylishly dressed but in fact has no clothes.
Our Sinking Planet – Antonio Guterres is a photograph by Photograph by Christopher Gregory for TIME which was uploaded on July 21st, 2020.
Guterres, a former Socialist Party prime minister of Portugal (1995-2002) and president of the Socialist International (1999-2005), was in typically ridiculous form on June 5th when he delivered a speech at the Museum of Natural History in Manhattan, at an event billed as “A Moment of Truth” and a “special address on climate action.” Guterres talked about a planet on a “highway to climate hell,”rehashing a line he used in 2022 in Egypt at the COP27 climate conference: “We are on a highway to climate hell with our foot still on the accelerator.”
Guterres also has no qualms about mixing and mangling metaphors. He simultaneously told the Manhattan audience that humans are “like the meteor that wiped out the dinosaurs, we’re having an outsized impact. In the case of climate, we are not the dinosaurs. We are the meteor. We are not only in danger. We are the danger.”
The longer Guterres rambles on, the more confusing, contradictory and senseless the metaphors become:
“We are playing Russian roulette with our planet. We need an exit ramp off the highway to climate hell. And the truth is … we have control of the wheel.”
Other Guterres’ climate spins include: “Humanity has opened the gates of hell” and “become a weapon of mass extinction.” And: “We must go into emergency mode and put out this five-alarm fire.”
Is Guterres describing reality — or the content of a new AI computer game in which some crazed teenaged human monster drives a flaming meteor through the ozone layer, knocking off dinosaurs before crashing onto a highway and plowing into a Russian Museum of Political Roulette just outside the Gates of Hell?
As UN Secretary-General, Guterres sits atop a hierarchy of agencies such as the IPCC climate science megaplex, which was created in 1988 by two other UN agencies, the World Meteorological Organization (WMO) and the United Nations Environment Program (UNEP). UNEP was cobbled together in 1972 as the brainchild of Maurice Strong, the late Canadian global environmental schemer, who famously mused about a fictional environmental crisis that leads a group of global insiders to decide the only hope for the planet is “that the industrialized civilizations collapse.” The current “de-growth” movement is a version of deindustrialization that reflects Guterres’ off-ramp from the highway to hell. In fact, the word “de-growth” appears 28 times in the IPCC’s sixth and latest Assessment Report .
With these UN agencies as his guide, Guterres’ verbal jumble of science statements is no better than his mixed metaphors. His abuse of climate and environmental facts has often been commented upon, including in a YouTube video titled “Who is Antonio Guterres?,” posted earlier this year by Ottawa journalist John Robson on his Climate Discussion Nexus site. Robson reviews and highlights some of the garbled inaccuracies and misrepresentations Guterres routinely cranks out.
For instance: “Climate-related natural disasters are becoming more frequent, more deadly, more destructive with growing human and financial cost.” Not true . And: “The number of weather, climate and water-related disasters has increased by a factor of five over the past 50 years.” Also not true .
When it comes to policies to deal with his fantastic vision of planetary destruction, Guterres aligns with Maurice Strong’s de-growth agenda. In his Manhattan speech, he repeated the UN call for a “fossil-fuel phase-out” since “economic logic makes the end of the fossil fuel age inevitable.” He urged financial institutions to “stop bankrolling” fossil fuel industries. “Fossil fuels are not only poisoning our planet,” he told bankers, “they’re toxic for your brand.”
The planet would be much better off if national governments stopped bankrolling Guterres and the United Nations and their constant poisoning of our science, economics and politics.
In contrast, the real-time surface station temperature record of Temperature.global reports cooling since January 2015.
We remind you that the notion of “average global temperature,” however guesstimated, has no physical meaning and there are many significant problems associated with it. That said, we will address the claimed warming spike of the past year at the end. Let’s move on to this month’s fact checks.
Guest Post by: The Competitive Enterprise Institute, The Heartland Institute, the Energy & Environmental Legal Institute, the Committee for a Constructive Tomorrow, and the International Climate Science Coalition, and Truth in Energy and Climate.
Editor’s note: This summary serves as a fact check on the biggest false claims made in the media in June, 2024.
NASA satellite data indicates that June 2024 was still in the warming spike of the past year although slightly cooler:
In contrast, the real-time surface station temperature record of Temperature.global reports cooling since January 2015.
We remind you that the notion of “average global temperature,” however guesstimated, has no physical meaning and there are many significant problems associated with it. That said, we will address the claimed warming spike of the past year at the end. Let’s move on to this month’s fact checks.
Links: The Washington Postarticle, U.S. EPA graph.
One last thing notable for June is the media suppression of the late-May study from one of the Nature journals reporting that 80% of the past year’s warming spike was caused by cleaner air allowing more solar radiation to hit the Earth’s surface. When the study was first published, it was covered by Reuters and the Telegraph (UK).
But other than a one-sentence allusion to it in the Washington Post almost one month later, the media has failed to report about it despite efforts to bring it to their attention.
The dishonest media is why we do these monthly fact checks. Check out these and other great fact checks from June at:
Let me be a little clearer on that: EPA has its own data on Heat and Cold Related Deaths – these two statistics are official “Climate Indicators”. The official Climate Indicators maintained by the EPA, with annual rates for deaths classified as “cold-related” by medical professionals in the 50 states and the District of Columbia, show that COLD is the leading weather related killer, with Cold-related Death Rate exceeding that of the Heat-related Death rate.
“I have been communicating with the Climate Indicators team at EPA about this: they up-dated the Heat-Related, but not the Cold-Related, Deaths page. And yes, golly, it does suspiciously look like they have managed to change down-trending data into up-trending data. Not jumping to conclusions yet. I’ll let readers know when I have sorted it out with EPA.”
I wrote a pleasant inquiry to the Climate Indicators Team at the EPA: (excerpt):
“I am a Science Research Journalist and appreciate your reply. However, …we are counting on your team to keep these indicators up to date for all of us — the Cold Deaths data is now eight years out of date, or, being charitable, six years allowing for the two-year lag at CDC.
If you are familiar with the data on the two pages, Heat and Cold deaths, you will realize that the official statement made on the Heat Deaths page is in error. It states “Heat is the leading weather-related killer in the United States” — which your data on the Heat and Cold Deaths directly refutes. Cold is shown as have a death rate per million at 5.5 to 6 (even back in 2016) while even the updated Heat Deaths does not even reach 5 per million.
Given this, it appears that EPA is intentionally or negligently obfuscating the data to support a false claim.
I would appreciate a more thorough answer before I go to press.”
Despite this being near-enough to the long 4th of July weekend (U.S. Independence Day), I received the following answer:
“Your inquiry was shared with me. Please see our response below, on background.
Yesterday, EPA released its updated Fifth Edition of its Climate Change Indicators report. As you saw, numerous indicators have been updated on EPA’s website in anticipation of this release. EPA prioritized updating those indicators featured in the report, but we remain committed to keeping all our indicators updated. We plan on updating Cold-Related Deaths in our next set of rolling updates on the web.
The statement that heat is the leading weather-related killer in the United States is based on an analysis conducted by the National Weather Service. EPA provides this information in the “Background” section as context for the discussion of heat. EPA does not use its indicator data as a basis for that contextualizing statement. We will further clarify this on EPA’s website. We recommend that you follow up with the National Weather Service (NWS) if you have additional questions about their data or finding.
Thank you again for your interest in EPA’s climate change indicators.
Respectfully, Shayla R. Powell — Office of Media Relations and Risk Communications — Office of Public Affairs
It turns out that, just like the main stream media and all of the Climate Crisis Propaganda outlets, EPA uses the “analysis conducted by the National Weather Service”. EPA has its own data collected from the CDC (via records of actual death certificates) but doesn’t use it in “contextualizing” the statement that “Heat is the leading weather-related killer in the United States”.
Let me be a little clearer on that: EPA has its own data on Heat and Cold Related Deaths – these two statistics are official “Climate Indicators”. The official Climate Indicators maintained by the EPA, with annual rates for deaths classified as “cold-related” by medical professionals in the 50 states and the District of Columbia, show that COLD is the leading weather related killer, with Cold-related Death Rate exceeding that of the Heat-related Death rate.
But they defer to the [known to be wonky] National Weather Service little graphic of “Weather Fatalities” [pretending that it is an “analysis” of some sort – when it isn’t even a serious count of any kind.] And when challenged on this point, their response is: “Take it up with the NWS!”
EPA does promise that because “EPA does not use its indicator data as a basis for that contextualizing statement. We will further clarify this on EPA’s website.” I will be holding my breath to see the updated Cold-related Deaths data and what the clarification will say.
So, where does the National Weather Service [NWS] get the data for their “analysis”? It is possible to find out, but “It ain’t easy”!
“Storm Data is an official publication of the National Oceanic and Atmospheric Administration (NOAA) which documents the occurrence of storms and other significant weather phenomena having sufficient intensity to cause loss of life, injuries, significant property damage, and/or disruption to commerce.”
This is not an easy topic…but the simple fact is that Cold-related Deaths will not be counted unless they have been entered into the Storm Events Database by a “Storm Data preparer”.
“Some information appearing in Storm Data may be provided by or gathered from sources outside the National Weather Service (NWS), such as the media, law enforcement and/or other government agencies, emergency managers, private companies, individuals, etc. An effort is made to use the best available information, but because of time and resource constraints, information from these sources may be unverified by the NWS. Accordingly, the NWS does not guarantee the accuracy or validity of the information.”
The NWS does not directly collect deaths data, but only peripherally — from “the media, law enforcement and/or other government agencies, emergency managers, private companies, individuals, etc.” This means that the NWS Weather Fatalities is a catch-as-catch-can compilation of reports about possible deaths that are recorded in a database about NWS recognized “storms or other significant weather phenomena”.
A happens-every-winter well-below freezing night in which a family freezes to death in their car after breaking down in a remote area will not be in the database and not in NWS Weather Fatalities. A senior citizen who quietly dies of hypothermia in her un- or under-heated apartment will not be in the database. A homeless person dying on the streets of Chicago, the windy city, is not counted. After all, it is expected to be cold in the winter and being cold is not a “weather event”. However, declared Heat Waves are weather events are entered in the data base, and reports in the media or from other authorities (hospitals etc) are search out and recorded.
In short, the NWS Weather Fatalities statistic is a non-scientific gathering of data only “intended for internal NWS statistical review to assist NWS in its primary mission of issuing forecasts and warnings for hazardous weather events.”
EPA promulgates unscientific, unreliable information from another federal agency, NWS, despite the fact that it directly contradicts their own data [Climate Indicators], in a go-along-to-get-along, “it forwards the agenda” manner.
The Climatist talking point “Heat is the leading weather-related killer in the United States” is FALSE – and this fact is well documented in the peer reviewed climate and health literature.
EPA says it will clarify this point on the Climate Indicator – Heat-related Deaths web page….soon, maybe.
# # # # #
Author’s Comment:
And so it goes. The U.S. Federal agencies intended to supply citizens and policy-makers with carefully analyzed scientific data don’t do so – at least on this topic at EPA and NOAA’s NWS. It is embarrassing. Their excuses are embarrassing.
I’ll let you know if they actually keep their promise and sort it out – personally, I doubt it. If they update the Heat/Cold Deaths data they will have to publicly reject NWS’s Weather Fatalities data.
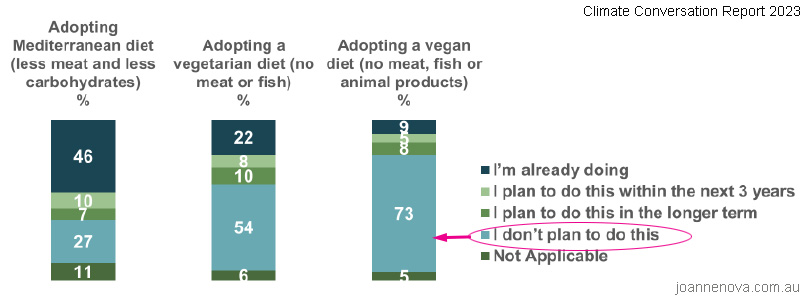
Yet another survey shows most people know what to say when asked banal questions of climate dogma — “Yes they are “very worried”. But more than half the population don’t believe climate change is going to harm them and they have “no intention” of giving up meat, or their cars or their pets. And for people who only fly once a year, the idea of flying less was very unappealing. Worse, the under 35s like taking a series of flights each year is so normal now it’s “part of their identity”.
Yet another survey shows most people know what to say when asked banal questions of climate dogma — “Yes they are “very worried”. But more than half the population don’t believe climate change is going to harm them and they have “no intention” of giving up meat, or their cars or their pets. And for people who only fly once a year, the idea of flying less was very unappealing. Worse, the under 35s like taking a series of flights each year is so normal now it’s “part of their identity”.
After years of this tedious preachy non-debate the report authors even had to acknowledge that “virtue signaling” was a thing, and it was turning off middle and lower class people. Rather than being seen as heroes, those who did a lot to prevent climate change were seen as boring and earnest, and either miserable martyrs or people who are “intentionally vocal” about their actions, partly as a way to show off. The working poor didn’t like being talked down to, and it reinforced the idea that “climate action” was something for people who could afford it. It’s a rich girls game…
POST NOTE: This survey is not as stupid as most of their surveys. Usually they just ask how worried people are. This survey gives us (and them) an idea of just how superficial that “worry” is. Apparently the world is going to end, but 6 out of 10 people are not going to give up their cars, their favorite food or their pets. That means they are not that worried. More than half don’t believe it’s harming them. It doesn’t get more basic than this. Four thousand experts have told the people for 30 years that climate change is their fault and a catastrophe — and more than half the audience doesn’t think the experts are right.
Their team is swimming in so much grant money they accidentally did a survey showing 60% of the population don’t believe them.
A study on Irish attitudes toward climate change has found more than half of respondents did not believe it is harming people in Ireland, and that a significant gap exists between people’s climate-related intentions and actions.
Older homeowners, particularly those in rural locations, often believe their way of life is “under threat” as a result of climate initiatives and the report recommends the impact of this change on the “identity of people” be further considered.
The report found many people, males in particular, had no intention of reducing their meat consumption and following a diet seen as more climate friendly.
It’s biology: 54% of people said they have no intention to be vegetarian, and when asked about being vegan, 73% said “No”.
People think they’re already taking enough climate action (like recycling and catching more buses) while the report writers said this was a misunderstanding and people actually needed to “do a lot more”.
Indeed, nearly 60% of the population says they are already walking and cycling more frequently instead of driving and they’re flying less too. Yet there are obviously just as many cars on the road and planes in the sky as ever before, proving researchers need to ask better questions.
If I catch a bus one time this year that’s more frequent than last year, right?
Likewise, are 82% of people really choosing foods with less packaging?
The report authors admit that the unwashed masses are not buying the “fly less” message while celebrities and politicians were flying more:
Across the workshops, individuals didn’t routinely make the connection between the numerous holidays they had booked abroad and the damage to the climate. Numerous arguments were made to justify this travel which point to challenges in communicating the benefits of flying less. Arguments included the fact that the flights were departing whether they were on-board or not and that their impact was minimal when compared with people in the public eye travelling on private jets. These responses point to a sensitivity to people in the public eye (particularly international celebrities) continually flying in private jets frequently whilst the broader population is being asked to not take a holiday and city break abroad.
And finally, there is the realization that “virtue signaling” is its own liability:
They are perceived to be potentially quite boring and earnest as they sacrifice activities such as foreign travel to align with their values. At an extreme, they are viewed as miserable martyrs. They are intentionally vocal about their actions. It was believed that this was intended as an attempt to promote positive actions in others but also to demonstrate their virtuous behaviour. Unfortunately, this active promotion to others less well-placed to act risked being viewed as an attempt to talk down to others, further reinforcing the view of climate action being for those who can afford it.
In Ireland we’re not to burn peat, For the climate and we’re not to eat meat, Nor travel too far, In a petrol run car, Explains why more greens lose a seat.
The U.S. Supreme Court June 24 agreed to take up a case that may ultimately determine whether critical infrastructure projects – from transportation to transmission of energy – will require climate impact analyses before that can go forward.
Plans by a public-private partnership to construct an 88-mile-long rail line in eastern Utah connecting oil producers in the area to a nationwide rail network were put on hold, when the D.C. Circuit Court of Appeals, siding with environmental activists, ruled that local officials had not given the project’s climate impacts adequate consideration, and that more studies were needed.
The U.S. Supreme Court June 24 agreed to take up a case that may ultimately determine whether critical infrastructure projects – from transportation to transmission of energy – will require climate impact analyses before that can go forward.
Plans by a public-private partnership to construct an 88-mile-long rail line in eastern Utah connecting oil producers in the area to a nationwide rail network were put on hold, when the D.C. Circuit Court of Appeals, siding with environmental activists, ruled that local officials had not given the project’s climate impacts adequate consideration, and that more studies were needed.
Upon completion, the Uinta Basin Railway would enable an additional 350,000 barrels of oil a day to be shipped to markets nationwide, including all the way to refineries near the Gulf of Mexico. Currently, the oil produced in rural Utah is carried on tanker trucks, a far more expensive and less energy-efficient way of bringing the product to market.
But the proposed rail line hit a roadblock last year, when the D.C. Circuit Court ruled that the Surface Transportation Board’s environmental approval of the project was rushed and violated federal law. The court said the board should have studied the impact of the drilling and transporting more oil along the entire route, stretching thousands of miles to the Gulf Coast. https://apnews.com/article/supreme-court-utah-uinta-basin-railway-oil-d6dfb030e7176d8bfed30906ad839981
Recognizing the threat such an expansive view of the Surface Transportation Board’s authority poses to their rail line and other infrastructure projects, the developers, investment firm DHIP Group and the Seven County Infrastructure Coalition, a body of eastern Utah officials, petitioned the Supreme Court to intervene.
“De-facto Environmental Policy Czar”
“By requiring an agency to consider any environmental effect that it has the power to prevent, no matter the limits of its regulatory authority, the D.C. Circuit rule turns each agency into a ‘de-facto environmental-policy czar,’” the coalition argued in its petition. https://www.supremecourt.gov/docket/docketfiles/html/public/23-975.html
Environmental groups, along with Colorado Sen. Michael Bennett (D) are vehemently opposed to the project, citing the rail line’s effect on climate change and the possibility of a spill in the Colorado River.
“It’s disappointing the Supreme Court took up this case but the appellate court decision on this destructive project is sound and should ultimately stand,” Wendy Park, a senior attorney at the Center for Biological Diversity, said in a statement.
It takes four justices for the Supreme Court to agree to hear a case, and getting that number is seen as a good sign by the rail line’s backers. But before the high court hands down a ruling, it will likely have to revisit a 2004 case, Department of Transportation v. Public Citizen. That ruling said that, under the National Environmental Policy Act (NEPA), an agency need not assess an environmental impact if it lies outside the agency’s jurisdiction. In the 20 years since the opinion was handed down, some federal courts have adhered to a narrow interpretation of the ruling, limiting environmental reviews to areas where an agency has congressionally defined regulatory authority. Other courts, such as the D.C. Circuit Court, have taken a more expansive view of an agency’s authority.
Keith Heaton, director of the Seven County Infrastructure Coalition, says the Supreme Court needs to provide better guidance when it comes to this key provision of NEPA. “What the Washington court ruled was that we needed to look more at upstream and downstream environmental impacts but the D.C. Circuit Court didn’t define what that means…There’s nothing to prevent anyone anywhere from coming back after we do more work to say you didn’t do this in this place,” he toldBASINNOW.com. https://www.basinnow.com/scic-director-supreme-court-to-hear-uinta-basin-railway-case/
Another Opportunity to Rein in the Administrative State
Crippling the infrastructure needed for the extraction and transport of fossil fuels is a key component of the transition to green energy. Now that the Supreme Court has agreed to take up the case of the Utah rail line, the opportunity presented to climate activists by NEPA may be cut off. In recent decisions – West Virginia v. EPA, Sackett v. EPA, and Loper Bright Enterprises v. Raimondo (overturning of Chevron deference) – the court has curtailed federal agencies’ power to regulate beyond what Congress specifically authorized. This bodes well not only for the Utah rail line, but also for other construction projects around the country threatened by being tied up in knots by agencies overstepping their authority.
The case will be heard this fall, with a ruling expected to be handed down in June 2025.
The climate event of 2023 was truly exceptional, but the prevailing catastrophism about climate change hinders its proper scientific analysis. I present arguments that support the view that we are facing an extraordinary and extremely rare natural event in climate history.
The climate event of 2023 was truly exceptional, but the prevailing catastrophism about climate change hinders its proper scientific analysis. I present arguments that support the view that we are facing an extraordinary and extremely rare natural event in climate history.
1. Off-scale warming
Since the planet has been warming for 200 years, and our global records are even more recent, every few years a new warmest year in history is recorded. Despite all the publicity given each time it happens, it would really be news if it didn’t happen, as it did between 1998 and 2014, a period popularly known as the pause.
Figure 1. Berkeley Earth temperature anomaly
Since 1980, 13 years have broken the temperature record. So, what is so special about the 2023 record and the expected 2024 record? For starters, 2023 broke the record by the largest margin in records, 0.17°C. This may not sound like much, but if all records were by this margin, we would go from +1.5°C to +2°C in just 10 years, and reach +3°C 20 years later.
Figure 2. Berkeley Earth 2023 temperature anomaly
Moreover, to produce so much warming, almost the entire globe experienced above-average warming. 2023 was a year of real global warming, although most of the warming occurred in the Northern Hemisphere.
Figure 3. 2023 global surface temperature anomaly over pre-industrial baseline in six datasets.
As a result, one of the major databases, Berkeley Earth, has exceeded the +1.5°C limit for a full year for the first time, and 2024 promises another temperature record. Crossing the dangerous warming threshold so early has caused some confusion, exacerbated by the fact that not much difference seems to be noticeable. Even Arctic ice remains above the average of the last decade. And if we’ve already crossed the line and the climate is beyond repair, what’s the point of trying?
Figure 4. Global temperature calculation by Copernicus system.
But the authorities have been quick to point out that even if we are above +1.5°C in 2023 or 2024, we will not have crossed the threshold. There is a catch. The global temperature is not the temperature of one month or one year, but the temperature of the linear trend of the last 30 years, which according to the European Copernicus system is +1.28°C and is expected to exceed +1.5°C in 10 years.[i]
2. Uncharted territory
In June 2023, the North Atlantic experienced a heat wave unprecedented in 40 years, with temperatures 5°C warmer than usual. Carlo Buontempo, the director of Copernicus, said the world was “entering uncharted territory. We have never seen anything like this in our life”.[ii] To understand what has puzzled scientists so much, it is necessary to look at the evolution of the temperature of the Earth’s oceans throughout the year since 1979.
Figure 5. 60°N-60°S global ocean surface temperature by year since 1979.
On average, the Earth’s oceans are warmest in February-March and coldest in October-November, with an intermediate maximum in August. This is an annual cycle caused by the tilt of the Earth’s axis, the arrangement of the continents, and seasonal changes in atmospheric circulation and albedo. A cycle that has never been broken as long as measurements have been kept until 2023. This year shows an accentuated warming since January, leading to daily temperature records since the beginning of April. But what is absolutely astonishing is that the ocean continued to warm in June and July and reached an annual maximum in August, something that has never happened before. And the warming through August is staggering, about 0.33°C above the 2016 record, which is huge for the ocean. After that, the annual cycle begins to behave normally, but at a much higher temperature, which is slowly falling. In June 2024, after 415 days of record temperatures, the ocean is still about 0.2°C warmer than it should be.
Buontempo means good weather in English, and his phrase “we have entered uncharted territory” has become very popular. However, it assumes that we have reached and will remain in this situation, whereas the data suggest that this is a one-off anomaly with diminishing effects. For now, it tells us that nothing dramatic is happening as we approach the politically established warming threshold.
Gavin Schmidt, director of NASA’s climate monitoring institute, also uses the expression “uncharted territory” when he explains that the 2023 anomaly worries scientists, saying that climate models cannot explain why the planet’s temperature suddenly spiked in 2023. Not only was the temperature anomaly much larger than expected, but it occurred months before the onset of El Niño. In his own words: “The 2023 temperature anomaly has come out of the blue, revealing an unprecedented knowledge gap perhaps for the first time since about 40 years ago. It could imply that a warming planet is already fundamentally altering how the climate system operates, much sooner than scientists had anticipated.”[iii] According to Gavin, we could have broken the climate and the models would no longer work.
Instead of abandoning science for wild speculation let’s examine the possible factors responsible for the abrupt warming that Gavin Schmidt dismisses by saying they could explain at most a few hundredths of a degree, for which he has little evidence.
3. The little boy is innocent
El Niño is unlikely to be responsible for the simple reason that such abrupt global warming is unprecedented in our records, and El Niño has many precedents. In addition, El Niño warms a specific region of the equatorial Pacific and primarily affects the Pacific, while the “2023 event” warmed parts of the North Atlantic to an extraordinary degree. This does not prevent scientists like Jan Esper and Ulf Büntgen from saying that 2023 is consistent with a greenhouse gas-induced warming trend amplified by an El Niño.[iv] They clearly did not examine the data before writing this, nor did the reviewers of their Nature paper.
The relationship between the temperature of the equatorial Pacific and that of the global ocean during an El Niño is shown in the figure below.
Figure 6. Niño 3.4 temperature anomaly (red) and detrended satellite global ocean temperature anomaly (black).
The temperature anomaly in the Pacific Niño 3.4 region shows the very strong Niños of 1983, 1998, and 2016, and the strong Niños of 1988, 1992, 2009, and 2024. The years correspond to the month of January during the event. When the satellite global ocean temperature anomaly is plotted without its long-term trend, we observe a very close correspondence. The long-term trend responds to other causes, but the temperature variations correspond to the export of heat from the equatorial Pacific to the rest of the globe.
We also observe two things. The first is that the correspondence fails in two periods, in 1992 as a result of the Pinatubo eruption a year earlier, and in 2024. The second observation is that in all strong or very strong Niños, the source of the heat, the equatorial Pacific, warms earlier and warms more or as much in relative terms as the global ocean warms later. This does not happen in the 2024 El Niño. The warming is simultaneous and greater than it should be outside the equatorial Pacific.
Figure 7. Niño 3.4 temperature anomaly (red) and detrended ERSST PDO (blue).
The Pacific Decadal Oscillation (PDO) is often described as a long-lived pattern of climate variability similar to El Niño in the North Pacific. And this is evident when we compare the two after removing a long-term trend that the PDO should not have. The agreement is very strong, and again we see a significant anomaly in 1991 due to the Pinatubo eruption. But even more important is the anomaly in 2023-24, when the PDO shows extraordinarily small changes and remains negative when it should be positive.
Figure 8. During the 2023 event the North Pacific stayed in negative PDO conditions, while the equatorial Pacific displayed El Niño conditions.
To understand this response, one must consider that the warm phase of the PDO requires the Northwest Pacific to be cold, but as we have shown above, the Northwest Pacific was very warm in 2023, causing the PDO to remain in a cold phase. A negative phase of the PDO during El Niño is unprecedented and categorically rules out El Niño as the cause of the abrupt warming that has puzzled scientists. In fact, it is possible that the ocean warming that began in March 2023 was the cause of the 2024 El Niño by weakening the trade winds in the equatorial Pacific.
I’d like to thank Charles May for bringing this data to my attention and for doing such an excellent job analyzing it each month.
4. Sulfate aerosols are not responsible
Another possibility that is under consideration is the reduction of sulfate aerosols as a result of the change in marine fuel regulations in 2020.
Figure 9. Global sulfur emissions for the past 64 years
The reduction in sulfur emissions since the late 1970s is considered a significant warming factor by reducing emissions of shortwave radiation reflected from the atmosphere. However, the reduction in sulfur dioxide emissions from marine fuels since 2020 is estimated at 14% of total emissions.
Figure 10. Model-calculated global temperature effect of an 80% reduction (red curve) in marine fuel sulfur content from pre-2020 situation (blue curve), and decadal mean difference (green bars).
A recent study, still under peer review, used a climate model to calculate that sulfur emission reductions from 2020 could cause global warming of 0.02°C in the first decade.[v] Since the warming in 2023 was 10 times greater, it is difficult to believe that emissions reductions since 2020 could have been a major factor in the abrupt warming in 2023.
In the figure, the blue curve is the global warming predicted with the previously used marine fuel, and the red curve is the one predicted with the fuel with 80% less sulfur. The difference between the two curves for the decade 2020-30 is the green bar of 0.02°C.
5. CO₂ increase didn’t do it
The amount of CO₂ in the atmosphere has increased slightly by about 2.5 parts per million in 2023.
Figure 11. Monthly (red) and 12-month (black) CO₂ levels at Mauna Loa.
The increase from 418.5 to 421 ppm represents an increase of 0.6% and is similar to the increase that has occurred each year for the past several decades. Nothing in our knowledge of the effect of CO₂ increases on climate suggests that such a small increase could have led to such a large and abrupt warming. There is no study to suggest that the gradual increase in CO₂ could lead to a sudden increase in climate variability. Therefore, all model predictions are long-term and affect the statistics of weather phenomena. The proof is that scientists and models cannot explain what happened in 2023.
6. Tonga volcano prime suspect
Just over a year before the abrupt warming, in January 2022, an extremely unusual volcanic eruption took place in Tonga. How unusual? It was an eruption of VEI 5 explosivity, capable of reaching the stratosphere, which occurs on average every 10 years.
Figure 12. Time and cone elevation of VEI ≥5 volcanic eruptions of the past 200 years, their distribution by altitude (yellow bars), and the suggested depth for a submarine eruption capable of projecting a large amount of water to the stratosphere (red line).
There have been a number of eruptions with VEI 5 or higher in the last 200 years, although not all of them have affected the global climate. This figure shows with dots the date they occurred and the elevation at which the volcanic cone was located. The yellow bars show the distribution of eruptions in 500 m elevation bins. The Tonga eruption was a submarine explosion at very shallow depths, about 150 m below the sea surface. It ejected 150 million tons of water into the stratosphere.
In our 200 years of records there is only one other submarine eruption with VEI 5, which occurred in 1924 off the Japanese island of Iriomote at a depth of 200 m and did not affect the atmosphere. Only surface effects were observed. NASA scientists believe that the Tonga explosion occurred at the right depth to project a lot of water into the stratosphere.[vi] This depth is indicated by the red line. So, the Tonga eruption is a once in 200-year event, probably less than once in a millennium. Science was very lucky. We are not so lucky.
We know that strong volcanic eruptions, capable of reaching the stratosphere, can have a very strong effect on the climate for a few years, and that this effect can be delayed by more than a year. The eruption of Mount Tambora in April 1815 had a global effect on the climate, but it took 15 months for the effect to develop, during the year without a summer of 1816. These delayed effects coincided with the appearance of a veil of sulfate aerosols in the Northern Hemisphere atmosphere due to seasonal changes in the global stratospheric circulation.
Figure 13. Stratospheric water vapor anomaly at 45°N.
In this image on the vertical axis, we observe the water vapor anomaly in the stratosphere between 15 and 40 km altitude with ocher tones for negative values and greenish for positive ones. The measurement takes place at 45° latitude in the northern hemisphere. On the horizontal axis is the date, and we can see that the large anomaly created by the Tonga eruption does not appear in the Northern Hemisphere until one year later, in 2023, when the warming occurred. Thus, there are dynamical events in the stratosphere that have the appropriate time lag to coincide with the abrupt warming in 2023.
Because the Tonga eruption is unprecedented, there is much about its effects that we do not understand. But we do know that the planetary greenhouse effect is very sensitive to changes in stratospheric water vapor because, unlike the troposphere, the stratosphere is very dry and far from greenhouse saturation.
As a group of scientists showed in 2010, the effect of changes in stratospheric water vapor is so important that the warming between 2000 and 2009 was reduced by 25% because it decreased by 10%.[vii] And after the Tonga eruption, it increased by 10% because of the 150 million tons of water released into the stratosphere, so we could have experienced much of the warming of an entire decade in a single year.
Figure 14. Global water vapor anomaly above 68hPa.
The stratosphere has already begun to dry out again, but it is a slow process that will take many years. In 2023 only 20 million tons of water returned to the troposphere, 13%.[viii]
7. Dismissing natural warming
On the one hand, we have an absolutely unprecedented abrupt warming that the models cannot explain and that has scientists scratching their heads. Such anomalous warming cannot logically respond to the usual suspects, El Niño, reduced sulfur emissions, or increased CO₂, which have been going on for many decades.
On the other hand, we have an absolutely unprecedented volcanic eruption, the effects of which we cannot know, but which, according to what we know about the greenhouse effect, should cause significant and abrupt warming.
Of course, we cannot conclude that the warming was caused by the volcano, but it is clear that it is by far the most likely suspect, and any other candidate should have to demonstrate its ability to act abruptly with such magnitude before being seriously considered.
So why do scientists like Gavin Schmidt argue, without evidence or knowledge, that the Tonga volcano could not have been responsible? If the effect were cooling, the volcano would be blamed without a second’s hesitation, but significant natural warming undermines the message that warming is the fault of our emissions.
This article can also be watched in a 19-minute video with English and French subtitles.
As we know, 77.9% of the Met Office’s temperature station network is junk Class 4 and 5.
But how many of these have been added in recent years?
The Met Office have now sent me a full list of stations, showing both Class and opening date. Since 2000, 58 stations have been added, out of a current total of 380. However only nine are acceptable Class 1 and 2s:
Class
No
1
1
2
8
3
5
4
29
5
15
Total
58
One Class 4 station was opened as recently as last year at Arthog in Wales.
It is one thing having poorly sited stations which have been around for decades. But I personally find it unacceptable that the Met Office have deemed it appropriate to carry on opening so many more, which they know full well should not be used for climatological purposes.
It is surely not beyond their wit to build a few pristine Class 1 sites. Which leads us to the conclusion that they are doing it deliberately.
Meanwhile in other news, the hottest place in the UK yesterday was ………………………………………….. HEATHROW!!
Scientists continue to uncover evidence of a much warmer Early Holocene, when CO2 hovered near 260 ppm.
According to a new study, an ancient 42-centimeter long oyster shell has been found ~20 km inland from today’s Taipei Basin (Taiwan) coast.
Extensive isotope analyses (69 of them) of a 5 cm section of the shell reveal that the last time this area was regularly under sea level was about 8000 years ago, or during the Early Holocene.
Given that oysters reside in water depths of about 2 meters, sea levels can be calculated to have been about 1-3 meters higher than present at that time.
Also, while modern winter temperatures range from 14-16°C at this location, the analyses further revealed that the Early Holocene winter sea surface temperatures likely ranged from 15 to 23°C, which is ~4°C warmer than today on average, and up to 8°C warmer if winter temperatures reached 23°C.
“winter temperature in Taipei Basin ~7660 cal BP was estimated as 15-23°C, warmer than today [14-16°C]”
For millennia, food production and pricing have been disrupted by the weather, with one-off events such as heatwaves, droughts, flooding or frosts cutting harvests and raising prices. War and disease are also factors, as the world saw recently after Russia’s invasion of Ukraine, and the swine fever that swept through China’s pig population.
But another, more sustained thread has run through many sharp increases in food prices. From oranges in Brazil to cocoa in west Africa; olives in southern Europe to coffee in Vietnam, permanently shifting weather patterns as a result of climate change are reducing crop yields, squeezing supplies and driving up prices.
Adam Davis, co-founder of global agricultural hedge fund Farrer Capital, says climate change has helped drive up prices for a long list of food commodities trading at higher levels this year. “Wheat is up 17 per cent, palm oil 23 per cent . . . sugar 9 per cent and pork 21 per cent,” he says. For the consumer, the “lag effect of those high commodity prices is not going away”.
A third of the food price increases in the UK in 2023 was down to climate change, according to the Energy and Climate Intelligence Unit think-tank.
“There’s a material impact from climate change on global food prices,” says Frederic Neumann, chief Asia economist at HSBC. “It’s easy to shrug off individual events as being isolated, but we’ve just seen such a sequence of abnormal events and disruptions that, of course, add up to climate change impact.”
Such repeated events result in “a permanent impact on the ability to supply food,” argues Neumann. Food price rises once considered temporary are becoming a source of persistent inflationary pressure.
Globally, annual food inflation rates could rise by up to 3.2 percentage points per year within the next decade or so as a result of higher temperatures, according to a recent study by the European Central Bank and the Potsdam Institute for Climate Impact Research.
The only factor pushing up food prices is the consistently high price of oil and gas, the intended result of attempts by western governments to throttle off new drilling. This impacts both the operating costs for farmers and also the price of fertiliser.
If any of these lies were true, do you honestly believe those same governments would be wanting to rewild large areas of the planet?


You must be logged in to post a comment.