Alaskaโ€™s Bad Energy Bill of the Week โ€“ Carbon Storage (HB 50/SB 49)

โ€œTo summarize, Alaskaโ€™s Carbon Storage bill ranks among the worst of the worst. When was the last time you as an Alaskan were asked if you wanted to participate in a carbon reduction strategy at all, especially considering our limited footprint on the global scale?โ€

From Master Resource

Byย Kassie Andrewsย 

Ed. Note: Yesterday, ten amendments limiting HB 50 โ€“ Carbon Storage were defeated in the Alaska legislature, indicating a path to passage. See the comment section for more information.

โ€œTo summarize, Alaskaโ€™s Carbon Storage bill ranks among the worst of the worst. When was the last time you as an Alaskan were asked if you wanted to participate in a carbon reduction strategy at all, especially considering our limited footprint on the global scale?โ€

Governor Mike Dunleavyโ€™s โ€œCarbon Management and Monetization Bill Packageโ€ is double trouble for Alaska. HB 50/SB 49 โ€“ Carbon Storage, introduced by Dunleavy at the beginning of the 33rd session (2023โ€“2024), is coupled with a carbon offset bill, HB 49/SB 48. โ€œThe package consists of two pieces of legislation focusing on a carbon offset program; and carbon capture, utilization, and storage (CCUS) programโ€

The carbon offset legislation (โ€œtree billโ€) passed last session despite unanimous public testimony in opposition. The public process leaves much to be desired as the Senate Finance Committee (see this video) decided there were better things to do than listen to what citizens had to say last year.

Globalist Scheme

Capture, storing, and sequestering carbon dioxide (CO2), the gas of life, is a nefarious scheme by a global elite to control processes to manage raw materials, transportation, manufacturing, and agriculture. The claim is that these sectors need to be decarbonized if we are to achieve net-zero emissions goals created for us by 2050.

According to Roberto Bocca โ€“ Head, Centre for Energy and Materials with the World Economic Forum (WEF) on the Net-Zero Industry Tracker Report in 2023:

โ€œIt is imperative that action is taken soon to both decarbonize and improve energy efficiency; otherwise, unabated fossil-fuel demand in the key industry sectors, which have grown 8% on average the past three years, will increase very significantly by 2050,โ€ said Bocca. โ€œBut industrial leaders can respond through new collaborative ways of working and innovating, for example within industrial clusters and by fostering best practices, sharing infrastructure in important areas like clean hydrogen and CCUS and building demand for lower-emissions products.โ€  โ€œDecarbonizing these industrial and transport sectors, which emit 40% of global greenhouse gas emissions today, is essential to achieving net zero, especially as demand for industrial products and transport services will continue to be strong,โ€

Referring to the Net Zero Industry Tracker, the WEF goes on:

According to the report, the $13.5 trillion in investments is derived from average clean power generation costs: solar, off-shore and on-shore wind, nuclear and geothermal, electrolyzer costs for clean hydrogen and carbon transport, as well as storage costsโ€. Also: โ€œcarbon pricing, tax subsidies, public procurement and development of strong business cases can support in mobilizing necessary investments. However, raising capital for high-risk projects with unproven technologies could be challenging in the current macroeconomic environment. Institutional investors and multilateral banks, therefore, can play an important role by providing access to low-cost capital linked to emissions targets; equally vital is adapting financial models to the needs of various industries and regions.โ€

Far-left environmentalists see CCUS as a scam by Big Oil to โ€œdelay the phase out of fossil fuelsโ€ โ€“ they call this greenwashing. Big Oil at the behest of their owners (not the real stakeholders) have subscribed to the net-zero nonsense to help normalize the notion that we are in a climate crisis, and that something must be done with CO2.  After all, they are going to get paid either way.

Unfortunately, citizens are left out of conversations related to carbon control policy as shown during the public process.  These decisions and laws are made at the very top in boardrooms by outside corporate interests who in some cases are not even American-owned companies. 

45Q Woes

Enacted in 2008, the Energy Improvement and Extension Act of 2008
(Division B of P.L. 110-343) introduced the 45Q tax credit for every metric ton of CO2 that is captured for utilization, permanently sequestered, or used in enhanced oil recovery (EOR). The original intent of the credit was to incentivize technology for emissions from coal-fired power plants. The tax credit was expanded again in 2018 and, more recently, expanded in the federal Inflation Reduction Act in 2022. The latest expansion extended the credit and added an enhanced credit for direct air capture (DAC).

It is all fun and games until someone gets hurt, and taxpayers and consumers are hurting over this no-good inflationary tax credit. Through 2019, taxpayers have been defrauded by nearly one billion dollars due to the 45Q tax credit. The Treasury Inspector General for Tax Administration (TIGTA) reported that out of the $1 billion in credits claimed between 2010 to 2019, nearly 90% did not comply with EPA reporting requirements. 

Taxpayers for Common Sense reports: โ€œCost estimates for 45Q have risen over the life of the tax credit. The issue brief documents that the Joint Committee on Taxation (JCT) adjusted its 10-year cost projection from roughly $1.8 billion in 2018 to $3.2 billion in 2022. A different cost estimate from the U.S. Treasure Department in 2021 put the price tag for 45Q at $20.1 billion from FY2021-FY2031, but that changed last year when the Treasury Departmentโ€™s 45Q 10-year cost estimate jumped from $20.1 billion to $30.6 billion.โ€

Others report ten-year subsidy estimates to be in the range of $50-$100 billion and will likely be significantly higher as estimates from two provided include only the electrical power sector.  With no transparency to date, and a 90% demonstrated fraud rate, The Great State of Alaska has jumped into this mess with both feet and no sign of looking back. 

Long-term Geologic Storage of CO2?

Long-term geologic storage of CO2 is unproven. The claim from the state is that Alaskaโ€™s older oil and gas basins, particularly in Cook Inlet โ€œhave the right geology to sequester carbon underground.โ€  Per Governor Dunleavyโ€™s press release on the carbon management bills โ€“ โ€œCook Inlet has been identified as one of the top spots on earth with the ability to sequester carbon underground โ€” with at least 50 gigatons of capacity.โ€ This area just so happens to be where we are having purported gas supply issues; oddly, the DNR hasnโ€™t forecast drilling past 2030.

An Institute for Energy Economics & Financial Analysis (IEEFA) study looked at two large scale carbon capture and storage projects out of Norway: Sleipner in the North Sea, and Snรธhvit in the Barents Sea. 

The report notes:

In Norway, a substantial carbon tax was the economic impetus for CCS. The primary driver of CCS for both projects was avoidance of the Norwegian Carbon Tax (1991). The price point of the tax is such that oil and gas producers, even with extensive development costs and ongoing operating costs for the CCS system, saved money by undertaking the investment. That savings margin has only grown since. Unless that fundamental cost element exists in a given market โ€“ and persists โ€“ that economic drive will be missing. It is unclear whether subsidies alone will create an equivalent result.

One could be left wondering โ€“ Are we setting up the bank for a substantial carbon tax?

These projects separate CO2 from produced gas and compress and transport the CO2 for permanent reinjection within the seafloor. Despite both locations being among the most studied geological fields in oil and gas as well as CO2 storage globally, the fields are in an unpredictable state. From the report:

In 1999, three years into Sleipnerโ€™s storage operations, CO2 had already risen from its lower-level injection point to the top extent of the storage formation and into a previously unidentified shallow layer. Injected CO2 began to accumulate in this top layer in unexpectedly large quantities. Had this unknown layer not been fortunate enough to be geologically bounded, stored CO2 might have escaped.

At Snรธhvit, problems surfaced merely 18 months into injection operations despite detailed pre-operational field assessment and engineering. The targeted storage site demonstrated acute signs of rejecting the CO2. An geological structure thought to have 18 yearsโ€™ worth of CO2 storage capacity was indicating less than six months of further usage potential. This unexpected turn of events baffled scientists and engineers while at the same time jeopardizing the viability of more than US$7 billion of investment in field development and natural gas liquefaction infrastructure. Emergency remedial actions and permanent long-term alternatives needed to be, and were, identified on short notice and at great cost.

The report continues

โ€œIn one situation, the CO2 deposited moved rapidly and unexpectedly to a previously unidentified area. In another, CO2 storage space meant for years of sequestering turned out to be insufficient. Such developments raise questions about whether two data sources the size of Sleipner or Snรธhvit are sufficient to form a reliable basis for secure storage of greenhouse gases on a scale hundreds of times their size, and do so permanently.โ€ 

They highlight that CO2ย storage has not behaved as geologists initially expected for either project.ย 

In summary, the IEEFA report states for Norway:

What is unknown is the long-term viability of any subsurface storage formation. Will the gas migrate over time? Will the formations fault or deform in ways that allow the gas to escape? Are the formationโ€™s boundaries sealed, or faulted such that the CO2 has a path to move?

The truth is that no engineer or scientist, let alone corporate executive or politician, can answer the question definitively. That is because, even using the best technology and techniques available today, the hard science is limited to statistically based expectations derived from costly and resource-intensive samples of subsurface data that are, by their nature, conjectures of what is going on underground. Subsurface assessment technologies are improving, but they likely will never provide a complete and foolproof picture of what nuances, exceptions, deviations, inclusions, or limits are above and within subsurface structures.

Here in the United States, Louisiana faces the risk of CO2 storage projects leaking through abandoned wells, noting โ€œthe depth of nearly half (46.5 percent) of abandoned wells in Louisiana is a mystery, according to the reports. Of those remaining 53.5 percent of wells with depth records, about 1,200 penetrate potential CO2 storage formations, and 896 of those wells have perforations that would allow CO2 from the formation to get inside the well. Also, 297 of those wells are unplugged, with another 15 plugged before modern standards.โ€

Their concerns go on:

I know thereโ€™s a lot of pressure to approve these permits as rapidly as possible, but along with that pressure comes a concern that there wonโ€™t be a robust review on the part of regulators,โ€ said Dominic DiGiulio, a former EPA official who helped write the agencyโ€™s rules on CO2 sequestration underground. And โ€œAside from the effects on the climate, residents and safety advocates are concerned about what happens when a CO2 well or pipeline leaks without being detected. The gas can displace air and cause people to suffocate, as happened in 2020 in Satartia, Mississippi, after a CO2 pipeline rupture sent dozens of people to the hospital. The gas is colorless and odorless, and vehicles cannot start in a CO2-saturated environment, making it difficult for people to escape if there is a rupture.

Another stunning failure in the race to sequester carbon, the worldโ€™s largest carbon reduction project is working at just one-third capacity and decreasing.  Australiaโ€™s Chevron Gorgon gas plant has already cost Chevron $3.2B and more investment is needed to allow for water to be moved to effectively store the carbon, the reason for this is to โ€œmanage the pressure in the formation and keep โ€œinduced microseismicityโ€ โ€“ or feint earth tremors โ€“ within allowed limits.โ€  Sounds like a wonderful concept for Alaska!

Who pays for these mishaps?  As a wise friend says, โ€œcorporations donโ€™t pay for taxes, consumers do.โ€ 

Back to Alaska: Bill Grade

To summarize, HB 50/SB 49 โ€“ Carbon Storage is one of the worst of the worst. There is no upside to this aside from the promised future revenues we might see from carbon schemes. This is a promise dangled in front of Alaskans as to imply we will not have investment in our state unless we capitulate to the extortion of carbon control. When was the last time you were asked as an Alaskan if you wanted to participate in a carbon reduction strategy at all, especially considering our limited footprint on the global scale?

The score for this bill in its present state is a -7.  With -9 being the worst, 0 neutral and +9 being the best in the way of freedom and liberty.  This as demonstrated in the detailed legislative scoring:

1.     Expand/Contract Government?

Does it create, expand or enlarge an agency, board or function/activity of government? Conversely, does it reduce the size/scope of government?

Score -1.  This bill increases the size of government, adding positions for a โ€œcarbon engineerโ€ and a โ€œcarbon assistantโ€. According to the fiscal note:  This bill expands existing authority and responsibilities of the Alaska Oil and Gas Conservation Commission (AOGCC) to create a regulatory structure for carbon capture, utilization, and storage (CCUS) in Alaska. This bill grants AOGCC authority to pursue primacy from the U.S. Environmental Protection Agency (EPA) over Class VI wells needed for CCUS injection and amends the general property laws of Alaska to clarify pore space ownership for private parties.

AOGCC anticipates that program management and administration may be accomplished through a combination of existing staff and contractual support. In FY2025, this program will be supported by two existing staff and existing funding added as part of SB48 which passed during the 2023 legislative session. In this fiscal note, costs for program support are included in the personal services and service line beginning in FY2026 to continue those positions and support the work associated with this legislation.

2.     Govt Free Market Interference?

Does it give the government any new/expanded power to prohibit, restrict or regulate the free market? Conversely, does it eliminate/reduce govt intervention in the free market?

Score -1.  This is free market interference.  This bill establishes the bank and the need for carbon revenue and gives no services in return.  Legislation is not required for private companies to apply for class IV well primacy โ€“ they can do this today. 

3.     Create / Remove Barriers to Enter Market?

Does it increase barriers to entry into the market?  Conversely, does it remove barriers to market entry?

Score -1.  As seen in Norway, the economic impetus for CCS was a substantial carbon tax.

At Snรธhvit, the problems they encountered only 18 months into the targeted storage site demonstrated signs of rejecting the CO2.  This was a geological structure thought to have 18 yearsโ€™ worth of capacity.  This jeopardized an over $7B investment in field development and natural gas liquefaction infrastructure.  Carbon storage serves one purpose, sequestering.  It produces no power and no oil.

4.     Increase Taxes, Fees, Etc.

Direct/Indirect increase of taxes, fees/assessments?  Conversely, does it reduce them?

Score -1.  That is all this is โ€“ a tax and a fee.  An entire industry made out of whole cloth.  According to the presentation by the Alaska Division of Oil and Gas:

โ€“       Division of Oil & Gas will charge fees for applications and licenses, and annual rentals for leases.

โ€“       Once operations begin, injection fees similar to royalties at a rate of at least $2.50 per ton will be charged.

โ€“       Fees will be collected to fund program oversight and monitoring after closure of injection facilities.

โ€“       AOGCC will assess fees to fund oversight of wells and facilities during drilling, operations, and closure.

5.     Increase Govt Spending?

Does it increase govt spending or debt?  Conversely, does it reduce govt spending/debt?

Score -1.  The 45Q is said to be the only incentive to carbon sequestration.  It is pure government spending with no services rendered.  The 45Q tax credit is a fraudulent tax credit that should have ended the minute the fraud was discovered and reported by the Treasury Inspector General.  Instead, in the response to the findings, the Department of Energy touted yet a new government entity they would stand up to โ€œdevelop a corrective action planโ€ โ€“ the Office of Clean Energy Demonstrations, (OCED) who โ€œAccelerates the market adoption of clean energy technologies and fills a critical innovation gap on the path to 100% clean electricity by 2035 and net-zero emissions by 2050.โ€  Their mission is to โ€œdeliver clean energy demonstration projects at scale in partnership with the private sector to accelerate market adoption, deployment, and the equitable transition to a decarbonized energy system.โ€

6.     Govt Growth/Displace Private Sector

Does it grow government by displacing the private sector in the market? Conversely, does it eliminate or return a function of government to the private sector?

Score 0.  At face value the bill sponsors want you to believe that this opens up a new market for private industry to achieve net zero goals, however, this new market only exists because of government subsidies that are paid for by the United States taxpayers.  Sequestration could have long term catastrophic displacement in private industry such as Cook Inlet natural gas producers due to uncertainties associated with permanent sequestration.

7.     Govt Redist. of Wealth Tax Policy Reward Special Interests

Does it increase govt. redistribution of wealth?  Tax policy to reward special interests/businesses/govt. employees.  Conversely does it decrease govt. redistribution?

Score -1.  This is taking advantage of fraudulent tax policy (45Q) and working with private industry to take money from people in return for nothing.  This is going to cost everyone the inflation on their energy which especially hurts the lower class. 

8.     Restrict Public Access to Information?

Does it restrict public access to information related to govt. activity or reduce accountability? Conversely, does it increase government transparency/accountability?

Score 0.  There is no metric for success or accountability in this legislation.  With the entire concept of carbon control being made up out of the aforementioned whole cloth, to what effect are we doing this other than to greenwash, tax and control people?  This legislation is not for the public, not from the public, not developed in public light and our legislators are trying to sell this as some benefit to the public that we all must pay for.  Our own university that we the people fund is used as a propaganda generating tool against citizens to sell it.  Governor Dunleavy made not one mention of this during his reelection campaign.  This may very well be scored -1.

9.     Violate U.S. Constitution or Alaska Constitution

Does it violate the spirit or the letter of either the U.S. Constitution or the Alaska Constitution? Conversely, does it uphold either of those constitutions?

Score -1.  Carbon control is an ideological state project of Marxist construct.  This legislation establishes the funding and viability of that Marxism.  A limited government is in direct conflict with setting up the bank for carbon.  This is the establishment of a never-ending power grab in the bottomless pit of need from the carbon industrial complex, all to no avail and to no effect to the climate.  Our forefathers never foresaw the problem we are having with the federal reserve and inflation โ€“ inflation is the mother of all taxes.  This legislation would not exist if not for inflationary fed dollars.  The IRA was written to corrupt state policies with massive subsidies and restriction on generation where we could be utilizing our own abundant resources.  This legislation is also in conflict with the Alaska Constitution Article 8 โ€“ โ€œIt is the policy of the State to encourage the settlement of its land and the development of its resources by making them available for maximum use consistent with the public interest.โ€  As indicated in the Norway fields, our natural gas production in Cook Inlet has a valuable and indeterminate geological infrastructure that we are purposely putting at risk.  Monitoring and bonding language in the bill indicate exactly that.  The notion of this bill fragrantly dismisses the future production of Cook Inlet in violation of Article 8. 

The idea of carbon control signifies the imperative for government action in managing or controlling carbon flows within politically defined limits.  While, A., Jonas, A. E. G., & Gibbs, D. (2010).

When the climate cult is not successful in changing the weather, what is next?  This is the perfect Ponzi scheme โ€“ a never ending, never winnable game with ever increasing control on economy, industry and individual freedoms.

Total Score -7

โ€”โ€”โ€”โ€”โ€“

Prior posts of Kassie Andrews, a principal at MasterResource, can be found here.

The โ€œAmazing Taleโ€ of How Three Billionaires Plunged the World into Climate Catastrophism

Do you think that the constant catastrophising of weather and climate in the mainstream media, politics and science has just appeared by accident? Over the last few years, the BBC and the Guardian, as of one mind, decided to float improbable โ€˜tipping pointโ€™ scares under cover of โ€˜scientists sayโ€™, while UN officials concluded that we had two years to save a โ€˜boilingโ€™ planet and the ubiquitous โ€˜Jimโ€™ Dale has been given free rein to make it up as he goes along on Talk TV and GB News. Of course all this didnโ€™t suddenly happen.

From The Daily Sceptic

BYย CHRIS MORRISON

Do you think that the constant catastrophising of weather and climate in the mainstream media, politics and science has just appeared by accident? Over the last few years, the BBC and the Guardian, as of one mind, decided to float improbable โ€˜tipping pointโ€™ scares under cover of โ€˜scientists sayโ€™, while UN officials concluded that we had two years to save a โ€˜boilingโ€™ planet and the ubiquitous โ€˜Jimโ€™ Dale has been given free rein to make it up as he goes along on Talk TV and GB News. Of course all this didnโ€™t suddenly happen. Each of these examples is testament to an extraordinary corruption of the true scientific process โ€“ an โ€œamazing taleโ€ according to political science writer Roger Pielke Jnr., โ€œa story of how wealth and power sought to shape climate science in pursuit of political goalsโ€.

The main culprit in this amazing tale will not be unknown to regular readers of the Daily Sceptic and it is the improbable scenario of RCP8.5. This has been promoted as a โ€˜business as usualโ€™ set of scientific, economic and societal assumptions and it suggests temperature rises up to 4ยฐC in less than 80 years. Although downgraded by the UNโ€™s Intergovernmental Panel on Climate Change of late as โ€œlow likelihoodโ€, it is still estimated to be behind about 50% of the climate modelled โ€˜impactsโ€™ highlighted over the entire scientific literature. Almost all the claims of climate Armageddon and economic disaster peddled by those identified in our first paragraph are based on RCP8.5 input. It is a tale of how three wealthy men bankrolled a project to promote an extreme scenario to guarantee that the economic impact of climate change they projected into the future would be โ€œeye-poppingly largeโ€.

It will also not be a surprise to learn that the billionaire green activist Michael Bloomberg has played a key role over the last decade in lifting this implausible pathway to underserved prominence. Notes Pielke: โ€œItโ€™s a story of privilege and conceit โ€“ the privilege in American democracy that accompanies being mindbogglingly wealthy, and the conceit that climate policies can best be pursued by corrupting the scientific literature on climate change.โ€

In 2012, three wealthy men, Bloomberg, hedge fund manager Tom Steyer and former CEO of Goldman Sachs Hank Paulson chipped in $500,000 each to fund a project โ€œmaking the climate threat feel real, immediate and potentially devastating to the business worldโ€. An early funded report was part-titled โ€˜Risky Businessโ€™ and it focused on RCP8.5 โ€œas the pathway closest to a business-as-usual trajectoryโ€. The pathway was said to be โ€œclosest to a future without concerted action to reduce future warmingโ€.

In Pielkeโ€™s view, the authors of the โ€˜Risky Businessโ€™ report made two significant methodological mistakes. They characterised the extreme RCP8.5 scenario as โ€˜business as usualโ€™ and suggested the world could move from one scenario to another.  As Pielke notes, the four different scenarios are independent with, for instance, RCP2.5 assuming a world with three billion people fewer than RCP8.5. Both of the mistaken methodological choices were said to be contrary to the appropriate use set by the people who created them.

The โ€œgeniusโ€ of โ€˜Risky Businessโ€™ was it undertook a โ€œsophisticated campaignโ€ to introduce its methodological ideas into mainstream scientific literature, โ€œwhere they would take on a life of their ownโ€. In 2016, a paper from the โ€˜Risky Businessโ€™ project was published in the prestigious journal Science featuring the erroneous notion of moving from one RCP scenario to another. Despite the obvious methodological flaw, notes Pielke, the paper passed peer-review with little or no criticism, and to date has been cited more than 1,100 times. โ€œHundreds, maybe thousands of papers followed similarly in adopting the same assumption of moving between incommensurate scenariosโ€, observes Pielke.

A year later, Science published another study from โ€˜Risky Businessโ€™ with the bizarre suggestion that the United States would see a 10% hit to its economy under the most extreme version of RCP8.5, with an incredible 8ยฐC rise in temperature by the end of the century. This prominent paper has been cited more than 1,100 times in other studies and, noted Piekle, the 10% GDP loss would become the top line conclusion of the U.S. National Climate Assessment the very next year.

โ€œPublishing papers in the academic literature based on the flawed โ€˜Risky Businessโ€™ methods was a formula that would be repeated time and time again. Like the introduction of a virus, the misleading reinterpretation of climate scenarios expanded throughout climate science,โ€ states Pielke.

The work begun by Bloomberg-Steyer-Paulson was subsequently taken up by a group called Climate Impact Lab, a collaboration of โ€˜Risky Businessโ€™ leaders and several universities. According to Pielke, Climate Impact Lab has thrived on using RCP8.5 to generate a steady series of media-friendly studies projecting extreme climate impacts. Among them are stories suggesting rising sea levels could swamp major cities and displace almost 200 million people, while a rise in climate related deaths will surpass all infectious disease. All backed, of course, by โ€˜scientists sayโ€™.

Pielke concludes that there is no hidden conspiracy โ€“ โ€œall of this is taking place in plain sightโ€. The political advocacy was โ€œabsolute geniusโ€ โ€“ a well-funded effort to fundamentally change how climate science was reported in the media, and ultimately how political discussion and policy options are shaped.

โ€œThis effort has been phenomenally successful,โ€ says Pielke โ€“ or as we might put it, complete Dale-ification of most climate and Net Zero debate has been achieved.

Chris Morrison is theย Daily Scepticโ€™sย Environment Editor.

More Ocean Temperature Data & More Diving, This Weekend โ€“ Great Keppel Island

Iโ€™m back in Yeppoon. This afternoon I was at Wreck Point, and in the distance, over my left shoulder, you can see Great Keppel Island. According to the New York Times there is mass coral bleaching there .

From Jennifer Marohasy

Byย jennifer

Iโ€™m back in Yeppoon.  This afternoon I was at Wreck Point, and in the distance, over my left shoulder, you can see Great Keppel Island.  According to the New York Times there is mass coral bleaching there (CLICK HERE).  A photograph of the corals at Monkey Beach reef featured in an article in that newspaper just yesterday.   It was apparently taken on March 5, 2024.

(Iโ€™m hoping to see these corals for myself this weekend.   To be sure to know what I find out, to be sure to see the photographs Iโ€™m hoping to take, consider subscribing for my free email updates (CLICK HERE).)

The New York Times attributes the bleaching to extraordinarily warm ocean temperatures.  Of course, there is no chart, no data โ€“ no information on actual ocean temperatures.

It is exceedingly rare for any newspaper to ever publish location specific temperature data.  In fact, that is the only real type of temperature data: location specific data.    Everything else is a construct โ€“ a contrived statistic.

The picture of the bleached corals at Great Keppel Island, published in theย New York Times,ย was apparently provided by AIMS (Australian Institute of Marine Sciences).ย  Of course, they also have temperature data.ย  One of their key weather stations is at Square Rocks just to the northwest of Great Keppel Island.ย  There is data for the period December 19, 2009, through to February 19, 2024.ย  This data, consistent with the information I have previously published for the central region does not suggest that ocean temperatures have been particularly warm this last summer.

AIMS water temperature data for Square Rock just to the northwest of Great Keppel Island measured at 2.9 and 7.9 metres depths.

(There is very little difference in the two temperature profiles at the different depths so there is much overlap in the above chart. ย For clarity I will also now post these times series separately.

There is sea level data for Rosslyn Bay, just across a little further to the east from Great Keppel Island.  (I will be catching the ferry to Great Keppel Island from Rosslyn Bay marina at the end of the week, weather permitting and passing Square Rock.)

This sea level data indicates monthly averages are towards the low end of their annual cycle, and have stalled.ย ย  This is consistent with an El Nino event and the water sloshing over to the other side of the Pacific Ocean, you can read more about the phenomenon at the NOAA website (CLICK HERE).

Monthly sea levels at Rosslyn Bay Marina, more information https://psmsl.org/data/obtaining/stations/1760.php

Could it be that the bleaching at Great Keppel Island has more to do with lower-than-average sea levels for this time of year, rather than unusually warm water?  Iโ€™m just asking the question.  (It is perhaps better to have questions that cannot be answered, rather than answers that cannot be questioned.)

Square Rock also has air temperature data, and, of course, the two move somewhat in unison except that the air is consistently a little cooler.ย ย  This is the air that has all the greenhouse gases, that is meant to be warming the ocean.

AIMS air temperature and water temperature data for Square Rock, just to the northwest of Great Keppel Island.

Of course, only someone who believes the nonsense from the experts and who canโ€™t read a chart could believe that the air warms the ocean!

The sun warms the ocean that warms the atmosphere.ย  That is what happens in the tropics at least, which is where I live.

It has been a very wet summer and so my much neglected garden is doing well. ย  It can get very dry here. ย Usually drier summers are hotter summers.

MORE INFORMATION. UPDATE 17TH APRIL 2024

Iโ€™ve looked around for more information, and found water temperature data for Rosslyn Bay, that is just across from Great Keppel Island. This time series that is collected by the Australian Baseline Sea Level Monitoring Project is twice as long, beginning in 1991, and complete for this last summer.

Consistent with the AIMS data for Square Rocks, it does NOT suggest that this last summer has been particularly warm. It shows a distinct seasonal trend; it does not show global warming.

Water temperature data for Rosslyn Bay can be downloaded at http://www.bom.gov.au/oceanography/projects/abslmp/data/monthly.shtml

Glut in Californian home-solar causes bubble to pop: sales down 75%

If solar panels were actually cheap and useful, everyone could have them, theyโ€™d pay for themselves, and there would be no point where the panel-party would grind to a halt. But if they were expensive, made something useless, and their product became toxic to the grid itself the government would have to artificially subsidize them to get them onto the grid in the first place, and then pop its own bubble before the bubble popped the grid. And so that time has arrived in California and there is carnage in the market.

From JoNova

By Jo Nova

California was the Land of Solar Panels at the top of the Magic Subsidy Tree but that boom went bust

If solar panels were actually cheap and useful, everyone could have them, theyโ€™d pay for themselves, and there would be no point where the panel-party would grind to a halt. But if they were expensive, made something useless, and their product became toxic to the grid itself  the government would have to artificially subsidize them to get them onto the grid in the first place, and then pop its own bubble before the bubble popped the grid. And so that time has arrived in California and there is carnage in the market.

The Duck has quacked

In a strange coincidence the Californian government cut the payments for solar-powered-electricity by 75% last year, and sales of solar panels fell to a quarter of what they were a year ago. Thatโ€™s a โ€œtoโ€ not a โ€œbyโ€. One in five solar contractors has already left the market. Careers and businesses โ€” gone.

The new price for solar-powered-electricity is probably slightly closer to the true market value, which is almost zero, or even less for holy-green electricity at noon. The Duck Curve is the shape the daily load curve makes. As more and more solar panels are added to the grid the demand for electricity falls at midday, but stays the same at breakfast and dinner. So the amount of electricity required for the state gradually develops a โ€œbellyโ€ at noon, and looks like a duck. As more solar panels are added, the grid ends up with too much electricity at midday, which is such a problem it has to pay someone else to use it. In a real free market, negative wholesale prices at midday should have killed off the solar panel rooftop industry years ago.

EIA

by Phred Dvorak, The Wall Street Journal

The Home-Solar Boom Gets a โ€˜Gut Punchโ€™

Nationโ€™s biggest residential solar market is tanking and installations could decline 13% nationwide, despite clean energy push

The state has installed so many panels that it has a glut of solar power during the day. Last year, California implemented new rules that cut the amount of compensation most rooftop solar owners get for the electricity they send to the grid by 75% or more to manage the oversupply and soaring costs for upgrading the grid.

Residential solar sales have dropped to a quarter of what they were a year ago, and more than a fifth of the stateโ€™s solar contractors have been laid off, according to some estimates.

โ€œIt was like getting a gut punch,โ€ says Carlos Beccar, marketing director of Fresno-based Energy Concepts, a solar installer that had to lay off more than half its 75 employees after sales plummeted as much as 90% following the new rules.

The journalists spin the solar excuses

At the same time, Californiaโ€™s solar growth is outpacing the ability of its grid to handle it.

Itโ€™s not that solar-electricity is a useless toxic byproduct of subsidies, itโ€™s that solar is so good, the grid is not ready for it. In other words, itโ€™s all your fault. You need to pay more for that grid โ€œupgradeโ€, or storage, or something so the little solar flowers can thrive.

Who knew, the job of the grid was not to supply electricity, but to โ€œabsorbโ€ the subsidy farmers:

The state already supplies more than a third of its power with renewables, and it plans to raise that ratio to 60% by 2030. But because the stateโ€™s grid canโ€™t absorb all the solar power generated during the day, it ends up throwing increasing amounts of it away or curtailing it.

Get ready, the next step is to corral us into paying more to solve the mess they created:

Part of the rationale behind the stateโ€™s new solar billing rules is to encourage households to buy batteries, which can store power for use later.

See how the planned economy works? The subsidies forced useless white elephants onto the grid. The fees to cover the costs were set so the people without solar had to pay the subsidies. So their electricity bills went up until their wallets bled, and they begged to buy solar panels โ€œbecause electricity costs had risenโ€. Then the government changed the conditions so that people with solar really needed to buy a battery โ€ฆ

More than 30% of homes in Australia have solar panels installed. In California, in 2019 apparently 44% of homes had solar panels. But as extreme as that is, California is connected to other states in the US, so it can offload the extra electricity, or upload electrical juice from other reliable generators. Australia doesnโ€™t have that option. We have to put the spare electricity in shoe boxes and float it over to Papua New Guinea.

Image byย Charlie Wildeย fromย Pixabay

Cloudy With A Chance Of Stability

I got to thinking about the clouds again. Theyโ€™re easily the least understood part of the climate. So let me start with what we do know.

Overall, clouds cool the planet. Hereโ€™s the effect of clouds on the surface.

From Watts Up With That?

Guest Post by Willis Eschenbach

I got to thinking about the clouds again. Theyโ€™re easily the least understood part of the climate. So let me start with what we do know.

Overall, clouds cool the planet. Hereโ€™s the effect of clouds on the surface.

Figure 1. Net cloud surface radiative effect. Includes the effect of the clouds on both downwelling shortwave (solar radiation) and downwelling longwave (thermal radiation from the atmosphere) at the surface.

There are some interesting things about Figure 1. First, clouds cool the planet everywhere except the poles and the deserts.

Next, over the ice-free parts of the ocean, the clouds only cool the ocean surface. No part of the ocean is warmed by the clouds.

Finally, the more clouds, the more it cools the surface. Thatโ€™s why the moist tropical areas, with their extensive cloud cover, are receiving the most cooling from the clouds.

With that as prologue, hereโ€™s a thought experiment. Suppose you could control the amount of clouds, and you wanted to create a thermoregulatory system that would stabilize the temperature of the earth. How would you go about it?

Well, it seems to me that youโ€™d want a system where if the planet started out cold, the warmer it got the fewer clouds it would have. Fewer clouds mean less cooling, and that would encourage the system to continue warming โ€ฆ

โ€ฆ but youโ€™d only want less clouds up to a certain point. Once you reached the desired temperature, then youโ€™d want the reverse to happen. Above that temperature, if it warmed further youโ€™d want more clouds, to tend to drive the temperature back down to the desired point.

So youโ€™d want the response of the clouds to look something like this:

Figure 2. Sample of the kind of cloud response that would tend to stabilize the temperature of the earth.

In Figure 2, the amount of clouds decreases as you go from freezing to about 20ยฐC. But further warming brings increasing clouds, tending to drive the temperature back down.

And to move from our thought experiment to the real world, hereโ€™s the actual relationship between cloud area and surface temperature. Iโ€™ve used only the unfrozen sea surface temperature, to avoid the complications of ice, mountains, and deserts. However, the full globe shows the same pattern, just with more scatter.

Figure 3. Scatterplot, CERES cloud cover percentage versus Reynolds OI sea surface temperature.

Note that what is shown in Fig. 3 is that the preferred temperature occurs in the tropics at around 25ยฐ โ€“ 27ยฐC. Colder than that and clouds decrease with increasing temperature. Warmer than that, and the clouds increase very rapidly, putting a cap on the tropical temperature.

In closing, there are other variables in the equation. For example, at the warm end, the clouds are composed of more and more thunderstorms, which cool the surface in a variety of ways, not just the effects on radiation.


And thatโ€™s all the fun Iโ€™m allowed to have in a 24-hour period โ€ฆ my floor-mounted gas heater died, and I need to crawl under the house, pull out the thermocouple, test it to see if thatโ€™s the problem, and if so, go to town, buy a new one, and crawl back under the house to replace it.

Do I know how to have a good time, or what?

Best to all,

w.

Antarctica Is Colder, Icier Now Than Any Time In 5000 Years. The Last Warm Period Was 1000 Years Ago.

More evidence emerges that Antarctica has undergone rapid glacier and sea ice expansion in recent centuries, in line with the long-term and recent Antarctic cooling trend.

From NoTricksZone

Byย Kenneth Richard

More evidence emerges that Antarctica has undergone rapid glacier and sea ice expansion in recent centuries, in line with the long-term and recent Antarctic cooling trend.

West Antarcticaโ€™s mean annual surface temperatures cooled by more than -1.8ยฐC (-0.93ยฐC per decade) from 1999-2018 (Zhang et al., 2023).

Not just West Antarctica, but most of the continent also has cooled by more than 1ยฐC in the 21st century. See, for example, the ~1ยฐC per decade cooling trend for East Antarctica (2000 to 2018) shown in Fig. ES1 (right).

Image Source:ย Zhang et al., 2023

According to a new study, about 6000 years ago Antarcticaโ€™s Collins Glacierโ€™s frontline was a full 1 km southwest of its current extent. The frontline advanced to todayโ€™s extent ~5000 years ago.

โ€œPrevious studies proposed that 6000โ€‰yr BP, the frontline position of the Collins Glacier was located 1โ€‰km further south west than the present, and that the current frontline was first attained at approximately 5000โ€‰yr BP.โ€

The glacier then continuously retreated south of the modern extent for another 4000 years, with peak ice loss 1000 years ago (as shown in the 1000-year โ€œProglacial lake environmentโ€ image). In the last 1000 years this glacier has rapidly re-advanced back to the glaciated extent from 5000 years ago, which is in line with the sustained cooling trend ongoing since the Medieval Warm Period.

Image Source:ย Piccini et al., 2024

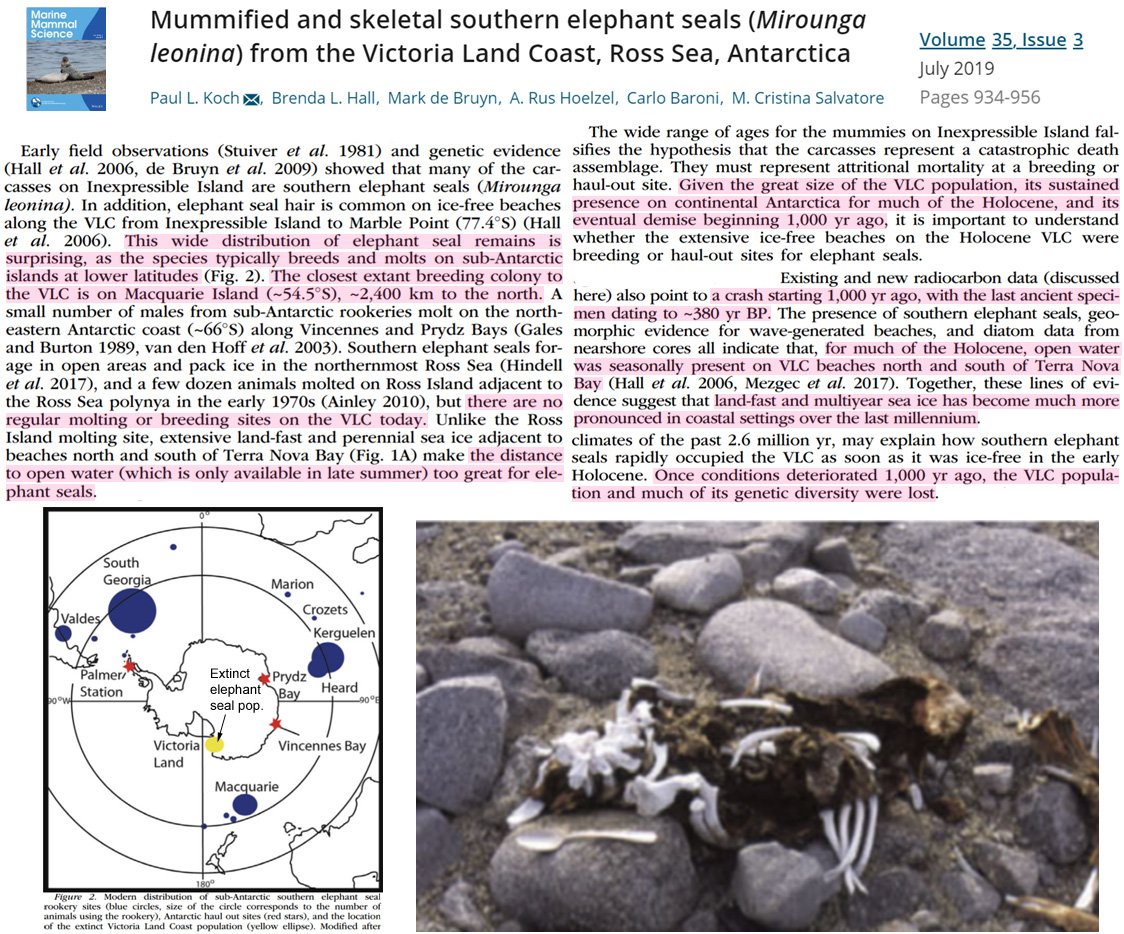
Throughout the Holocene (Medieval Warm Period, Roman Warm Period, and earlier) and until a few hundred years ago (from ~7100 to 500 years before present), coastal Antarcticaโ€™s Victoria Land (VLC) was substantially warmer than today. The Ross Sea was also sufficiently ice-free to allow for elephant seal populations (as large as ~200,000 individuals) to thrive at 73-78ยฐS.

Today, however, elephant seal populations โ€“ which require extended sea ice-free sea waters to breed, forage, and provide nourishment for their pups โ€“ can no longer subsist anywhere even remotely close to the coasts of the Antarctic continent. It is now too cold and the sea ice is too extensive.

The substantially reduced number of remaining elephant seals existing today can only survive on subantarctic islands (South Georgia, Macquarie) at southern South American latitudes (~54.5ยฐS) situatedย 2400 kilometersย north of VLC (Koch et al., 2019).

The โ€œgenetically distinctโ€ VLC elephant seal populations that endured throughout the Holocene and even through Medieval times have tragically died off in the last few centuries due to the modern-era cooling gradient and subsequent ice cover expansion (Hall et al., 2023).

โ€œAcross all sites, there is a precipitous drop in the number and geographic extent of the SES [southern elephant seals] remains within the last millenniumโ€

โ€œโ€ฆthe documented population crash and abandonment of the entire coast by SES after ~1000-500 yr BP was due to return of heavy sea iceโ€

Image Source:ย Hall et al., 2023

And with the modern sea surface temperatures cooling and southern hemisphere sea ice expansion in recent decades, even the subantarctic islands in the South Pacific that SES are limited to occupying today may not be sufficiently warm and ice-free to accommodate remaining populations. Todayโ€™s southern elephant seals are thus ironically threatened byย coolingย in the era of anthropogenic global warming.

โ€œ[P]ack-ice expansion (both duration and extent) in the Ross Sea over the last several decades has been linked to reduced female foraging in this region, consequent low weaning weights and survival of pups, and ultimately the decline of the Macquarie Island population.โ€ย 

Interestingly, Hall et al. also report that not only have the last few centuries (including the present) been โ€œthe coldest, iciest conditions in the post-glacial periodโ€ (see the blue sea ice and red temperature trend lines on the Holocene timeline), but evenย the last glacial periodย had periods (~50,000 to 25,000 years ago) with less sea ice than today, allowing SES to occupy the VLC coast.

Image Source:ย Hall et al., 2023

Saving whales started as a left-wing cause, but now conservatives are taking up the fight

Saving the whales was once a leading cause of left-wing environmental groups like Greenpeace. But offshore wind development has created an ironic twist in which conservative groups are now the loudest voices raising concerns about the North Atlantic right whaleโ€™s extinction.

From CFACT

By Kevin Killough:

Saving the whales was once a leading cause of left-wing environmental groups like Greenpeace. But offshore wind development has created an ironic twist in which conservative groups are now the loudest voices raising concerns about the North Atlantic right whaleโ€™s extinction.

The Heartland Institute, Committee for a Constructive Tomorrow (CFACT) and the National Legal and Policy Center, want to draw attention to what they say is a connection between an increase in dead whales along the East Coast and industrialization of the U.S. Coast. A new study by an independent acoustician concludes that they may be right.

Off the shores of the East Coast are plans for the development of massive amounts of offshore wind farms. Among them is Dominion Energyโ€™s Coastal Virginia Offshore Wind project, which is expected to be the largest offshore wind farm in the world.

Last month, a coalition of conservative groups filed a lawsuit against federal agencies, their top officials, and Dominion Energy, arguing the permits didnโ€™t properly assess the danger the project presents to whales. The same groups Tuesday submitted a Freedom of Information Act request for Dominionโ€™s species protection plan, which they said isnโ€™t publicly available.

Greenpeace, whose first campaign in 1973 was aimed at stopping whaling, insists that concerns about the impacts to whales from extensive offshore wind developments spreading up the East and soon the West Coast are nothing more than โ€œright-wing disinformation,โ€ and media outlets like the Associated Press and The Guardian report these concerns as โ€œunfoundedโ€ and โ€œfalse.โ€

Both the Associated Press and the Guardian have received funding from anti-fossil fuel groups in support of their reporting on climate and the environment.

Dominion spokesperson Jeremy Slayton told public broadcaster WHRO that the coalitionโ€™s lawsuit has no merits. He said that the Bureau of Ocean Energy Management (BOEM) has done a thorough review of the potential impacts to marine wildlife and the environment from the companyโ€™s project.

โ€œThe overwhelming consensus of federal agencies and scientific organizations is that offshore wind does not adversely impact marine life,โ€ Slayton told WHRO.

Dr. David Wojick, policy advisor for CFACT, told Just The News he couldnโ€™t believe the companyโ€™s statement. โ€œI use the word โ€˜absurd,โ€™ but โ€˜preposterousโ€™ is probably the right word,โ€ Wojick said.

Dominion received from the National Oceanic and Atmospheric Administration the authorization to โ€œharassโ€โ€“ in limited terms โ€” 80,000 animals over the next five years. Under federal law, offshore wind developers have to get permits, called incidental harassment authorization, to conduct activities that might threaten marine animals.

There are two types of harassment under federal law โ€” Level A and Level B. Level A has the โ€œpotential to injure a marine mammal or marine mammal stock in the wildโ€ and Level B has the same potential but could cause injury. Activities that cause these impacts are illegal, without the authorizations.

โ€œIf you chase a whale or a dolphin with your boat, theyโ€™ll take your boat,โ€ Wojick said.

New research

Robert Rand, founder of the acoustics consultancy company Rand Acoustics, is trying to draw attention to what his research is showing โ€” there is a lack of adequate protections for the whales that migrate along this corridor where all these projects are going up.

He told Just The News he gets little in the way of response from federal agencies that are overseeing the permitting for these projects.

Last year, after increases in the number of whale deaths threatened to drive the North Atlantic right whale into extinction, Rand produced an independent investigation of underwater noise levels from sonar survey vessels, which map the ocean floor for the planning of the projects.

Randโ€™s study found that the incidental harassment authorizations donโ€™t impose sufficient mitigation requirements to protect marine animals. He sent the findings off to the National Oceanic and Atmospheric Administration and the Bureau of Ocean Energy Management (BOEM). He said he never received any response.

His latest study surveyed the noise from pile driving, which is when developers drive a giant steel monopile into the seabed by pounding on it. He took sound measurements as the 5000-pound, 700-foot long pile-driving vessel Orion was driving monopiles into seabed off the coasts of Nantucket Island for the Vineyard Wind project.

Randโ€™s conclusions suggest federal agencies are underestimating the impact to whales from offshore wind development. โ€œThis investigation discovered a substantial underestimation of both impulsive and continuous noise levels by current regulatory standards, suggesting that the actual exposure to harmful noise levels from pile driving for marine mammals like the critically endangered North Atlantic right whale is substantially greater than NMFS [National Marine Fisheries Service] acknowledges in its existing protective measures,โ€ Rand wrote in his report.

Wojick, who wasnโ€™t involved in Randโ€™s research, said that the implication here is that the 80,000 estimation of โ€œharassedโ€ marine animals that Dominion is permitted for is likely a way too low.

Vessel collision

A humpback whale washed up dead Thursday on the shores of New Jerseyโ€™s Long Island Beach, Fox News reported. It was the first of 2024 in New Jersey, following 14 whale deaths in the state in 2023.

In a post on X, SaveLBI, a nonprofit coalition raising concerns about what they say are negative impacts of offshore wind development, reported a Dwarf Sperm found dead on April 4 on the beach of Sullivanโ€™s Island in South Carolina. They estimate the tally of dead whales since December 2022 is approaching 100.

Bob Stern, president of SaveLBI, in a separate post on X, called for a moratorium on offshore wind development in order for more research into the impacts of the industry to be conducted.

โ€œThese continuing whale deaths unfortunately confirm our analysis of the significant expected impact on marine mammals from the noise from these projects, starting with the vessel surveys, through the pile driving of foundations and with the higher operational noise from these larger turbines,โ€ Stern said.

Wojick said offshore wind proponents exploit the indirect way in which offshore wind development kills whales to say the two are unrelated.

In its environmental impact statement for a wind project off the shores of New Jersey, BOEM explained, โ€œIt is possible that pile driving could displace animals into areas with lower habitat quality or higher risk of vessel collision or fisheries interaction. Multiple construction activities within the same calendar year could potentially affect migration, foraging, calving, and individual fitnessโ€ฆ. The potential for biologically significant effects is expected to increase with the number of pile-driving events to which an individual is exposed.โ€

Wojick said that the projects are built, for obvious reasons, outside shipping lanes, which also happen to be the whalesโ€™ migration corridors. So, the whales impacted by pile-driving and other construction noise are going to swim to the east, where they encounter a busy shipping lane called the M-95, or they go to the west, where they encounter coastal barge traffic. He said both are deadly.

Demonstrating that a whale died when it was struck by a vessel as a result of avoiding sonar vessels or pile-driving activity is very difficult, Wojick said. As an analogy, he uses the example of a dog getting hit by a car after running into traffic to escape a firecracker thrown at it. The car killed the dog, but it was the firecracker that ultimately led to the animalโ€™s death, and nothing about the animalโ€™s injuries would point to the firecracker.

According to data from NOAA Fisheries in 2015, 33 whales were found dead on the beaches between North Carolina and Maine. The following year, the number jumped to 54, and in 2017, 89 whales were found dead. The numbers then began to decline, falling to a record low of 24 in 2022. Then, in the first six months of 2023, 48 whales were found dead along the Atlantic Coast. There are an estimated 360 right whales remaining.

Lisa Linowes, co-founder of the Save Right Whales Coalition, told Just The News in October that 2016 was when sonar vessels began mapping out the lease areas off the East Coast in preparation for the buildout of wind farms.

The Biden administration has approved eight major offshore wind projects as part of President Joe Bidenโ€™s goal of producing 30 gigawatts of offshore wind capacity by 2030.

The conservative coalitionโ€™s lawsuit argues that the Biological Opinion issued by the National Marine Fisheries Service failed to adequately analyze the impacts of Dominionโ€™s project on the endangered whales, and they are asking the court to set it aside and order a halt to work on the project.

With the media, the offshore wind industry and environmental groups denying any impacts to whales from offshore wind, it may be conservatives and independent researchers like Rand who end up saving the whales.

This article originally appeared atย Pennsylvania Daily Star

The Spectator is Right, Climate Alarmist Messaging is Harming People

A recent editorial in The Spectator claims that alarmist messaging like warnings of impending doom by climate activists and the United Nations are hyperbolic and even harmful. This is true. Data show that there is no catastrophe in store for humanity due to climate change, and studies show alarmist messaging is counterproductive and harms the mental health of people who take it to heart.

From ClimateRealism

By Linnea Lueken

A recent editorial in The Spectator claims that alarmist messaging like warnings of impending doom by climate activists and the United Nations are hyperbolic and even harmful. This is true. Data show that there is no catastrophe in store for humanity due to climate change, and studies show alarmist messaging is counterproductive and harms the mental health of people who take it to heart.

The article, โ€œThe irresponsibility of โ€˜two years to save the planetโ€™โ€ written by Ross Clark, describes the hyperbolic language used by climate alarmists, such as the concept of a climate crisis or giving humanity a countdown to disaster, and how it is counterproductive or even harmful. This discussion follows the recent claims made by the executive secretary of the United Nations Framework Convention on Climate Change, in which he stated that there are only two years left to save the planet.

Clark points out that these โ€œonly a few years leftโ€ warnings have been made repeatedly, and โ€œ[b]y my maths that means we became doomed a dozen years ago, so I was resigned to sitting back and waiting calmly for the end, like the elderly couple who sat in deckchairs on the Titanic holding hands as the ship went down.โ€

Humor aside, Clarkโ€™s perspective is shared by many, and not only among those who are skeptical of the climate crisis narrative. Climate Realism covered a trend last year in media outlets admitting that the catastrophe narrative was becoming counterproductive even to their would-be supporters, as climate โ€œdoomersโ€ began to believe that it was already too late to do anything about climate change, so why bother.

WaPo stated at the time โ€œsome scientists and experts worry that their defeatism โ€” which could undermine efforts to take action โ€” may be just as dangerous as climate denial.โ€

Climate Realism previously discussed another one of Clarkโ€™s articles, where he pointed out that โ€œif you believe that human societies are doomed anyway โ€” as 56 per cent of young people apparently do โ€” what is the incentive to cut emissions?โ€

Besides the general non-issue of climate apathy, however, there is one troubling result of catastrophizing, and that is the state of mental health among younger people. Clark talks about a 2021 study which asked students at the University of Bath between the ages of 16 and 25 questions about climate change, which found โ€œ45 per cent of people in this age group were so worried about climate change that it was affecting their day-to-day life, while 56 per cent said that they thought humanity was doomed and 40 per cent said they were hesitant to have children because they would be bringing them up in an uninhabitable world.โ€

He goes on to say that โ€œ[n]o reasoned interpretation of the evidence would say that humanity is doomed by a changing climate,โ€ which is absolutely true. Weather is not becoming more extreme, the planet is greening and crop production is growing, and issues like sea level rise are occurring at a very manageable rate.

Climate Realism has likewise addressed the fact that many peoplesโ€™ mental health are being impaired by the mediaโ€™s coverage of climate change, here, here, and here, for example. The media and alarmists spin catastrophic narratives that real world data debunk, but, unfortunately a lot of people believe the hype and donโ€™t check or follow the science.

It is always beneficial when media outlets, like The Spectator, run op-eds which provide much needed balance to the discussion. In the face of the copious evidence that no climate crisis is in the offing, it is unreasonable to be terrified or deeply distressed by climate change. It takes efforts like Clarkโ€™s to inoculate people against catastrophism with the truth.

Chinaโ€™s dangerous battery monopoly

China is positioned to adversely influence lithium-ion battery production worldwide. China has monopoly control over processed graphite, an essential component of almost all lithium-ion batteries. Virtually all processed graphite, natural and synthetic, is made in China then exported to the battery makers worldwide.

MASHAN, CHINA – MAY 28 A graphite worker walks across the Jin Yang graphite factory in the town of Mashan, China on May 28, 2016. Workers have very little safety equipment at many of the graphite factories. The northeastern province of Heilongjiang is rich in graphite and there are numerous mines and factories in the region. Locals who live in proximity to the factories complain of contaminated air and water affecting their crops and health. The graphite, which is purchased by Samsung and LG Chem, is a key ingredient in lithium batteries for mobile phones and electric cars. (Michael Robinson Chavez/The Washington Post)

From CFACT

By David Wojick

China has acquired dangerous monopoly power over battery production worldwide. CFACT has published my brief study report on this new threat โ€” โ€œCHINAโ€™S GRAPHITE MONOPOLY.โ€

To begin with, here is the Executive Summary:

โ€œChina is positioned to adversely influence lithium-ion battery production worldwide. China has monopoly control over processed graphite, an essential component of almost all lithium-ion batteries. Virtually all processed graphite, natural and synthetic, is made in China then exported to the battery makers worldwide.

These batteries are used universally in electric and electronic devices, from cell phones and watches to EVs and huge grid-scale backup batteries; there are numerous essential military uses, as well.

China is just now beginning to implement an export control program for processed graphite. By controlling exports, China could, to a significant degree, adversely influence much lithium-ion battery production, such as by raising prices to selected producers or even blacklisting entire countries.

Thus, the potential adverse impact of Chinese monopoly power is enormous. What they will actually do remains to be seen, but the threat is very real.โ€

A lot has been written about Chinaโ€™s market power in other crucial materials like cobalt and rare earths. But, these cases are weak compared to its monopoly in processed graphite.

In both cases, China is a major player, coincidentally producing about 70% of processed cobalt and 70% of rare earths. Numbers like this are nothing like monopoly control, as there are a lot of other suppliers. In fact, China consumes most of its production because it makes a lot of lithium-ion batteries. It is actually a net importer of rare earths.

In contrast, the policy world seems oblivious to Chinaโ€™s far more dangerous processed graphite monopoly. The only place I have seen it mentioned is by start-ups looking for funding to build domestic production capacity.

There is no lack of raw graphite, as China only produces about 16% of the global total. So, there would be no problem supplying domestic producers with processed graphite. The problem is that the monopoly threat does not stimulate financing because nobody knows about it.

The destructive power of unconstrained monopoly is standard text,  i.e., economics. We should be having a large, loud discussion of this threat.

To kick such a discussion off, here is the quick take from my report:

โ€œWhile no individual Chinese graphite producing or exporting firm has monopoly power, the central permitting authority does have that power if it chooses to assume it. Whether it can or not depends on the internal authority structure and policies of the Chinese government.

Given the far-reaching, potential adverse consequences of such a monopoly, it is certainly worth considering this possibility. It would amount to central planning for strategic purposes.

How monopolies assert destructive power is well-known from both theory and experience. China can easily raise prices to individual battery makers, graphite brokers, or entire countries. In particular, this export-permitting program could become part of a trade war with America, making us a likely target.

Since China is a major battery maker, it could go after its competitors. In principle, China could wipe out a rival battery maker by simply not supplying the essential graphite or it could simply raise the price to that competitor over time, which would be much harder to detect.

Whole markets might be targeted; for example, China could affect the EV market where serious competitors have existed or recently arisen in various countries. Driving up the price of an EVโ€™s battery increases the EVโ€™s price, as well. Simply driving up the price of EV batteries increases electric vehicle prices, making them uncompetitive with cheaper Chinese models.

More broadly, China produces a lot of different lithium-ion batteries, as well as devices that use them. Any of the many competitor markets could be targeted for monopoly action.

There are even geopolitical possibilities. Reportedly, many countries are looking to get into the EV battery-making business. China could force such countries to cooperate in other ways as a condition of supplying them with graphite.

If the above measures seem far-fetched, keep in mind that a monopoly in essential supplies is a very powerful position, and thus a very tempting action to take, well short of open warfare, but still very effective.โ€

Chinaโ€™s battery graphite monopoly is a clear danger to America and the world. Policy people need to start thinking about this new threat.

Californiaโ€™s Unprecedented Mega-Permadrought

Hydrological Drought, as opposed to Meteorological Drought, is the deus ex machina of California drought mongers

From Watts Up With That?

Hydrological Drought, as opposed to Meteorological Drought, is the deus ex machina of California drought mongers

I grew up in California. Since the mid 1970โ€™s the phrase โ€œbut the droughtโ€™s not overโ€ became so repetitive in state government and media communications that it was a running joke for more than four decades between my brother and I, until he finally passed away. This drumbeat began long before โ€œClimate Changeโ€ or โ€œGlobal Warmingโ€ became widespread issues of concern. The corollary to โ€œbut the droughtโ€™s not overโ€ was the proclamation by government and media every single late spring or early summer that:

โ€œBecause we had X winter, itโ€™s going to a bad fire seasonโ€

X could be dry: dehydrated conditions susceptible to easy ignition.

X could be wet: Overgrowth of brush will turbocharge fires with excessive fuel.

Hereโ€™s the conditions today vs. three years ago. Use the slider to see the difference.

https://droughtmonitor.unl.edu/Maps/ComparisonSlider.aspx

Now Letโ€™s take a walk through a decade of endless drought caterwauling.

Click here to go directly to a full overview of current conditions in California and skip the walk through the past decade.

National Geographic,ย February 13thย 2014

Two years into Californiaโ€™s drought, Donald Galleanoโ€™s grapevines are scorched shrubs, their charcoal-colored stems and gnarled roots displaying not a lick of life. โ€œIโ€™ve never seen anything like this,โ€ says Galleano, 61, the third-generation owner of a 300-acre vineyard in Mira Loma, California, that bears his name. โ€œItโ€™s so dry โ€ฆ Thereโ€™s been no measurable amount of rain.โ€

California is experiencing its worst drought since record-keeping began in the mid 19th century, and scientists say this may be just the beginning. B. Lynn Ingram, a paleoclimatologist at the University of California at Berkeley, thinks that California needs to brace itself for a megadroughtโ€”one that could last for 200 years or more.https://www.nationalgeographic.com/science/article/140213-california-drought-record-agriculture-pdo-climate

Proceedings of the National Academy of Sciences,ย March 2ndย 2015

We therefore conclude that anthropogenic warming is increasing the probability of co-occurring warmโ€“dry conditions like those that have created the acute human and ecosystem impacts associated with the โ€œexceptionalโ€ 2012โ€“2014 drought in California.https://www.pnas.org/doi/10.1073/pnas.1422385112

Of course who would quickly to appear to write about and emphasize the study noted above?

National Library of Medicine/PNAS, March 23rdย 2015

Diffenbaugh et al. (2) seem to solve that mystery in their latest assessment. As noted earlier in Fig. 1, recent years havenโ€™t just been hot and they havenโ€™t just been dry: theyโ€™ve been very hot and very dry at the same time. Climate change appears to behttps://www.ncbi.nlm.nih.gov/pmc/articles/PMC4386383/

Diffenbaugh et al. now add weight to the accumulating evidence that anthropogenic climatic changes are already influencing the frequency, magnitude, and duration of drought in California.https://www.ncbi.nlm.nih.gov/pmc/articles/PMC4386383/

increasing the likelihood of a large-scale atmospheric pattern that yields warm, dry weather in California. Thatโ€™s a double whammy when it comes to the hydrological balance that governs drought: less precipitation and more evaporation and transpiration, at the same time. Combined with the role that temperature plays in increasing the loss of water from agriculture, soils, surface water bodies, and snowpack, the authors note that 100% of the moderately dry years between 1995 and 2014 co-occurred with a positive temperature anomaly. Diffenbaugh et al. (2) note:https://www.ncbi.nlm.nih.gov/pmc/articles/PMC4386383/

NOAA/Climate.gov, August 4th, 2016

Several recent studies have found that drought conditions in California have become increasingly more intense and longer-lasting (footnote 3). Some of our research has linked this tendency to the combination of strong ENSO events and global warming (Yoon et al. 2015). Weโ€™ve found that strong ENSO events modulate Californiaโ€™s climate not only through the peak of El Niรฑo and La Niรฑa, but also their transition phases when they dissipate, and before another El Niรฑo or La Niรฑa potentially forms.https://www.climate.gov/news-features/blogs/enso/long-arm-california-drought

Of course, the rains returned for a couple of years, tamping down the doom casting a bit.

Weather.com, January 12th, 2017

The snow and rain that have pummeled California in recent days have helped to eliminate the drought in parts of northern California.

According to the Drought Monitor analysis released Thursday, all of northern California north of Interstate 80 is now free of drought. 

If this active storm pattern continues through the next couple of months, substantial drought relief is possible. But it will likely take multiple near to above-average wet seasons to completely replenish reservoirs and ground water and to end the stateโ€™s multi-year drought.

https://weather.com/climate-weather/drought/news/california-snow-rain-early-january-2017-impact-drought

But remember, itโ€™s California AND THE DROUGHTโ€™S NOT OVER!

Wired, January 22nd, 2017

Even in a wet year in California, natureโ€™s bounty of water is no longer enough to satisfy all the stateโ€™s demands, recharge overdrafted grou ndwater basins in the San Joaquin valley, or overcome the massive deficits suffered by Californiaโ€™s ecosystems and endangered fisheries. Far more water has been claimed on paper than can ever be reliably and consistently delivered to users. If the most straightforward definition of drought is the simple mismatch between the amounts of water nature provides and the amounts of water that humans and the environment demand, California is in a permanent drought.

Not long after the above article we had the Oroville Dam Crisis.

In February 2017, heavy rainfall damaged Oroville Damโ€˜s main and emergency spillways, prompting the evacuation of more than 180,000 people living downstream along the Feather River and the relocation of a fish hatchery.

Heavy rainfall during theย 2017 California floodsย damaged the main spillway on February 7, so theย California Department of Water Resourcesย stopped the spillway flow to assess the damage and contemplate its next steps. The rain eventually raised the lake level until it flowed over the emergency spillway, even after the damaged main spillway was reopened. As water flowed over the emergency spillway,ย headward erosionย threatened to undermine and collapse the concreteย weir, which could have sent a 30-foot (10 m) wall of water into the Feather River below and flooded communities downstream. No collapse occurred, but the water further damaged the main spillway and eroded the bare slope of the emergency spillway.

https://en.wikipedia.org/wiki/Oroville_Dam_crisis

AccuWeather, January 29th, 2018

You can trace this multi-year drought back to 2011,โ€ Andrews said.

Despite plenty of rain and snowfall last winter, which ended the stateโ€™s five-year drought, it wasnโ€™t enough to keep drought conditions from quickly coming back.

Over 54 percent of California is experiencing abnormally dry conditions, while just over 12 percent of the state is under moderate drought conditions, according to the United States Drought Monitor.

โ€œThat is very worrisome for the regionโ€™s water supply and fire danger,โ€ Andrews warned.https://www.accuweather.com/en/weather-news/persistent-dryness-worrisome-for-southern-california-as-drought-water-supply-shortage-issues-loom/352613

Bloomberg , January 17, 2019

Californiaโ€™s wildfire season used to last a few months. Now the state burns all year.

Global warming has intensified Californiaโ€™s cyclical droughts, leaving the land riddled with pockets of dry brush that persist even amid winter rains.https://www.bloomberg.com/news/articles/2019-01-17/california-fires-burn-all-year-as-drought-left-state-a-tinderbox

Science, April 17th, 2020

A trend of warming and drying

Global warming has pushed what would have been a moderate drought in southwestern North America into megadrought territory. Williams et al. used a combination of hydrological modeling and tree-ring reconstructions of summer soil moisture to show that the period from 2000 to 2018 was the driest 19-year span since the late 1500s and the second driest since 800 CE (see the Perspective by Stahle). This appears to be just the beginning of a more extreme trend toward megadrought as global warming continues.https://www.science.org/doi/full/10.1126/science.aaz9600

The Guardian,ย January 7th, 2021

A creeping trend

Drought is not unnatural for California. Its climate is predisposed to wet years interspersed among dry ones. But the climate crisis and rising temperatures are compounding these natural variations, turning cyclical changes into crises.https://www.theguardian.com/us-news/2021/jun/07/california-drought-oregon-west-climate-change

CAL MATTERS, May 18thย 2021

Changing climate is supercharging southwestern droughts

According to the 2020 study in Science cited earlier, human-caused climate change made southwestern drought conditions between 2000 and 2018 about 46% more intense than they would have been naturally, โ€œpushing an otherwise moderate drought onto a trajectory comparable to the worst [U.S. southwest] megadroughts since 800 CE,โ€ the heyday of the Mayan civilization.https://yaleclimateconnections.org/2021/06/california-americas-garden-is-drying-out

CAL MATTERS, September 28thย 2022

Conditions are shaping up to be a โ€œrecipe for droughtโ€: a La Niรฑa climate pattern plus warm temperatures in the Western Tropical Pacific that could mean critical rain and snowstorms miss California, according to Daniel Swain, a climate scientist with UCLA and The Nature Conservancy. 

โ€ฆ

โ€œOne thing that is unfortunately becoming easier to anticipate are warmer than average conditions due to climate change,โ€ Swain said.ย 

https://calmatters.org/environment/2022/09/california-drought-likely-to-continue/

Then rainy winters return.

BUT THE DROUGHTโ€™S NOT OVER!

NPR March, 23rdย 2023

Californiaโ€™s groundwater drought is still bad

When Californiaโ€™s reservoirs declined, many cities and farmers turned to another water source: vast aquifers underground.

In drought years, groundwater has supplied up to 60% of Californiaโ€™s water. But the pumping has been largely unregulated. So over the decades, water levels have fallen dramatically in Californiaโ€™s aquifers. Before this winter, some groundwater wells were at the lowest points ever recorded. Thatโ€™s because in the Central Valley, groundwater hasnโ€™t been replenished after previous droughts.

โ€œGroundwater is the dark matter of the hydrologic cycle,โ€ says Graham Fogg, professor emeritus of hydrogeology at the University of California Davis. โ€œThe fact that these are such huge volumes of water allows them to take a lot of abuse and to be depleted year after year.โ€

https://www.npr.org/2023/03/23/1165378214/3-reasons-why-californias-drought-isnt-really-over-despite-all-the-rain

https://www.npr.org/2023/03/23/1165378214/3-reasons-why-californias-drought-isnt-really-over-despite-all-the-rain

Then finally, some โ€œexpertsโ€ admit itโ€™s wet.

Accuweather, March 4thย 2024

n the wake of a biblical blizzard that unloaded nearly 100 inches of snow on California, AccuWeather is making a major announcement: California will be free of widespread drought through at least 2025.

โ€œThe combination of the abundance of rain and snow from the winter of 2022-2023, the state of the reservoirs, and what has happened this winter gives a high confidence that drought conditions will remain absent in California well into 2025,โ€ AccuWeather California Weather Expert Ken Clark said.https://www.accuweather.com/en/weather-forecasts/california-to-stay-drought-free-through-2025-following-2-winters-of-epic-storms-accuweather-experts-say/1627328

Current California Conditions

Taking another look at the current USDM map of California

https://droughtmonitor.unl.edu/Maps/ComparisonSlider.aspx

Iโ€™ve been watching this for the last month or two and the producers of this map are having trouble letting go of those little bits of yellow. They are clinging for dear life. It might surprise readers to know that this map is a subjective judgement, not an objective measure.

The map is made by people, not computers

The USDM map provides a โ€œsnapshotโ€ of current conditions. Authors build upon the previous weekโ€™s map, identifying areas that might have changed in response to recent weather patterns. They bring together the physical climate, weather and hydrology data and reconcile that with local expert feedback, impact reports and conditions observations. The author is also responsible for weighing different indicators based on whatโ€™s most appropriate for a particular place and time of year. In the West, for example, winter snowpack has a stronger bearing on water supplies than in the East.

โ€ฆ

To determine drought intensity, USDM authors use a convergence of evidence approach, blending objective physical indicators with insight from local experts, condition observations and reports of drought impacts. It is this combination of the best available data, local observations and expertsโ€™ judgment that make the U.S. Drought Monitor more versatile than other drought measures. Learn more with our convergence of evidence tutorial.https://droughtmonitor.unl.edu/About/WhatistheUSDM.aspx

Because there is no blue, purple, or green indications on the Drought Monitor for excessively wet conditions, even if all of California was flooded, the most this map would ever show is white. It does not give an objective centered overview of the water state of the state.

The Current Snow Water Equivalent

Snow water equivalent (SWE) is defined as the depth of water that would result if the entire snowpack was melted. It represents the amount of liquid water contained within the snowpack, regardless of the actual depth or density of the snow. The significance of SWE is that it provides a standardized measure of the water content in snow, which is crucial for several water resource management. SWE data is used by water managers to estimate spring runoff and plan for water supply, irrigation, and hydropower generation.

And here is the current SWE for California. Not a record, but still 112% of average

https://cdec.water.ca.gov/snowapp/swcchart.action

The Current State of California Reservoirs

https://cdec.water.ca.gov/snowapp/swcchart.action

The Hydrological Conditions

Hydrological Drought, as opposed to Meteorological Drought, (precipitation below normal) is the deus ex machina of drought mongers as noted in one of the above article quotes.

Hydrological Drought is defined by deficiencies in surface and subsurface water supplies, such as low stream flows, reduced reservoir and lake levels, and declining groundwater tables. Hydrological Drought lags meteorological drought as it takes time for precipitation deficiencies to manifest in the water supply. In this way, poor water management can lead to a permanent crying of drought, for example when Central Valley farmers are forced to over-pump because the state sends water out to sea for environmental justifications.

In a series of strongly worded letters, nearly a dozen legislators โ€” many from drought-starved agriculture regions of the Central Valley โ€”have implored state and federal officials to relax environmental pumping restrictions that are limiting the amount of water captured from the delta.

โ€œWhen Mother Nature blesses us with rain, we need to save the water, instead of dumping it into the ocean,โ€ Assemblymember Vince Fong (R-Bakersfield) wrote in a letter to Gov. Gavin Newsom.https://www.latimes.com/california/story/2023-01-20/anger-flares-as-california-stormwater-washes-out-to-sea

Nevertheless, two years of solid rain and snow have had a huge effect on the groundwater conditions in California, despite farmers being forced to rely on wells for decades due to the water policies of the state government.

Far more monitoring wells are currently above normal and more wells are at all time highs than those at all time lows.

https://storymaps.arcgis.com/stories/b3886b33b49c4fa8adf2ae8bdd8f16c3

(back to the walk through time)

But remember, this is California annnnnddddโ€ฆ..

THE DROUGHTโ€™S NOT OVER!!!!