Global warming, climate change, all these things are just a dream come true for politicians. I deal with evidence and not with frightening computer models because the seeker after truth does not put his faith in any consensus. The road to the truth is long and hard, but this is the road we must follow. People who describe the unprecedented comfort and ease of modern life as a climate disaster, in my opinion have no idea what a real problem is.
Falling between two stools? Backsliding on banning gasoline vehicles and green targets is enough to upset greens, but not enough to alleviate the green energy bill pain of ordinary Britons.
Falling between two stools? Backsliding on banning gasoline vehicles and green targets is enough to upset greens, but not enough to alleviate the green energy bill pain of ordinary Britons.
Sunak has ‘set Britain back’ on net zero, says UK’s climate adviser
Chris Stark, head of the Climate Change Committee, says Tories’ decision to dilute key green policies has had huge diplomatic impact
Rishi Sunak has given up Britain’s reputation as a world leader in the fight against the climate crisis and has “set us back” by failing to prioritise the issue in the way his predecessors in No 10 did, the government’s green adviser has warned.
Chris Stark, the outgoing head of the Climate Change Committee (CCC), said that the prime minister had “clearly not” championed the issue following a high-profile speech last year in which he made a significant U-turn on the government’s climate commitments. The criticism comes after Sunak was accused of trying to avoid scrutiny of Britain’s climate policies by failing to appoint a new chair of the CCC.
…
“It was presented to the country as a step back from going too fast on this transition,” Stark told the BBC. “In the speech itself, he talked a lot about the need to reappraise lots of the steps that take us to net zero. I think it set us back. I think we have moved from a position where we were really at the forefront, pushing ahead as quickly as we could on something that I believe to be fundamental to the UK economy, fundamentally beneficial to the people living in this country, whether you care about the climate or not.”
Bringing energy price relief to ordinary people could actually claw back support for the British Conservatives.
Going pedal to the metal on the green transition could restore the faith of green supporters.
Trying to find a green policy compromise, where no compromise is possible, just upsets everyone, and will lead straight to the electoral disaster which the out of touch British Conservatives so richly deserve.
Multiple media outlets, including the BBC and Reuters, claim that a recent West African heatwave would be “impossible” without global warming. This is claim is misleading and not supported by real-world data. The study cited in both articles is merely an attribution modelling study, which is not proof of the influence of climate change.
Multiple media outlets, including the BBC and Reuters, claim that a recent West African heatwave would be “impossible” without global warming. This is claim is misleading and not supported by real-world data. The study cited in both articles is merely an attribution modelling study, which is not proof of the influence of climate change.
In their article on a recent heatwave in West Africa and the Sahel, Reuters reports “[t]emperatures soared so high in Mali and Burkina Faso they equated to a once in 200-year event, according to the report on the Sahel region by World Weather Attribution (WWA).”
Reuters continues: “The severity of the heatwave led WWA’s team of climate scientists to conduct a rapid analysis, which concluded the temperatures would not have been reached if industry had not warmed the planet by burning fossil fuels and other activities.”
One of World Weather Attribution’s statisticians even went so far as to say that heat waves of that intensity wouldn’t happen at all in the region in a “pre-industrial climate.” This claim is utterly unfounded, as those parts of Africa are known for being at least semi-arid, subtropical, and prone to drought and heatwaves. While temperature records are not very lengthy or complete for many parts of Africa, April is known to be the hottest month of the year for Burkina Faso in particular, and many parts of the Sahel region in general, where temperature maximums on average are above 40°C – which is what the recent heatwave brought, meaning there is not justification for claiming the recent heatwave is historically unprecedented.
Climate Realismhas frequently noted that WWA’s “rapid attribution” studies are more in the realm of fantasy than fact, as they depend on virtual models of climate conditions that do not actually exist in real life. The model of the climate that an event like the recent Sahel heatwave is compared against is one which represents how the scientists guess things would have been had it not been for the burning of fossil fuels. All of their modelling begins with the unscientific assumption that any given weather event WAS influenced in a dangerous direction by climate change. It proves absolutely nothing, because the “control group” is entirely fictional.
The BBC produced a slightly more balanced story, acknowledging that other climate experts say that El Niño is mostly to blame for at least some of the bad weather in Africa this year. Despite spending the vast majority of the article linking the heat wave to climate change, as Reuters does, the BBC at least acknowledged, “[a] separate study on drought in Southern Africa said El Niño was to blame, rather than climate change.”
So, as the Daily Sceptic pointed out in reporting on the BBC’s coverage, “… the headline could have read: Southern African drought “impossible” without El Niño. But it didn’t.”
El Niño has a wide range of effects that are often delayed in hitting Africa, lately it has been causing heatwaves and rainfall in cocoa producing countries like Ghana, which is acknowledged in other articles having to do with cocoa bean production.
In another Climate Realismpost about cocoa production, H. Sterling Burnett also points out that this kind of weather is normal for the region, writing “across the region making up West Africa, it is common, not rare, for it to have heatwaves and heavy rains, interspersed with periods of drought.” He points out that “wet heatwaves” are not uncommon.
Once again, attribution science is hardly science and proves nothing about climate change. It certainly can’t determine whether human activities caused or even contributed to any given weather event. All of this is speculative at best. Frankly the enthusiasm with which supposed journalists and prominent media outlets embrace attribution modelling studies with no questions or skepticism whatsoever is an embarrassment to the profession. The BBC and Reuters ought to know better, and they should brush up on the facts before hyping scare-stories.
Southern Africa has had very low precipitation over the last few months – which is the end of their summer. November through March, are the rainy season bringing 75% of the precipitation for the year, but even then, compared to elsewhere, they are dry-ish. As happened last year, when it does rain, it floods.
Dried maize corn plants grow in a drought affected field operated by farmer Ryan Matthews in Lichtenburg, North West Province of South Africa, on Friday, March 20, 2015. The worst drought since 1992 in South Africa, the continent’s biggest corn producer and traditional supplier of its neighbors, has damaged plants, with the nation predicting a 32 percent drop in the 2015 harvest to the smallest in eight years. Photographer: Waldo Swiegers/Bloomberg
Southern Africa has had very low precipitation over the last few months – which is the end of their summer. November through March, are the rainy season bringing 75% of the precipitation for the year, but even then, compared to elsewhere, they are dry-ish. As happened last year, when it does rain, it floods.
“The rains this year began late and were lower than average. In February, when crops need it most, parts of Zimbabwe, Zambia, Malawi, Angola, Mozambique and Botswana received a fifth of the typical rainfall.That’s devastating for these largely agrarian countries, where farmers rely entirely on the rains”. [ source ]
The year before was particularly wet, leaving vast areas of mud still sticky, in some cases leading to free ranging cattle to get stuck in the mud seeking water.
This type of meteorological drought, simply less, or lack of, precipitation is particularly hard on subsistence farmers who depend on rain-fed crops for their livelihoods and to feed their animals and their families.
Caveat: OXFAM is terrific at raising money and public awareness of human suffering in many parts of the word, but it is an advocacy organization prone to exaggeration to achieve its ends. The linked article from OXFAM makes the claim: “Since October 2022, the cholera outbreak – which experts attribute to climate change – has killed more than 3,000 people and affected over 130,000 in Malawi, Mozambique, Zambia and Malawi.” Climate Change does not cause cholera. According to the CDC: “Most cases [of cholera] continue to occur in resource-limited settings that have unsafe drinking water, poor sanitation, and inadequate hygiene. The African continent has the highest case fatality rates. About 1.3 billion people are at risk of cholera in countries where local transmission occurs. …. Global Cholera Challenges:Large population migrations into urban centers in developing countries are straining existing water and sanitation infrastructure and increasing disease risk. Epidemics are a marker for poverty and lack of basic sanitation.”
It is no surprise that southern African nations are experiencing yet another drought – a brief check of news stories for hunger, famine, drought, and flooding in southern Africa return far too many results to be counted. Each of those adverse weather and social conditions are the norm not the exception. The actual causes are also far too many to list but conflict, lack of development, less stable governance, and increasing populations without increasing affluence drive vulnerability to weather variations.
The highlight of this story is the report [.pdf] from the so-called World Weather Attribution (WWA) group that operates out of the Imperial College London. WWA states its purpose is to “To encourage actions that will make communities and countries more resilient to future extreme weather events, WWA studies also evaluate how existing vulnerability worsened the impacts of the extreme weather event.” In short, their job is to show that weather is caused by climate change, but only bad weather. Good weather is natural variability.
In an astonishing turn of events, and much to the dismay and disappointment of the team assigned to evaluate the drought and impending famine in southern Africa, they were unable to blame climate change for this disaster. Even worse, they had to admit that climate change made the drought less likely. Some excerpts from the report titled: ”El Niño key driver of drought in highly vulnerable Southern African countries”:
“Multiple drivers contributed to the currently high, and rising, food insecurity and malnutrition levels including several years with high food prices, ongoing recovery from floods, as well as agricultural pests and diseases.”
“High deforestation rates are a major driver of environmental degradation across the countries, exacerbating risk and impacts associated with drought.”
Using four different observational data products we find that droughts such as this one are expected to happen in today’s climate about once every decade. However, when we consider the effect of El Niño, we find that these droughts are twice as likely to occur in El Niño years. Thus El Nino is a key driver of the 2024 event.
To analyse the role of human-induced climate change we first looked at the relationship between global warming and rainfall anomalies in observation-based data products. We find that as global temperatures increase, rainfall in DJF also increases. This means that in the current climate, with 1.2ºC warming, droughts such as this one are actually less likely than in a cooler, pre-industrial climate. This finding is consistent with previous studies that show wetter conditions in DJF that contrast with drying in the region earlier in the season, between the months of September and November).
In summary, our analyses show that El Nino significantly increases the likelihood of such a drought to occur, while climate change did not emerge as the significant driver influencing assessed drought in the affected countries.
So, it is business as usual in southern Africa, not the flood this time, but the drought, and the resulting hunger and social breakdown. Millions of dollars in aid are required to ease the suffering, yet again.
And kudos to the WWA team that produced an honest report.
# # # # #
Author’s Comment:
Hunger and famine are seldom caused by the weather – but rather by grinding poverty and lack of development. Families that have what most readers here would easily refer to as “nothing” can be ruined by a single crop failure. If you are thinking of donating funds to help relieve the suffering there, pick you charities carefully.
Some charities spend almost 90% of funds on actual programs that help people. Some charities are the reverse, spending 80% on fundraising. My wife and I worked with a church-based group that spent 100% on programs that actually helped people in need, with our church itself covering all of the administrative and other costs.
It was refreshing to see a report from the WWA group that pointed out that climate change would make things better in southern Africa.
An article written by Andrew Freedman, titled “Dubai’s record-shattering “rain bomb” has clear climate change ties,” published April 17th, in the online news website AXIOS makes the claim that record rainfall received in one day in the city of Dubai United Arab Emirates (UAE), has a clear connection to climate change. This is false.
An article written by Andrew Freedman, titled “Dubai’s record-shattering “rain bomb” has clear climate change ties,” published April 17th, in the online news website AXIOS makes the claim that record rainfall received in one day in the city of Dubai United Arab Emirates (UAE), has a clear connection to climate change. This is false. Not only is AXIOS conflating weather events with long term climate change, other evidence suggests this was little more than a rare weather event, which has happened before according to weather history for the area, and weak city drainage infrastructure was unable to handle the excess water.
The article notes the heavy rainfall and poor drainage stating:
At least two years’ worth of rain, or about 6.26 inches, fell in just 24 hours, qualifying as what have come to be known colloquially as “rain bombs” for their ultra-heavy totals in such short periods of time.
This amount of rainfall in a single day would cause problems even in more temperate locations, let alone Dubai, a desert city with poor drainage.
With over 6 inches of rain in a short time in a desert city that is not known for having infrastructure designed for large amounts of rain, it is not at all surprising that the drainage infrastructure could not handle an event like this, leading to street flooding. Freedman’s article goes on to say that the heavy rainfall event was forecasted by weather models:
The proximate cause of the flooding was a slow-moving and potent area of low pressure, or cold pocket of air aloft, that sparked complexes of severe thunderstorms over the United Arab Emirates and nearby countries on Tuesday.
This storm system, along with the threat of heavy rainfall, was shown by weather models several days in advance.
That is certainly true, for example in Figure 1 below, the ECMWF weather model output for April 16th shows significant rainfall for the area, with forecast color zones in excess of 6 inches.
Figure 1 – Forecast rainfall for the UAE on April 16th, source: weathermodels.com
Since the forecast showed significant rain over the area, UAE’s cloud seeding program apparently was put into action according to this article on Newsable:
Since the 1990s, the United Arab Emirates (UAE) has been actively engaged in cloud seeding efforts, overseen by the National Center of Meteorology (NCM). This government agency manages the country’s Rain Enhancement Program, utilizing a network of numerous weather stations to closely monitor atmospheric conditions for seeding operations.
Ahmed Habib, a specialist meteorologist at NCM, revealed to Bloomberg that seeding planes conducted seven missions over two days leading up to the heavy rainfall that inundated parts of the desert nation.
It seems like a simple case of a rare and intense short-term rainfall event, possibly juiced by cloud seeding. Since short-term weather models were used to forecast it, climate does not enter the picture. Long-term climate models could not have forecasted such an event because it is well below their time-scale of years to decades ahead.
Where Freedman’s article goes off the rails is with this claim:
Instead, climate science studies and observations around the world show that extreme rainfall events like this, including ones that break all-time records, are becoming more common and severe as the planet warms.
Moisture from the warm Persian Gulf fed into the thunderstorms in this case.
In fact, increased hydrological extremes, in both the form of drought and heavy rains, are one of the most robust ties to human-caused climate change, which is reshaping global weather patterns.
Freedman’s conflation of a single day weather event with long-term climate is his first error. Weather is not climate. Further, his claim on hydrological extremes is baseless, because the latest scientific report from Intergovernmental Panel on Climate Change (IPCC) shows clearly that there is no linkage to climate change at all. Figure 2 shows Table 12.12 on Page 90 – Chapter 12 of the UN IPCC Sixth Assessment Report. Emergence of Climate Impact Drivers (CIDs) in time periods shows this. The color corresponds to the confidence of the region with the highest confidence: white colors indicate where evidence of a climate change signal is lacking or the signal is not present, leading to overall low confidence of an emerging signal.
The section on heavy precipitation is highlighted in yellow. Note that the white spaces in the table for heavy precipitation indicate that such events have not emerged in the present, nor are they expected to emerge by 2050 in the context of long-term climate change. See the key at the bottom for the meaning of all colors.
Figure 2 – Table 12.12 | on Page 90 – Chapter 12 of the UN IPCC Sixth Assessment Report. Emergence of Climate Impact Drivers (CIDs)
Obviously, climate science does not support the claims made by Freedman and AXIOS about Dubai rainfall and flooding.
This shameful rush to judgment blaming climate change in the media is part of a pattern we have observed time and again here at Climate Realism. Almost without fail, when there is some oddball or unique weather event anywhere in the world, climate alarmists and the media immediately rush to blame it on climate change whether they have any facts to support it or not. Such behavior is irresponsible journalism.
In the 2020s, we live fairly comfortable lives here, my fellow villagers and I. Our hearths are warm, our command over economic goods excellent. We live long, safe lives where nobody starves and where almost nobody perishes in outbursts of nature’s wrath. We use machines—constructed far, far away using materials we don’t have, that run on fossil fuels that these lands don’t contain—to move away the snow that frequently and predictably lands on our doorsteps and otherwise would have made our roads impassable and our houses prisons.
I live in a small village at the edge of lands surrounded by very harsh nature. Those who occupied these valleys in ages past lived ruthlessly dangerous lives, where starvation was a constant worry, the sea just as often nurtured as it took away, and the winters were long and perilous. Nowadays, while I’m walking the desolate mountains or admiring the fierce storms from inside my nice, sheltered existence, echoing in my head is Thomas Hobbes’s descriptions of man’s precivilizational life: “Solitary, poor, nasty, brutish, and short.”
In the 2020s, we live fairly comfortable lives here, my fellow villagers and I. Our hearths are warm, our command over economic goods excellent. We live long, safe lives where nobody starves and where almost nobody perishes in outbursts of nature’s wrath. We use machines—constructed far, far away using materials we don’t have, that run on fossil fuels that these lands don’t contain—to move away the snow that frequently and predictably lands on our doorsteps and otherwise would have made our roads impassable and our houses prisons. We use different machines—constructed far, far away using materials we don’t have, that run on fossil fuels that these lands don’t contain—to get ourselves out of our valley and transport goods and services back, including exotic fruits and vegetables that never grow here (certainly not in winter!).
It truly is fascinating to behold the astonishing things that globalized trade and capitalism can accomplish. Stepping back and thinking about the miracles of modern trade, innovation, and division of labor is so humbling.
Yet we well-off moderns worry about our collective existence to the point that kids have nightmares, and survey respondents overwhelmingly say climate change will end the human race. Something like one-third of young people say they don’t want kids for fear of worsening the climate condition or how they’d fare in that brave, new world. “Climate anxiety is widespread among youth,” reportsNational Geographic. “How can we help kids cope with ‘eco-anxiety’?” asks the British Broadcasting Corporation. The vast majority of respondents in a global ten thousand–person study published in the Lancet in 2021 admitted to being very or extremely worried. Vox writers worry about the ethics of raising children. A new study, reported on by Phys.org, pointed to how many young people won’t have kids because of climate change: it’d be unfair to “bring a child into the world,” who’d have to live with the constant “feeling of impending doom, every day, for their whole life,” says one interviewed would-be parent.
Many of my fellow villagers entertain all these global ideas—melting glaciers and parts per million–numbers, floods, and ethical dilemmas about us vulgar humans making earth inhospitable or uninhabitable.
It’s a strange thing to worry about obsessively while the vicious storm raging outside the double-glazed windows affects nothing about our food supply, electricity use, heating, or ability to participate in the global division of labor—whether in our offices or remotely via high-speed internet. It somehow seems contradictory to passionately rally against capitalism from the comforts of very capitalistically built and maintained houses, hotels, and pubs to inveigh against the burning of fossil fuels that literally keeps one alive.
It has me thinking about the action axiom, the starting point of Ludwig von Mises’s praxeology and the pillar-stone upon which Austrian economics rests. The colloquial version of this foundational Austrian maxim is “put your money where your mouth is” or “actions speak louder than words”. We demonstrate by our actions where our preferences and values lie; we reveal them to the world (act them into existence, really) when we do one thing instead of another, when we purchase one good instead of another, when we work instead of relax. All of this is wrapped in uncertainty and hopes and subjective human desires trading off against other such desires; in hindsight, we can regret the choices we made. Still, says Murray Rothbard, a man’s “preferences are deducible from what he has chosen in action.”
Perhaps all this climate complaining is simply virtue signaling, in a world where feelings matter more than facts. The detachment from the physical processes of basic living—energy, materials, transportation, and in complicated monetary economies, money—has made many people ignorant, taking for granted the lifestyles we live and the standards of living we have. It has allowed us to start thinking foundational and civilization-carrying systems like money, fossil fuels, or commercial institutions are optional—a mere matter of ideological choice between good and evil people. They’re not.
I’m reminded too of luxury beliefs, a somewhat hyped concept coined by Rob Henderson, a psychologist at the University of Cambridge and author of the recent book Troubled. Henderson transfers Thorstein Veblen’s “conspicuous consumption”—the purchasing of expensive, often seemingly useless goods, with the purpose of flaunting one’s wealth—to the moral and political domain. A luxury belief, like a conspicuous good, is acquired in order to impress others, and is designed to “confer status on the upper class at very little cost, while inflicting costs upon the lower classes”.
Luxury beliefs don’t make much sense and don’t have staying power in the real world of atoms and temperature, of nature and starvation. But we’re so far detached from the world that physically supports us—so rich, so deluded, so well-off—that we’re willing to believe (and by extension willing to experiment with) the very systems that uphold our existence.
Cue environmental concerns and anticapitalism. Taken literally, enacting policies based on such follies into place, we’re on a path to horror and poverty, with brutish and short lives to follow.
The good news is that those systems are remarkably resilient and these voices might still be all “tawk,” as Nassim Taleb would say.
The popular energy-finance Substack Doomberg made a similar observation in February, listing two paragraphs’ worth of major events that happened from 1971: oil crisis, Iran-Iraq, Kuwait wars, Middle Eastern conflicts, the Asian and peso and ruble financial collapses, the terrorist attacks, Libya-Syria-Ukraine, the global financial crisis, and COVID. Through all of them, as tumultuous as they seemed at the time and as relevant as they remain in the political consciousness, the world’s total energy consumption is a straight line through all of it. Here’s their graph:
BP Statistical Review global total energy consumption
Socioeconomic events as radical as women’s rights or racial equality; left-wing or right-wing leaders; crises and recessions, inflations and boom years; generations of scholars and scientists and political movements . . . and there’s no impact on the basic thing that powers our civilization.
Eighty-five percent of the globe’s primary energy consumption comes directly from fossil fuels—the same it was over thirty years ago when I was born. You can speak beliefs about climate change, about noncredible, net-zero policy goals (always with years suspiciously ending in zero or five), about reducing reliance on fossil fuels, or about how “clean” renewable energy is. You can throw government money at it, pass laws, or pontificate in the high courts, legislative auditoriums, or the public square, but you’re just not changing that. You can’t change that.
According to a recent article from Politico, New York State has decided not to move forward with three major offshore wind-energy projects. This decision came after General Electric Vernova (GE.N) altered the turbine design, which the state said “materially altered” the original plans.
According to a recent article from Politico, New York State has decided not to move forward with three major offshore wind-energy projects. This decision came after General Electric Vernova (GE.N) altered the turbine design, which the state said “materially altered” the original plans.
NYSERDA, the state authority in charge of the deals, announced Friday that no final agreements could be reached with the three projects that received provisional awards in October 2023. Those bids were all linked to major supply chain investments by General Electric and a larger turbine it planned to build that was aimed at boosting the region’s renewable energy portfolio.
“Subsequent to the provisional award announcement, material modifications to projects bid into New York’s third offshore wind solicitation caused technical and commercial complexities between provisional awardees and their partners, resulting in the provisionally awarded parties’ inability to come to terms,” NYSERDA wrote in an announcement.https://www.politico.com/news/2024/04/19/new-york-offshore-wind-canceled-00153319
This development is a significant setback for New York’s renewable energy goals, as the state aims to achieve 70 percent renewable energy by 2030. The projects were provisionally awarded in October 2023 but failed to reach final contract agreements due to “technical and commercial complexities” that arose after GE Vernova’s change in turbine design.
In February, POLITICO’s E&E News reported that GE didn’t plan to move forward with an 18 megawatt turbine. NYSERDA confirmed that was the main reason no final awards were made. A smaller turbine means a project would need more individual turbine locations to deliver the same power — and the costs would have been higher.
NYSERDA had also tentatively awarded $300 million to GE Vernova and LM Wind Power for investments in nacelle and blade manufacturing at new facilities along the Hudson River near Albany. That money will be made available through a new competitive solicitation, according to the authority.https://www.politico.com/news/2024/04/19/new-york-offshore-wind-canceled-00153319
The three projects affected are the Attentive Energy One project, developed by TotalEnergies, Rise Light & Power, and Corio Generation; the Community Offshore Wind project, developed by RWE Offshore Renewables and National Grid Ventures; and the Excelsior Wind project, developed by Vineyard Offshore with backing from Copenhagen Infrastructure Partners.
But those would now need to rely on smaller 15.5 MW turbines — which means the developers would have needed to buy more and install more massive underwater foundations to put each turbine atop. As a result, it adds time and labor costs to each project.https://www.politico.com/news/2024/04/19/new-york-offshore-wind-canceled-00153319
This situation is a major blow to the offshore wind industry and to New York’s renewable energy aspirations. It also highlights the challenges faced by large-scale renewable energy projects in the United States, including high costs and regulatory hurdles.
Environmental advocates are alarmed by the challenges facing the industry. Offshore wind is key to reaching New York’s goal of 70 percent renewable energy sources by 2030, along with other longer-term targets. But there is growing evidence that the mandate will be hard to reach.
“We are very concerned about not meeting the climate goals,” Adrienne Esposito, executive director of the Citizens Campaign for the Environment, said before NYSERDA’s announcement. “All three of these are in a holding pattern and we need a flight plan.”https://www.politico.com/news/2024/04/19/new-york-offshore-wind-canceled-00153319
Public Service Enterprise Group, Incorporated (PSEG) held its annual stockholders meeting last Tuesday, and CFACT (which holds shares in PSEG) was in attendance to ensure that the company isn’t putting the radical green agenda ahead of the interests of its shareholders.
Public Service Enterprise Group, Incorporated (PSEG) held its annual stockholders meeting last Tuesday, and CFACT (which holds shares in PSEG) was in attendance to ensure that the company isn’t putting the radical green agenda ahead of the interests of its shareholders.
PSEG is a publicly traded diversified energy company based in New Jersey. They control subsidiaries that provide electricity and natural gas to homes and businesses in that region. In recent years, PSEG looked to participate in offshore wind production, which caught the attention of CFACT leadership.
Since purchasing stock in the company, which gives CFACT input in the company’s business decisions, the Committee has continually provided steady pushback against the notion of PSEG embracing offshore wind in its portfolio.
This year’s meeting saw all those efforts hit paydirt. PSEG CEO Ralph Larossa announced that following a review of their various subsidiaries, the company concluded that offshore wind “did not meet investor demands” and was found to “not meet corporate expectations.” The result of this analysis was that PSEG decided to sell off that sector of their business.
Additionally, the company announced that its nuclear energy production plants were running at 93% capacity and that PSEG would be expanding on this area. While they won’t be building new plants, Larossa said that the company plans to upgrade its existing facilities.
Although these are solid wins for CFACT, PSEG still has numerous areas in need of improvement. The utility provider will be installing another 800,000 intrusive “smart meters,” are increasing the number of government-subsidized EV chargers installed throughout their territory to help force a transition to EVs consumers don’t want, and are wastefully spending $280 million to push New Jersey toward further decarbonization.
CFACT plans to continue its monitoring and participation in corporate shareholder meetings to offset efforts by Green activists to push corporate America ever more to the Left.
Someone on the web was touting the abilities of the early climate models by referencing the study Evaluating the Performance of Past Climate Model Projections by Zeke Hausfather, Henri F. Drake, Tristan Abbott, and Gavin A. Schmidt.
And yes, per their study, the climate models are just wonderful in their ability to hindcast the past and forecast the future. They put up a variety of tables and graphs to show that.
(Image above shows the Cray Ecoplex NOAA GAEA supercomputer, which can generate improbable future climate scenarios far faster than we simple humans …)
And yes, per their study, the climate models are just wonderful in their ability to hindcast the past and forecast the future. They put up a variety of tables and graphs to show that.
But I was interested in something different. I wanted to see what the transient climate response (TCR) of each of the models was. The Intergovernmental Panel on Climate Change (IPCC) defines the transient climate response (TCR) as the global temperature change at the time of a doubling of carbon dioxide (CO2) in a 1% per year increase experiment.
In other words, it’s the change in temperature corresponding to a 1 W/m2 increase in forcing, times the 3.7 W/m2 increase in forcing that the IPCC says will occur from a doubling of CO2.
So I looked at the model data, which the authors very responsibly posted online as an Excel spreadsheet at GitHub, and calculated the TCR for each model that they analyzed.
Then in addition to the TCR I wanted to calculate the ECS, the Equilibrium Climate Sensitivity. To do that I looked at the TCR and the ECS of 23 models from this paper. Here’s that data, along with a LOWESS smooth of the data.
So I converted the TCR values from the model performance study into ECS values, using the LOWESS line to do the conversion. Details in the endnotes.
Here are those results for the various models.
Figure 2. TCR and ECS for the 12 models investigated in the model performance paper.
Now, the interesting part of this is that the climate sensitivity (ECS) for the models covers a very wide range, from two to four degrees for a doubling of CO2 … and yet, they all do a whiz-bang job of hindcasting the temperature history of the planet.
And IF they are all “physics based” as is always claimed, I’m sorry but that’s not possible.
The question is: if climate models differ by a factor of 2 to 3 in their climate sensitivity, how can they all simulate the global temperature record with a reasonable degree of accuracy?
In those posts, I showed that despite their immense complexity, the global temperature output of the climate models can be emulated very exactly by a one-line equation that simply lags and scales the forcings used as the input to the models.
Oh, yeah, a final oddity. In the Hansen 1981 model, the TCR and thus the ECS are not constant. From 1981 to 2024 the ECS goes from about 1.6°C/2xCO2 to about 2.5°C/2xCO2. The ECS then continues to increase to 2040, decreases slightly to 2075, and by 2100 it’s all the way up to 2.8°C/2xCO2. That’s almost twice its starting value.
Say what?
Figure 3. TCR and ECS for the Hansen 1981 model. Each year’s TCS is calculated using the change from the 1950 forcing and temperature to the forcing and temperature for that year.
So I have to say that I’m not impressed by the apparent agreement of the models with reality. They are not physics-based. Instead, they are simply tuned to match the past … and in the case of Hansen 1981, tuned to exaggerate the future warming.
And as my bonafide genius older brother used to say, “It’s easy to predict the future … as long as it’s just like the past”.
Unfortunately, as I showed in my last post entitled Now You Sea Ice, Now You Don’t, the climate is occasionally and quite unpredictably very unlike the past …
Regards to all,
w.
Yeah, you’ve heard it before: When you comment, please quote the exact words that you are discussing. It avoids endless problems.
For the math folks: The function I used in Excel to convert the TCR into the ECS is based on an approximation of the LOWESS curve in Figure 1. It is:
This defines three approximately straight-line sections of the LOWESS smooth, and uses their formulas to calculate the ECS depending on the value of the TCR
The post below updates the UAH record of air temperatures over land and ocean. Each month and year exposes again the growing disconnect between the real world and the Zero Carbon zealots. It is as though the anti-hydrocarbon band wagon hopes to drown out the data contradicting their justification for the Great Energy Transition. Yes, there has been warming from an El Nino buildup coincidental with North Atlantic warming, but no basis to blame it on CO2.
The post below updates the UAH record of air temperatures over land and ocean. Each month and year exposes again the growing disconnect between the real world and the Zero Carbon zealots. It is as though the anti-hydrocarbon band wagon hopes to drown out the data contradicting their justification for the Great Energy Transition. Yes, there has been warming from an El Nino buildup coincidental with North Atlantic warming, but no basis to blame it on CO2.
As an overview consider how recent rapid cooling completely overcame the warming from the last 3 El Ninos (1998, 2010 and 2016). The UAH record shows that the effects of the last one were gone as of April 2021, again in November 2021, and in February and June 2022 At year end 2022 and continuing into 2023 global temp anomaly matched or went lower than average since 1995, an ENSO neutral year. (UAH baseline is now 1991-2020). Now we have an usual El Nino warming spike of uncertain cause, but unrelated to steadily rising CO2.
For reference I added an overlay of CO2 annual concentrations as measured at Mauna Loa. While temperatures fluctuated up and down ending flat, CO2 went up steadily by ~60 ppm, a 15% increase.
Furthermore, going back to previous warmings prior to the satellite record shows that the entire rise of 0.8C since 1947 is due to oceanic, not human activity.
The animation is an update of a previous analysis from Dr. Murry Salby. These graphs use Hadcrut4 and include the 2016 El Nino warming event. The exhibit shows since 1947 GMT warmed by 0.8 C, from 13.9 to 14.7, as estimated by Hadcrut4. This resulted from three natural warming events involving ocean cycles. The most recent rise 2013-16 lifted temperatures by 0.2C. Previously the 1997-98 El Nino produced a plateau increase of 0.4C. Before that, a rise from 1977-81 added 0.2C to start the warming since 1947.
Importantly, the theory of human-caused global warming asserts that increasing CO2 in the atmosphere changes the baseline and causes systemic warming in our climate. On the contrary, all of the warming since 1947 was episodic, coming from three brief events associated with oceanic cycles. And now in 2023 we are seeing an amazing episode with a temperature spike driven by ocean air warming in all regions, with some cooling the last two months.
Update August 3, 2021
Chris Schoeneveld has produced a similar graph to the animation above, with a temperature series combining HadCRUT4 and UAH6. H/T WUWT
March 2024 El Nino Persists While Oceans Cool, Land Warms
With apologies to Paul Revere, this post is on the lookout for cooler weather with an eye on both the Land and the Sea. While you heard a lot about 2020-21 temperatures matching 2016 as the highest ever, that spin ignores how fast the cooling set in. The UAH data analyzed below shows that warming from the last El Nino had fully dissipated with chilly temperatures in all regions. After a warming blip in 2022, land and ocean temps dropped again with 2023 starting below the mean since 1995. Spring and Summer 2023 saw a series of warmings, continuing into October, but with cooling since.
UAH has updated their tlt (temperatures in lower troposphere) dataset for March 2024. Posts on their reading of ocean air temps this month precedes updates from HadSST4. I posted last month on SSTs using HadSST4 Ocean Cools as El Nino Recedes February 2024. This month also has a separate graph of land air temps because the comparisons and contrasts are interesting as we contemplate possible cooling in coming months and years.
Sometimes air temps over land diverge from ocean air changes. November 2023 was notable for a dichotomy between Ocean and Land air temperatures in UAH dataset. Remarkably a new high for Ocean air temps appeared with warming in all regions, while Land air temps dropped with cooling in all regions. As a result the Global Ocean and Land anomaly result remained little changed. Last month in February 2024, both ocean and land air temps went higher driven by SH, while NH and the Tropics cooled slightly, resulting in Global anomaly matching October 2023 peak. Now in March Ocean anomalies cooled while Land anomalies rose everywhere.
Note: UAH has shifted their baseline from 1981-2010 to 1991-2020 beginning with January 2021. In the charts below, the trends and fluctuations remain the same but the anomaly values changed with the baseline reference shift.
Presently sea surface temperatures (SST) are the best available indicator of heat content gained or lost from earth’s climate system. Enthalpy is the thermodynamic term for total heat content in a system, and humidity differences in air parcels affect enthalpy. Measuring water temperature directly avoids distorted impressions from air measurements. In addition, ocean covers 71% of the planet surface and thus dominates surface temperature estimates. Eventually we will likely have reliable means of recording water temperatures at depth.
Recently, Dr. Ole Humlum reported from his research that air temperatures lag 2-3 months behind changes in SST. Thus cooling oceans portend cooling land air temperatures to follow. He also observed that changes in CO2 atmospheric concentrations lag behind SST by 11-12 months. This latter point is addressed in a previous post Who to Blame for Rising CO2?
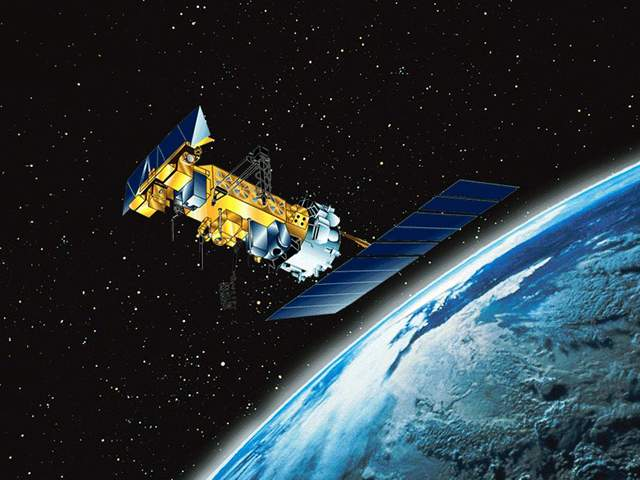
After a change in priorities, updates are now exclusive to HadSST4. For comparison we can also look at lower troposphere temperatures (TLT) from UAHv6 which are now posted for March. The temperature record is derived from microwave sounding units (MSU) on board satellites like the one pictured above. Recently there was a change in UAH processing of satellite drift corrections, including dropping one platform which can no longer be corrected. The graphs below are taken from the revised and current dataset.
The UAH dataset includes temperature results for air above the oceans, and thus should be most comparable to the SSTs. There is the additional feature that ocean air temps avoid Urban Heat Islands (UHI). The graph below shows monthly anomalies for ocean air temps since January 2015.
Note 2020 was warmed mainly by a spike in February in all regions, and secondarily by an October spike in NH alone. In 2021, SH and the Tropics both pulled the Global anomaly down to a new low in April. Then SH and Tropics upward spikes, along with NH warming brought Global temps to a peak in October. That warmth was gone as November 2021 ocean temps plummeted everywhere. After an upward bump 01/2022 temps reversed and plunged downward in June. After an upward spike in July, ocean air everywhere cooled in August and also in September.
After sharp cooling everywhere in January 2023, all regions were into negative territory. Note the Tropics matched the lowest value, but since have spiked sharply upward +1.7C, with the largest increases in April to July, and continuing through adding to a new high January 2024. NH also spiked upward to a new high, while Global ocean rise was more modest due to slight SH cooling. In February, NH and Tropics cooled slightly, while greater warming in SH resulted in a small Global rise. Now in March both NH and SH cooled, pulling down the Global anomaly despite a persisting peak in the Tropics.
Land Air Temperatures Tracking in Seesaw Pattern
We sometimes overlook that in climate temperature records, while the oceans are measured directly with SSTs, land temps are measured only indirectly. The land temperature records at surface stations sample air temps at 2 meters above ground. UAH gives tlt anomalies for air over land separately from ocean air temps. The graph updated for March is below.
Here we have fresh evidence of the greater volatility of the Land temperatures, along with extraordinary departures by SH land. Land temps are dominated by NH with a 2021 spike in January, then dropping before rising in the summer to peak in October 2021. As with the ocean air temps, all that was erased in November with a sharp cooling everywhere. After a summer 2022 NH spike, land temps dropped everywhere, and in January, further cooling in SH and Tropics offset by an uptick in NH.
Remarkably, in 2023, SH land air anomaly shot up 2.1C, from -0.6C in January to +1.5 in September, then dropped sharply to 0.6 in January 2024, matching the SH peak in 2016. Now in February and March SH anomaly jumped up nearly 0.7C, and Tropics went up to a new high of 1.5C, pulling up the Global land anomaly to match 10/2023.
The Bigger Picture UAH Global Since 1980
The chart shows monthly Global anomalies starting 01/1980 to present. The average monthly anomaly is -0.04, for this period of more than four decades. The graph shows the 1998 El Nino after which the mean resumed, and again after the smaller 2010 event. The 2016 El Nino matched 1998 peak and in addition NH after effects lasted longer, followed by the NH warming 2019-20. An upward bump in 2021 was reversed with temps having returned close to the mean as of 2/2022. March and April brought warmer Global temps, later reversed
With the sharp drops in Nov., Dec. and January 2023 temps, there was no increase over 1980. Then in 2023 the buildup to the October/November peak exceeded the sharp April peak of the El Nino 1998 event. It also surpassed the February peak in 2016. December and January were down slightly, and now March is matching the October peak. Where it goes from here, up or down further, remains to be seen, though there is evidence that El Nino is weakening.
The graph reminds of another chart showing the abrupt ejection of humid air from Hunga Tonga eruption.
TLTs include mixing above the oceans and probably some influence from nearby more volatile land temps. Clearly NH and Global land temps have been dropping in a seesaw pattern, nearly 1C lower than the 2016 peak. Since the ocean has 1000 times the heat capacity as the atmosphere, that cooling is a significant driving force. TLT measures started the recent cooling later than SSTs from HadSST4, but are now showing the same pattern. Despite the three El Ninos, their warming has not persisted prior to 2023, and without them it would probably have cooled since 1995. Of course, the future has not yet been written.
Quietly hidden in a paper about ancient pandemics is the most detailed estimate of Roman temperatures I’ve ever seen. For 800 years, temperatures gyrated over a three-degree range. The Climate Alarmists of Rome could have run the whole warming-cooling-warming-scare back to back for 400 years. But make no mistake, the good times, Pax Romana — were the warmest and wettest ones. The colder times are associated with aridity, plagues, and collapse.
Quietly hidden in a paper about ancient pandemics is the most detailed estimate of Roman temperatures I’ve ever seen. For 800 years, temperatures gyrated over a three-degree range. The Climate Alarmists of Rome could have run the whole warming-cooling-warming-scare back to back for 400 years. But make no mistake, the good times, Pax Romana — were the warmest and wettest ones. The colder times are associated with aridity, plagues, and collapse.
Two thousand years ago, plankton bloomed and died, and the different ratios of warm and cool species left thick layers on the ocean floor just off the heel of the boot of Italy. Every ten years, another centimeter-thick layer of dead dinocysts collected on the sea floor, which makes for a remarkably detailed record. They report a jaw-dropping “three-year resolution”. The record was so rich they could pick out the seasons, and wow, by golly, they could compare it with modern air temperatures. (See graph A below.) Though, for some reason, they don’t make that easy, or say much about how those ancient temperatures compare to today. (Presumably, if they found things were hotter today, they’d have gotten a Nobel Prize.)
Cold times don’t guarantee a pandemic, but warm times do seem to discourage them:
Despite expert predictions of doom in hot weather, ancient Roman records don’t suggest mass outbreaks of malaria, flesh-eating bugs, or viral pandemics.
Note the words “Present Day mean (1960-1990)” on the horizontal line on Graph B… it was hotter for 200 years in a row.
Fig 2A: (Click to enlarge) (A) Comparison between late-summer/autumn dinoflagellate cyst–based W/C ratio (black line + black points) of core GeoB 10709-5 and mean autumn Italian temperatures at 1000-m altitude (blue line). (B) Late-summer/autumn dinoflagellate cyst–based W/C ratio and relative abundance of discharge species (nutrient sensitive) reconstructions (black lines) and the occurrence of epidemics and pandemics in the Roman empire (blue blocks) as well as disease outbreaks in Roman Italy (gray lines) and major historical periods/events
In the paper, Graph B is strangely truncated at the hottest points, as if their printer jets got clogged. Perhaps the heat broke some climate models? Just how hot was that spike in the era of Jesus? I’d like to get that data…
The plagues
The Antonine Plague, from about 165 to 180 AD, was probably smallpox; no one is sure what the Plague of Cyprian was, from about 215 to 266 AD, it might have been measles, smallpox, or some relative of Ebola. At its worst, 5,000 people a day were said to be dying in Rome. In Alexandria, one historian estimates the population fell from half a million people to just 200,000. The Plague of Justinian was a form of the Black Plague. It started from about 541 to 549AD, and they say, rather somberly, lasted on and off until C.E. 766. Long live hygiene and antibiotics, eh?
The researchers can only speculate about why the pandemics spread more often in the cold. They don’t mention the word vitamin. But the first thing I would suggest is vitamin D3 — levels of which probably fall the minute people get out of their toga’s and pull on their jackets.
Victims were known to endure fever, chills, upset stomach, and diarrhea that turned from red to black over the course of a week. They also developed horrible black pocks over their bodies, both inside and out, that scabbed over and left disfiguring scars.
For the worst afflicted, it was not uncommon that they would cough up or excrete scabs that had formed inside their body. Victims suffered in this way for two or even three weeks before the illness finally abated. Perhaps 10 percent of the 75 million people living in the Roman Empire never recovered.
The plague waxed and waned for a generation, peaking in the year 189 when a witness recalled that 2,000 people died per day in the crowded city of Rome. Smallpox devastated much of Roman society. The plague so ravaged the empire’s professional armies that offensives were called off.
And when communities began to buckle, Romans reinforced them. Emperor Marcus Aurelius responded to the deaths of so many soldiers by recruiting slaves and gladiators to the legions. He filled the abandoned farmsteads and depopulated cities by inviting migrants from outside the empire to settle within its boundaries.
Apparently, things were so bad that in some cities, so many aristocrats died they even filled the councils with “the sons of freed slaves”.
The temperatures from graph B above are marked in the figure below (just in case you don’t relate to phytoplankton ratios).
Core DP30PC and paleoclimatic records. Dark blue: Gulf of Taranto, late-summer temperature reconstruction based on dinoflagellate cyst composition (this study); orange: Northern Alps, June to August dendrochronological-based temperature reconstruction (3); red: proxy-based central European, June to August (JJA) temperature reconstruction (33).
The currents flow right down the side of Italy before depositing some phytoplankton in the Gulf of Taranto where the samples were collected.
For the record, here’s how they describe the calibration:
The calibration of our dinoflagellate cyst–based temperature proxy is based on the comparison of the cyst association of a reference dataset from multicore core GeoB 10709-5 (29) to mean Italian late-summer/autumn air temperatures (32).
For some reason, the researchers have this magnificent temperature record, and they calibrate it with modern temperatures but say nothing at all about how the Roman Optimum compared to the 21st Century. Luckily, we already know from other studies that it was hotter back then. Must have been all those Roman coal plants?
K. A. F.Zonneveld et al (2024). Climate change, society, and pandemic disease in Roman Italy between 200 BCE and 600 CE Physics Today77 (4), 17–18 (2024); https://doi.org/10.1126/sciadv.adk1033


You must be logged in to post a comment.