Global warming, climate change, all these things are just a dream come true for politicians. I deal with evidence and not with frightening computer models because the seeker after truth does not put his faith in any consensus. The road to the truth is long and hard, but this is the road we must follow. People who describe the unprecedented comfort and ease of modern life as a climate disaster, in my opinion have no idea what a real problem is.
From North Carolina State University and the “because our models say-so” department comes this press release that is far more predictable than the climate change it claims to predict – Anthony.
From North Carolina State University and the “because our models say-so” department comes this press release that is far more predictable than the climate change it claims to predict – Anthony.
By evaluating historical climate records, observational and projection data, an international team of researchers found a “pushing and triggering” mechanism that has driven the Arctic climate system to a new state, which will likely see consistently increased frequency and intensity of extreme events across all system components – the atmosphere, ocean and cryosphere – this century.
“We know that mean temperatures are rising, and the Arctic is commonly considered an indicator of global changes due to its higher sensitivity to any perturbation of external and internal forcings,” says Xiangdong Zhang, research professor at North Carolina State University and senior scientist at the North Carolina Institute for Climate Studies.
“The annual mean warming rate of the Arctic is more than three times the global average – this is known as Arctic amplification,” Zhang says. “But no systematic review has been done about the interplay of warmer temperatures with the dynamics of atmosphere, ocean and sea ice in weather and climate extremes around the Arctic.” Zhang is the lead author of the study.
The team looked at historic temperature data and the records of extreme events in the Arctic system components, as well as CMIP6 model projections that covered a period from the present-day to the end of the century. Overall, they saw that extreme events – atmosphere and ocean heatwaves, heavy precipitation, sea ice loss and ice sheet melt – have consistently occurred across the Arctic climate system with an increased frequency and intensity since the year 2000. The CMIP6, or Coupled Model Intercomparison Project Phase 6, is an international project consisting of modeling centers and groups worldwide.
“We usually think about warming as a gradual, quasi-linear change of temperature over time – it slowly gets warmer everywhere,” Zhang says. “But nonlinear changes occur across the entire system. The interplay between warming and the changes in atmospheric, oceanic and sea ice dynamics creates ‘pushing and triggering’ mechanisms that result in a tipping point for the climate system.”
According to the researchers, since the year 2000 these pushing and triggering mechanisms have forced a step change, or sudden shift, in the baseline of the Arctic climate system.
The mechanisms in question include changes in large-scale atmosphere and ocean circulation that enhance poleward atmospheric heat and moisture transport and ocean heat transport into the Arctic. Intense cyclones and blocking high-pressure systems that obstruct the movement of other systems through the upper atmosphere further enhance warming, increasing sea ice and ice sheet temperatures and pushing the Arctic climate system to a tipping point, triggering more extremes.
“Once there is a baseline state change in climate, we also see a change in extreme events,” Zhang says.
According to the researchers’ analysis, since the year 2000 the probability of atmospheric heatwaves has increased by 20%; Atlantic Ocean layer warm events have increased by 76%; sea ice loss events have increased by 83%; and Greenland Ice Sheet melt extent has increased by 68%.
“Prior to the 21st century, these events were rare,” Zhang says. “But with continued warming they will become the new norm, and we could see ice-free summers in the Arctic by mid-century. More work must be done to understanding the interplay of multiscale climate drivers in the Arctic, so that we can predict and plan for the future.”
The study appears in Nature Reviews Earth & Environment. Zhang is supported in part by the U.S. Department of Energy and the National Oceanic and Atmospheric Administration. The work was done by leading and early-career scientists from the U.S., Australia, Canada, China, Finland, Germany, Norway, Sweden, Switzerland and the United Kingdom.
No green activist operation makes clearer why they need to ban free speech and cancel scientific debate to achieve Net Zero hegemony than the Guardian newspaper. Last Saturday, we learnt from its Environment Editor Damian Carrington that campaigners had said the UK’s TV and radio regulator Ofcom was allowing GB News and others to ‘flout” accuracy rules and broadcast “climate change denial”, whatever that last phrase means. C
No green activist operation makes clearer why they need to ban free speech and cancel scientific debate to achieve Net Zero hegemony than the Guardian newspaper. Last Saturday, we learnt from its Environment Editor Damian Carrington that campaigners had said the UK’s TV and radio regulator Ofcom was allowing GB News and others to ‘flout” accuracy rules and broadcast “climate change denial”, whatever that last phrase means. Carrington noted in response to frequent suggestions of inaccuracy in UN climate models going back to 1979, that, “in fact, UN climate models have been remarkably accurate”. How Carrington, one of three journalists of the year in 2023 at the Green Blob-funded Covering Climate Now, can write this with a straight face is anyone’s guess.
Net Zero is dead in the United States and there has been a welcome revival of the scientific process that has killed off the ridiculous notion that a science opinion can somehow be ‘settled’. The recent official climate report from the US Department of Energy noted that climate models are the primary tool used to project future change in response to higher levels of anthropogenic greenhouse gases. “Of great concern is the fact that after several decades of the climate modelling enterprise… the range of future warming they produce in response to a hypothetical doubling of CO2 extends over a factor three.” This range of disagreement has not decreased for decades, the five eminent science authors add.
Tittle-tattling Reliable Media is behind the GB News campaign and, egged on by Guardian Central, the anti-science desperation is clear. One GB News contributor described climate change as “rubbish’. Another described it as a “scam”, an opinion recently expressed at the United Nation’s General Assembly by the elected President of the US Government. It might be thought that the scientific process can withstand a few harsh words, but Reliable Media is outraged. It charges that Ofcom has “effectively suspended its accuracy rules on this life-and-death issue”.
Carrington finds room for reporting the fine of £17,000 levied recently by the French equivalent state broadcast regulator Arcom on the centre-Right TV channel CNews. In this case a contributor had dared to air the opinion that climate change was “a lie, a scam”.
The French complaint was made by the activist Eva Morel from QuotaClimat. She stated that:
When the media blur the line between facts and opinions, it doesn’t lead people to trust in alternative truths; it leads them to trust in nothing at all. Sowing doubt about climate science serves to obstruct climate action and it endangers lives.
In an excellent article in Watts Up With That?, Eric Worrall pointed out that the problem with enforced agreement on the ‘facts’ is that in science, “there is no such thing as a fact which cannot be challenged”.
Ofcom rules specifically note that an example of an issue which it considers to be broadly settled is the “scientific principles behind the theory of anthropogenic global warming”. This is plainly anti-science. For a start, the scale of human-caused global warming is a scientific hypothesis (opinion), not a validated theory. Ofcom’s claim is a political notion concocted by state bureaucrats who obviously have little understanding of the language of science and the way it actually works. In fact, Ofcom seems vaguely aware of the stupidity that lies behind its fashionable claim. Carrington reports that it has received 1,221 complaints related to the ‘climate crisis’ since January 2020 and none had resulted in a ruling that the broadcasting code had been breached.
Worrall is withering in his concluding assessment of the shenanigans of activists seeking to quash dissenting scientific voices in public spaces.
My point is, to declare some facts are beyond challenges, especially ‘facts’ produced by artefacts as flimsy as climate models, is to strike at the foundations of freedom of expression and scientific inquiry. Forcing broadcasters to embrace a uniform, government-approved version of unassailable facts, then claiming they somehow have freedom of expression, is utter nonsense.
Reliable Media is a grubby little hard-Left operation. Few details of its finances and funding are available since it was formed as a limited-by-guarantee company to take forward the ‘Just Stop Hate’ and ‘Just Stop Heat’ campaigns. It claims that it is making “climate change denial unprofitable”, and it does this by seeking to destroy the ability of free speech media operations such as the increasingly successful GB News to attract advertisers. If this is its aim, it presumably has good legal advice, although its latest filed accounts to June 2024 suggest money might be tight. A sum of £107,940 is said to be held as cash at bank, but an identical sum is set aside for creditors due within one year. Whatever its financial position, its activities resemble those of the class sneak, running off to teacher to blub about the bigger boys, those who are more confident and entrepreneurial, better at sports and more successful with the girls. As the brilliant comedy song writer Dominic Frisby sang, maybe jokingly, in his composition about ways to stop freaks like Ed Miliband: “We need to bring back school bullying.” Science, he adds, is only discovering the value of it now.
Chris Morrison is the Daily Sceptic’s Environment Editor. Follow him on X.
Fresh insights into the ecological devastation caused by onshore wind turbines around the world are contained in a shocking new paper published last month by a group of ecologists in Nature. The paper is paywalled and has attracted little mainstream media interest, but it highlights research that illustrates that the effect of utility-scale wind energy production “can be far reaching and sometimes have large and unexpected consequences for biodiversity”.
Fresh insights into the ecological devastation caused by onshore wind turbines around the world are contained in a shocking new paper published last month by a group of ecologists in Nature. The paper is paywalled and has attracted little mainstream media interest, but it highlights research that illustrates that the effect of utility-scale wind energy production “can be far reaching and sometimes have large and unexpected consequences for biodiversity”. An annual figure of around one million bats are killed in the countries with the highest number of turbines, but harmful effects are seen in many other parts of the ecosystem. The number of top predators such as jaguars, jungle cats and golden jackals can be changed by turbines in tropical forest gaps, leading to the “possibility for cascading effects” along similar latitudinal levels.
In short, the science team notes that turbines can kill birds, bats and insects, change animal behaviour, physiology and demography and alter ecosystems. The installation of wind turbines invariably results in habitat degradation, but it is regions rich in biodiversity with minimal existing infrastructure that suffer the most. The authors state that wind facilities “are recognised as an important driver for losses and degradation of irreplaceable habitats that are important for conservation.” Such areas, of course, can be found in the windy highlands of Scotland. For City-dwelling eco zealots, it is a case of out of sight, out of mind. Net Zero is all about money and power – bats and eagles have neither.
The Nature paper is a wake-up call about the increasing damage that is being inflicted on natural habitats by wind turbines that are steadily increasing in size and destructive potential. It is a summary of the latest findings about the effect of turbines, and it is not sanguine about the future. “Perhaps the greatest unknown in predicting future effects of wind power on biodiversity lies in the scope of the potential expansion of the technology and the cumulative consequences of this expansion for species and ecosystems”. A 2021 USA report on the potential pathways to Net Zero emissions is noted, and this suggests using up to 13% of the land area for wind farms. The new Trump Administration is likely to put a stop to this madness which the scientists observe could have “dramatic consequences for biodiversity”.
The BP Deepwater Horizon accident is generally considered the worse US offshore oil spill. Estimates vary but it is thought to have led to the deaths of around 600,000 sea birds and the incident led to widespread condemnation by environmentalists that continues to this day. Slightly less publicity is given to the 500,000 bats killed onshore in the US by wind turbines every single year. In the UK, 30,000 is the estimated annual kill number, with Canada at 50,000 and 200,000 in Germany.
Many bird species are also at risk, with large raptors a conspicuous example. It is admitted that limited information is available on population-level consequences, but available evidence suggests the turbines could threaten certain species with local extinction, particularly those at risk with low reproduction rates. Possible population collapse has been predicted for cinereous and griffon vultures in Europe and the Eurasian skylark in Portugal. Other predictions suggest population declines for hoary bats in North America, lesser kestrel in France and black harriers in South Africa. Population declines have been reported in central Europe for animals with high-collision risk such as the noctule bat, while nearly 50% of bird species evaluated in one study in California were said to be subject to turbine-induced population decline. Meanwhile, the mortality of golden eagles at Altamont Pass Wind Resource in California is said to be so frequent that local populations are sustained by immigrants. Finally, the authors report that the globally endangered Egyptian vulture in Spain has a lower survival rate, population growth rate and size in the presence of wind facilities.
Who really cares? The UK Bat Conservation Trust states that climate change poses a “significant threat” to UK bat populations. “We need energy-efficient housing and renewable energy to help mitigate for climate change for the benefit of bats, people and the wider environment”, it adds. It is fair to say that similar understanding is not extended to developers encountering the presence of bats other than ‘Green’ entrepreneurs.
The giant turbines regularly sweep the countryside of insects, and the report notes that fatalities can be great enough to contribute substantially to the build-up of debris on blades. In fact, one of the report’s authors, Professor Christian Voigt, has stated in earlier work that it was necessary to evaluate if fatalities added to the decline of insect populations “and potentially the extinction of species”. In a 2022 paper, Voigt reported that turbines can change the nearby microclimate, while vibrational noise may reduce earthworm abundance with likely cascading effects on soil quality and vegetation.
Mass slaughter of bats and raptors is already known, but this new report casts fresh light on the cascading effects on the natural world of increasing numbers of giant wind turbines. That said, the report admits that biodiversity impacts have been documented for only a few small taxa, but the impacts are “not negligible”. Proponents of wind power often claim that wind energy’s impacts on biodiversity will be less than climate change, it is noted. The authors find this “plausible”, but the assumption is said to be “untested”.
Yet another untested assumption driving the destructive madness of Net Zero, others may conclude.
Chris Morrison is the Daily Sceptic’s Environment Editor. Follow him on X.
Relying on human ingenuity to coexist with a changing climate – either warmer or cooler – and tending to long-recognized public health threats are the best ways to ensure the well-being of the planet and its inhabitants, according to an Australian physician and expert in climate and public health.
Relying on human ingenuity to coexist with a changing climate – either warmer or cooler – and tending to long-recognized public health threats are the best ways to ensure the well-being of the planet and its inhabitants, according to an Australian physician and expert in climate and public health.
“The ingenuity of Homo sapiens at adapting to climate has permitted people to populate almost the entire globe from the freezing Arctic to the steamy tropics, notes Dr. D. Weston Allen, lead author of a paper supporting a proposed repeal of a federal designation of carbon dioxide (CO2) as a pollutant. “If we stick to doing what we do best – adaptation – we will continue to thrive.”
Citing nearly 400 references, the paper was filed as a formal comment by the CO2 Coalition, Fairfax, Virginia, with the U.S. Environmental Protection Agency in support of its proposal to rescind the regulation known as the Endangerment Finding.
Dr. Allen says that civilizations did well in past eras of relative warmth during Minoan and Roman times and the Medieval Warm Period. And, he says, cool periods often brought suffering, the most recent being the Little Ice Age, which experienced “frequent widespread crop failures, mass starvation, disease and depopulation.”
“The Black Death of 1346-1353 wiped out 30%-60% of Europe’s population and up to 200 million people across Eurasia,” he writes.
However, natural change in the climate and industrialization that spread in the 1800s and accelerated in the 20th century fostered unprecedented prosperity and health.
“Global rewarming since the 18th century, associated with increasing prosperity, better housing, sanitation, food and water supplies, has greatly benefited human health and wealth,” says Dr. Allen. “Deaths from typhoid and tuberculosis declined dramatically during pre-antibiotic 20th century warming (1910-1945). Mortality from all causes fell as temperatures rose. From a billion people in 1800, the global population doubled by 1927, doubled again to 4 billion in 1974 and again to 8 billion in 2022.”
Fuels for new technologies and industry – first coal then oil and natural gas as well – made modern living possible.
“By cheaply and reliably powering industry, mechanizing agriculture and transport, fossil fuels helped to end slavery and emancipate women and children, propelled urbanization, sewerage, safe water supplies, electricity, heating and cooling,” the paper says. “They also facilitated better hospitals and health care.”
In places where fossil fuels are available and affordable, people live longer, healthier lives. Access to electricity enables disease surveillance, vaccination drives, and reliable transport for medicines and doctors. Africa, Asia, and South America — regions once ravaged by cholera, malaria, and famine — now see falling death rates and rising lifespans.
In 1968, biologist Paul Ehrlich published “The Population Bomb,” warning of mass starvation in the 1970s, recalls Dr. Allen. However, global famines declined rather than increased.
“Prophesies are in the province of religion, not science,” counsels Dr. Allen.
The warm climate and carbon dioxide-enriched air have boosted agriculture and expanded habitable zones. Crop yields soared, aided by higher atmospheric CO2 (the same gas vilified in climate debates) and the fertilizers, pesticides and modern equipment dependent on fossil fuels. Between 1980 and 2003, as CO2 concentrations rose by 11%, global food output leapt by 63%.
Although activists claim that warming will spread tropical diseases into temperate zones, malaria, once widespread in Europe and North America, declined because of public health measures such as draining swamps, spraying insecticides and increasing medical treatment.
An oft-ignored fact is that cold weather is far deadlier than heat. Globally, cold kills many times more people than heat despite fearmongering about warming. Also, contrary to hyperbolic headlines, data for the last 100 years show that deaths from extreme weather have dropped by 90%.
When policymakers focus exclusively on carbon dioxide and hypothetical climate harms, populations are denied the tools to manage real threats: infectious disease, hunger, dirty water, unsafe housing.
“It is vital that governments focus on real pollutants, not imagined ones, and that they avoid using climate change as a scapegoat for failure to implement sound public health policies and proven preventive measures,” writes Dr. Allen. “Misguided climate action can be worse than unmitigated climate change.”
Any perturbation in the radiative balance at the top of the atmosphere (TOA) that induces a net energy flux into- or out of Earth’s thermal system will result in a surface temperature response until a new equilibrium is reached. According to the Anthropogenic Global Warming (AGW) hypothesis which attributes global warming solely to rising concentrations of Greenhouse gases (GHGs), the observed increase in Earth’s radiative imbalance is entirely driven by anthropogenic GHG-emissions.
Climate as heat engine. A heat engine produces mechanical energy in the form of work W by absorbing an amount of heat Qin from a hot reservoir (the source) and depositing a smaller amount Qout into a cold reservoir (the sink). (a) An ideal Carnot heat engine does the job with the maximum possible efficiency. (b) Real heat engines are irreversible, and some work is lost via irreversible entropy production TδS. (c) For the climate system, the ultimate source is the Sun, with outer space acting as the sink. The work is performed internally and produces winds and ocean currents. As a result, Qin = Qout.
Ad Huijser recently published a paper explaining why IPCC claims about global warming are contradicted by observations of our Earth thermal system including a number of internal and external subsytems. The title Global Warming and the “impossible” Radiation Imbalance links to the pdf. This post is a synopsis to present the elements of his research findings, based on the rich detail, math and references found in the document. Excerpts in italics with my bolds and added images. H/T Kenneth Richard and No Tricks Zone.
Abstract
Any perturbation in the radiative balance at the top of the atmosphere (TOA) that induces a net energy flux into- or out of Earth’s thermal system will result in a surface temperature response until a new equilibrium is reached. According to the Anthropogenic Global Warming (AGW) hypothesis which attributes global warming solely to rising concentrations of Greenhouse gases (GHGs), the observed increase in Earth’s radiative imbalance is entirely driven by anthropogenic GHG-emissions.
However, a comparison of the observed TOA radiation imbalance with the assumed GHG forcing trend reveals that the latter is insufficient to account for the former. This discrepancy persists even when using the relatively high radiative forcing values for CO2 adopted by the Intergovernmental Panel on Climate Change (IPCC), thereby challenging the validity of attributing recent global warming exclusively to human-caused GHG emissions.
In this paper, Earth’s climate system is analyzed as a subsystem of the broader Earth Thermal System, allowing for the application of a “virtual balance” approach to distinguish between anthropogenic and other, natural contributions to global warming. Satellite-based TOA radiation data from the CERES program (since 2000), in conjunction with Ocean Heat Content (OHC) data from the ARGO float program (since 2004), indicate that natural forcings must also play a significant role. Specifically, the observed warming aligns with the net increase in incoming shortwave solar radiation (SWIN), likely due to changes in cloud cover and surface albedo. Arguments suggesting that the SWIN trend is merely a feedback response to GHG-induced warming are shown to be quantitatively insufficient.
This analysis concludes that approximately two-thirds of the observed global warming must be attributed to natural factors that increase incoming solar radiation, with only one-third attributable to rising GHG-concentrations. Taken together, these findings imply a much lower climate sensitivity than suggested by IPCC-endorsed Global Circulation Models (GCMs).
Introduction
On a global scale and over longer periods of time, the average surface temperature of our climate system reacts similarly to that of a thermal system such as a pot of water on a stove: when the incoming heat is steady and below boiling, the system stabilizes when the heat loss (via radiation and convection) equals the input. Analogously, Earth’s surface-atmosphere interface is the main absorber and emitter of heat. Reducing the “flame” (solar input) leads to cooling, regardless of the total heat already stored in the system. The system’s average temperature will drop as well, as soon as the heating stops. So, no sign of any “warming in the pipeline” for such a simple system.
The two transport mechanisms, air and ocean, operate on different timescales. Air has a low specific heat capacity, but high wind speeds make it a fast medium for heat transfer. Oceans, by contrast, have a high specific heat capacity but move more slowly. The Atlantic Meridional Overturning Circulation (AMOC) with the well-known Gulf Stream carrying warm water from south to north, can reach speeds up to about 3 m/s.
But it’s warm current remains largely confined to surface layers due to limited solar radiation penetration and gravity-induced stratification. With a path-lengths of up to 8,000 km and an average speed of 1.5 m/s, ocean heat takes approximately 2 months to travel from the Gulf of Mexico to the Arctic. This is comparable to the 1 to 2 months delay between solar input and temperature response in the annual cycle, suggesting that oceanic heat transport is part of the climate system’s normal operation. Climate adaptation times from anthropogenic influences are estimated at 3 to 5 years. If “warming in the pipeline” exists, it must be buried in the much colder, deeper ocean layers.
ARGO float data since 2004 show substantial annual increases in Ocean Heat Content (OHC), sometimes expressed in mind-boggling terms such as 10²² joules per year (see Fig.1). While this may sound alarming [1,2], when converted to flux, it represents less than 1 W/m², a mere 0.6% of the average 160 W/m² of absorbed solar energy at the surface. All the rest is via evaporation, convection and ultimately by radiation sent back to space after globally being redistributed by wind and currents.
Fig. 1. Ocean Heat Content (OHC) anomaly from 0–2000 meters over time, shown as 3-month and annual moving averages (CMAA), along with their time derivatives. Notable are the relatively large variations, likely reflecting the influence of El Niño events. The average radiative imbalance at the top of the atmosphere (TOA), estimated at 0.85 W/m², corresponds approximately to the midpoint of the time series (around 2015). Data: https://www.ncei.noaa.gov/access/global-ocean-heat-content/basin_heat_data.html [7].
This raises the question: Why would extra GHGs that have only a limited effect on the 99.4% of the outgoing flux, have affected this 0.6% residue during a couple of decennia in such a way that we should be scared about all that “warming in the pipeline” as Hansen et al. [2] are warning us for? In the following sections, we examine data showing that observed trends in the radiation imbalance and OHC are better explained by the internal dynamics of the Earth’s thermal system and natural forcings such as from increasing solar radiation, rather than solely by GHG emissions.
Estimating our climate’s thermal capacity CCL
The rather fast responses of our climate indicates that the thermal capacity of our climate must be much less than the capacity of the entire Earth thermal system. This climate heat capacity CCL depends on how sunlight is being absorbed, how that heat is transferred to the atmosphere and which part of it is being stored in either land or ocean.
At continental land-area, sunlight is absorbed only at the very surface where the generated heat is also in direct contact with the atmosphere. Seasonal temperature variations don’t penetrate more than 1 to 2 meters deep in average and as a consequence, storage of heat is relatively small. Sunlight can penetrate pure water to several hundred meters deep, but in practice, penetration in the oceans is limited by scattering and absorption of organic and inorganic material. A good indication is the depth of the euphotic zone where algae and phytoplankton live, which need light to grow. In clear tropical waters where most of the sunlight hits our planet, this zone is 80 to 100 m deep [12].
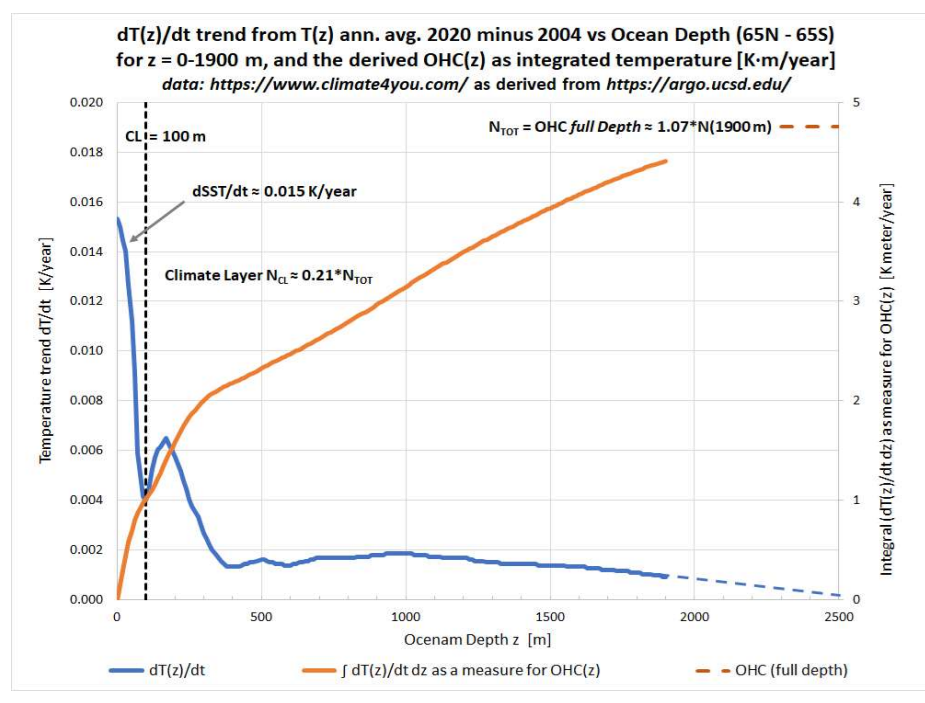
Another important factor in our climate’s heat capacity is how this ocean layer of absorbed heat is in contact with the atmosphere. Tides, wind, waves and convection continuously mix the top layer of our oceans, by which heat is easily exchanged with the atmosphere. This mixed-layer is typically in the order of 25 – 100 m, dependent on season, latitude and on the definition of “well mixed” [13]. Below this ~100 m thick top-layer, where hardly any light is being absorbed and the mixing process has stopped, ocean temperatures drop quickly with depth. As the oceans’ vertical temperature gradient at that depth doesn’t support conductive nor convective heat flows going upward, climate processes at the surface will thus become isolated from the rest of the Earth’ thermal system.
Figure 4 with the Change in Ocean Heat Content vs. Depth over the period 2004 – 2020 obtained via the ARGO-floats [6,14], offers a good indication for the average climate capacity CCL. It shows the top layer with a high surface temperature change according to the observed global warming rate of about 0.015 K/year, and a steep cut off at about 100 m depth in line with the explanation above. Below the top layer, temperature effects are small and difficult to interpret, probably due to averaging over all kinds of temperature/depth profiles in the various oceans ranging from Tropical- to Polar regions.
In case of a “perfect” equilibrium (N = 0, dTS/dt = 0), all of the absorbed sunlight up to about 100 m deep, has to leave on the ocean-atmosphere interface again. However, deep oceans are still very cold with a stable, negative temperature gradient towards the bottom. This gradient will anyhow push some of the absorbed heat downwards. Therefore, even at a climate equilibrium with dTS/dt= 0, we will observe N > 0. With the large heat capacity of the total ocean volume, that situation will not change easily, as it takes about 500 years with today’s N ≈ +1 W/m2 to raise its average temperature just 1°C.
The Earth’s climate system can thus be regarded as a subset of the total Earth’s thermal system (ETS) responding to different relaxation times. The climate relaxes to a new equilibrium within 3–5 years, while the deeper oceans operate on multidecadal or even longer timescales, related to their respective thermal capacities C for the ETS, and CCL for the climate system.
The (near) “steady state” character of current climate change
Despite the ongoing changes in climate, the current state can be considered a “near” steady-state. The GHG forcing trend has been pretty constant for decades. Other forcings, primarily in the SW channel, are also likely to change slowly and can be approximated as having constant trends over decadal timescales. Similarly, despite yearly fluctuations, the surface temperature trend has remained fairly stable since 2000.
This analysis strengthens the conclusion that the increase in both N(t) and N0(t) are not a direct consequence of greenhouse gas emissions, but rather of enhanced forcing in the SW-channel.
The preceding analysis highlights how the IPCC’s assumptions diverge significantly from observed reality. While the IPCC model components may collectively reproduce the observed warming trend, they fail to individually align with key observational data, in particular the Ocean Heat Content.
Figure 6 also illustrates that changes in cloudiness are more pronounced on the Northern Hemisphere, especially at mid-latitudes and over Western Europe. For example, the Dutch KNMI weather-station at Cabauw (51.87°N, 4.93oE), where all ground-level radiation components are monitored every 10 minutes, recorded an increase in solar radiation of almost +0.5 W/m²/year since 2000 [26]. Applying the 0.43 net-CRE factor (conservative for this latitude), we estimate a local forcing trend dFSW/dt ≈ 0.2 W/m²/year. This is an order of magnitude larger than the GHG forcing (0.019–0.037 W/m²/year). Even with the IPCC values, GHGs can just account for about 16% of the warming at this station. The average temperature trend for this rural station located in a polder largely covered by grassland, is with ~ +0.043 K/year almost 3x the global average. This, nor the other trends mentioned above can be adequately explained by the IPCC’s GHG-only model.
The IPCC places strong emphasis on the role of climate feedbacks in amplifying the warming effect of greenhouse gases (GHGs) [8]. These feedbacks are considered secondary consequences of Anthropogenic Global Warming, driven by the initial temperature increase from GHGs. Among them, Water-Vapor feedback is the most significant. A warmer atmosphere holds more water vapor (approximately +7%/K) and since water vapor is a potent GHG, even a small warming from CO2 can amplify itself through enhanced evaporation.
Other feedbacks recognized by the IPCC include Lapse Rate, Surface Albedo, and Cloud feedbacks [8], all of which are inherently tied to the presence and behavior of water in its various phases. Therefore, these feedbacks are natural responses to temperature changes, regardless of the original cause of warming, be it GHGs, incoming solar variability, or internal effects. They are not additive components to natural climate sensitivity, as treated by the IPCC, but rather integral parts of it [4].
This analysis reinforces a fundamental point: climate feedbacks are not external modifiers of climate sensitivity; rather, they are inherent to the system. Their combined effect is already embedded in the climate response function. The IPCC’s treatment of feedbacks as additive components used to “explain” high sensitivities in GCMs is conceptually flawed. Physically, Earth’s climate is governed by the mass balance of water in all its phases: ice, snow, liquid, vapor, and clouds. The dynamics between these phases are temperature-sensitive, and they constitute the feedback processes. Feedbacks aren’t just add-ons to the climate system, they are our climate.
Ocean Heat Content increase
In the introduction, the “heat in the pipeline” concept: the idea that heat stored in the deep, cold ocean layers could later resurface to significantly influence surface temperatures, was challenged. Without a substantial decrease in surface temperatures to reverse ocean stratification, this seems highly unlikely. Large and rapid temperature fluctuations during the pre-industrial era with rates up to plus, but also minus 0.05 K/year over several decennia as recorded in the Central England Temperature (CET) series [27], more than three times the rate observed today, further undermine the notion of a slow-release heat mechanism dominating surface temperature trends.
Ocean Heat Content must be related to solar energy. It is the prime source of energy heating the Earth thermal system. Almost 1 W/m2 of that 240 W/m2 solar flux that is in average entering the system, is presently remaining in the oceans. This is an order of magnitude larger than the estimated 0.1 W/m2 of geothermal heat upwelling from the Earth inner core [11]. Extra greenhouse gasses don’t add energy to the system, but just obstruct cooling. As shown in Section 5.3, this accounts for a radiation imbalance offset τ dFGHG/dt, or equivalent to a contribution to dOHC/dt of only about 0.08 W/m2. . As redistribution of “heat in the pipeline” will not change the total OHC, roughly 3/4 of the observed positive trend in OHC must at least be attributed to rising solar input. The oceans act in this way as our climate system’s thermal buffer. It will mitigate warming during periods of increased solar input and dampen cooling when solar input declines, underscoring its critical role in Earth’s climate stability.
The strong downwards slope in the OHC before 1970 confirms the observation in Section 5.4 and expressed by (12) that around the turning point t = ζ, the forcing trend in the SW-channel had to be negative. Moreover, the rather slowly increasing 700-2000m OHC data in Fig.7 indicate that most of the fluctuations have occurred relatively close to the surface. Heat from e.g. seafloor volcanism as “warming from below”, is expected to show up more pronounced in this 700-2000m OHC-profile. Although we cannot rule out geothermal influences [29], this observation makes them less likely.
ERBE measurements of radiative imbalance.
As the OHC seems to be primarily coupled to SWIN, the most plausible cause would involve rapid changes in SW-forcing. A sudden drop in cloud-cover might explain such changes, but no convincing observations could be found for the 1960-1980 period. Alternatively, changes in the latitudinal distribution of cloud-cover as illustrated by Fig.6, can result in similar radiative impacts due to the stark contrast between a positive radiation imbalance in the Tropics and a very negative imbalance at the Poles. The ENSO-oscillations in the Pacific Ocean around the equator are a typical example for such influences, as also illustrated in Fig.3 [10]. Shifts in cloud distribution are linked to changes in wind patterns and/or ocean currents, reinforcing the idea as indicated in Section 1, that even minor disruptions in horizontal heat transport can trigger major shifts in our climate’s equilibrium [29, 30]. Sharp shifts in Earth’s radiation imbalance like the one around 1970 as inferred from Fig.7, may even represent one of those alleged tipping points. But in this case, certainly not one triggered by GHGs. Ironically, some climate scientists in the early 1970s predicted an impending (Little) Ice Age [31].
While additional data (e.g. radiation measurements) are needed to draw firm conclusions, the available evidence already challenges the prevailing GHG-centric narrative again. GHG emissions, with their near constant forcing rate, cannot account for the timing nor the magnitude of historical OHC trends, as NOAA explicitly suggests [32]. Similarly, claims by KNMI that “accelerations” in radiation imbalance trends are GHG-driven [1], are not supported by data. And finally, the alarms around “heat in the pipeline” must be exaggerated if not totally misplaced. Given the similarities in radiation imbalance and GHG forcing rates around 1970 with today’s situation, we must conclude that this assumed heat manifested itself at that time apparently as “cooling in the pipeline”.
However, warnings for continued warming even if we immediately stop now with emitting GHGs are nevertheless, absolutely justified. Only, it isn’t warming then from that heat in the pipeline due to historical emissions that will boost our temperatures. Warming will continue to go on as long as natural forcings will be acting. These are already today’s dominant drivers behind global temperature trends. And unfortunately, they will not be affected by the illusion of stopping global warming as created by implementing Net-Zero policies.
Summary and conclusions
This analysis demonstrates that a global warming scenario driven solely by greenhouse gases (GHGs) is inconsistent with more than 20 years of observations from space and of Ocean Heat Content. The standard anthropogenic global warming (AGW) hypothesis, which attributes all observed warming to rising GHG concentrations, particularly CO2, cannot explain the observed trends. Instead, natural factors, especially long-term increase in incoming solar radiation, appear to play a significant and likely dominant role in global warming since the mid-1970s.
The observed increase in incoming solar radiation cannot be accounted for by the possible anthropogenic side effects of Albedo- and Cloud-feedback. All evidence points to the conclusion that this “natural” forcing with a trend of about 0.035 W/m2/year is equal to, or even exceeds the greenhouse gas related forcing of about 0.019 W/m2/year. Based on these values, only 1/3rd of the observed temperature trend can be of anthropogenic origin. The remaining 2/3rd must stem from natural changes in our climate system, or more broadly, in our entire Earth’ thermal system.
Moreover, the observed increase in Earth’s radiation imbalance appears to be largely unrelated to GHGs. Instead, it correlates strongly with natural processes driving increased incoming solar radiation. Claims of “acceleration” in the radiation imbalance due to GHG emissions are not supported by the trend in accurately measured GHG concentrations. If any acceleration in global warming is occurring, it is almost certainly driven by the increasing flux of solar energy—an inherently natural phenomenon not induced by greenhouse gases.
In summary, this analysis challenges the notion that GHGs are the primary drivers of recent climate change. It underscores the importance of accounting for natural variability, especially in solar input, when interpreting warming trends and evaluating climate models.
Note: Dr. Ad Huijser, physicist and former CTO of Philips and director of the Philips Laboratories, describes himself as “amateur climatologist”. However his approach to climate physics is quite professional, I think.
Meanwhile, factory owners face further cost increases as they are asked to pay the extra bill for upgrading the country’s electricity grid through higher network charges. Worse, a scheme to protect the 500 most-intensive energy users from next year will be funded by all factories and businesses, making a bad situation worse for the vast majority.
…
Miliband, and more importantly Reeves, seem paralysed by indecision. They need to adopt the Stonehaven report or better still, take ownership of the gas supply industry. Labour has had 18 months to decide. Without a plan, the transition to net zero could wreck the manufacturing sector.
What is the Stonehaven report? The Stonehaven report was produced by Greenpeace, and advocates imposing price controls on gas companies, to stop them from cashing in when renewable output collapses.
Power Shift: how the Labour government can bring down bills and bolster net zero by curtailing the power of gas
…
Executive summary
The UK is facing an enduring energy affordability crisis that affects millions of households, undermines industrial competitiveness and slows progress on climate goals. Even though renewables are now the cheapest form of electricity generation, UK consumers and businesses continue to pay inflated electricity prices that are pegged to the extremely high and volatile price of gas.
The unaffordable gas-driven pricing of our electricity market has caused a cost of living crisis, forced the closure of many businesses and industries, and damaged our economy. Since 2021, our overreliance on gas and its volatile prices has forced the government to make £40 billion in emergency payments to help households cope with their soaring bills, after Russia’s invasion of Ukraine sent prices soaring. These inflated prices have resulted in the UK spending £90 billion more on gas than if prices had stayed the same, equivalent to £1,300 per person.
Now the Labour government has a unique opportunity to deliver an energy system that is fit for the future: providing energy security by ending reliance on fossil fuels, and unlocking cheaper renewable electricity for consumers and businesses by taking gas power out of the electricity market.
This new research by Greenpeace UK and Stonehaven outlines our recommendation to stop gas setting the price we pay for electricity and control the negative impacts of gas in the electricity market. Our recommendation is to bring gas plants into a Regulated Asset Base (RAB) system, administered by the National Energy Systems Operator (NESO). In this model, gas plants would provide a strategic reserve of energy, at an agreed price, when this is needed to meet electricity demand. This would ensure that gas plants get regular, stable returns, while keeping energy costs for the rest of the economy stable and noticeably lower.
This policy could be delivered – and start producing meaningful savings – in the next two years. Our analysis shows that it would result in annual bill savings across households and the economy of £5.1 billion in total in 2028. This represents a saving of £65 a year to the average household and £3.3 billion across all businesses and industry. Rapidly implementing our recommendation would contribute a significant amount towards the government’s vital pledge to lower household energy bills by £300 a year. Additional bills savings can be made via a range of alternative interventions, including moving policy levies into general taxation, extending the Contracts for Difference scheme to 25 years and improving energy efficiency, as outlined by E3G’s Clean Power Mission report.
As this paper shows, this is not just an energy policy – it is a social, economic and climate policy in one, enabling this Labour government to simultaneously lower bills, support vulnerable households, strengthen British industry and accelerate the clean energy transition.
The report claims gas plant operators would be fairly compensated based on the economic value of their assets, but given fossil fuels allegedly face imminent Net Zero enforced shutdown, that measure of “fair value” would probably be a long way from the value such assets would enjoy were they allowed to operate for their full planned life, and were not forced to withdraw from the market every time the wind blows or the sun shines.
And of course, hanging over any negotiation would be the possibility if gas plants don’t agree the plan, nod and smile, the British government could simply expropriate their assets – “take ownership of the gas supply industry”, as Britain is currently doing to the rail industry.
There is another possibility – following the electoral wipeout in the recent Welsh election, and a strong showing by the right wing climate skeptic Reform party, in one of Britain’s most left wing regions, Britain’s ruling Labour Party may be seriously considering dumping Net Zero.
Blair Institute urges Labour to reset clean energy plans in favour of ‘cheaper power 2030’
The Government is under increasing pressure to focus on lowering cost.
October 23rd 2025, 1:39 pm
Labour’s flagship clean power 2030 target is under fresh scrutiny after reports the government may quietly abandon the pledge, as a Tony Blair Institute paper urges ministers to focus instead on delivering “cheaper power 2030″.
Since taking office in 2024, Labour has embarked on a series of reforms aimed at scaling up the rollout of renewable and nuclear energy as part of its goal to phase out fossil fuels and achieve 95% decarbonised electricity in the UK grid by 2030.
Labour’s plans also include establishing GB Energy, a state-backed company intended to co-invest in clean-technology projects and support domestic supply-chain growth.
However, Labour’s decision to halt new North Sea oil and gas licensing and maintain a higher windfall levy has drawn criticism from the industry, which warns the policy risks undermining investment and jobs.
Amid growing pressure from the offshore sector, The Guardian reports that Labour ministers are considering a rethink of their energy strategy in an effort to counter the rise of Reform UK.
There is more at stake than Britain’s manufacturing sector. One of the other crown jewels of Britain’s economy, the London Banking sector, is also threatened by expensive energy. As AI driven financial trading becomes more of a thing, Britain’s Banking sector increasingly needs access to vast amounts of cheap energy to compete with other major trading centers. Banking directly contributes just under 5% to British government revenue, likely a lot more when you consider the constellation of service industries which support the banking sector. Unlike manufacturing, bankers can relocate by hopping on an airplane Fridan night, and be ready to continue trading the following Monday at already operational overseas trading centers. If the British Government loses the revenue it receives from the banking sector, it’s game over for the British economy.
Agriculture is also in trouble – between the rewilding craze, which aims to remove access to vast tracts of land and give them over to weeds, to punitive attacks on the use of agricultural chemicals and fertilisers, Britain will be lucky to have any food production left by the middle of this century.
Time is short. British manufacturing is enduring a sharp contraction, high revenue mobile industries like banking must be weighing up their options, and Agriculture is clinging on by their fingernails. Every moment the British government hesitates to follow President Trump’s example and ditch Net Zero adds to the risk the British economy will suffer a catastrophic economic collapse, which might take decades or even centuries to reverse.
As all good true believers know, the only reason that Socialism has thus far always failed in practice is that real Socialism has never yet been implemented. And thus we have my home town of New York, until now the world capital of capitalism, about to put into office a self-proclaimed Socialist, or maybe Communist, to give Socialism just one more shot.
As all good true believers know, the only reason that Socialism has thus far always failed in practice is that real Socialism has never yet been implemented. And thus, we have my hometown of New York, until now the world capital of capitalism, about to put into office a self-proclaimed Socialist, or maybe Communist, to give Socialism just one more shot.
How could large numbers of seemingly intelligent people believe that this could work? One reason is a remarkable lack of news coverage of the economic status and trajectory of the places that avowedly practice Socialism. My mission here at Manhattan Contrarian is to fix that.
Consider Bolivia. Have you read anything about it lately? They had a presidential election last week, which merited some small interior articles in newspapers I read. The articles I saw before starting to research the topic barely mentioned the current economic situation and did not mention at all the economic trajectory since the Socialists took power back in 2006.
In the election, which was held on October 20, the nearly 20-year Socialist government has just been voted out by a huge electoral majority. The back story is that the effort to implement Socialism had failed disastrously, as it always does. But just as important is the trajectory followed by the economy under Socialist rule. Here’s the summary: first, an early period of euphoria, where Socialist prescriptions like nationalizations of large businesses (in Bolivia, particularly natural gas sector) funded extensive handouts to government supporters; then a period where the nationalized industries gradually declined until they could not support the handouts any longer; and finally, the inevitable economic crisis and collapse.
{W]hen you look at statistics coming out of fully or largely socialized economies, . . . what you find is that the official statistics for years and decades show growth comparable to, and sometimes faster than, that in capitalist economies; and then one day, it all falls apart.
Here was my analysis of how this works:
Of course the numbers had been fictitious all along. There really was a gradual decline going on, but the numbers didn’t show it. And, without knowing all the tricks [used to cook the books in Socialist countries], the main one is obvious, namely counting all or most government spending as a full addition to GDP. Where government owns the main businesses and controls most of the distribution of resources, not to mention prices, the measure of GDP becomes more and more arbitrary.
Now to the case of Bolivia. I had a series of posts about Bolivia in October and November 2019, here, here and here. The occasion was a previous presidential election held on October 20 of that year. Socialist President Evo Morales was finishing his third term and running for a fourth. Unfortunately, the Bolivian Constitution limited him to three terms; but as the saying goes about Socialists, “you can vote them in, but you have to shoot them out.” In September 2019, Morales had just gotten his subservient Supreme Court to invalidate the constitutional term limit as contrary to his “human rights.”
In the run-up to that election, on October 1, 2020, The Nation ran the expected big piece touting the spectacular success of the Socialist government, 13 years into its rule. The headline was, “Bolivia’s Remarkable Socialist Success Story.” In my October 3, 2019 post I had some long quotes from that piece, which I will repeat here:
Since taking office in 2006, [President Evo] Morales, a former coca grower and labor activist, has nationalized key industries and used aggressive social spending to reduce extreme poverty by more than half, build a nation with modern infrastructure, and lower Bolivia’s Gini coefficient, a measure of income inequality, by a stunning 19 percent. For much of Bolivia’s majority-indigenous population in particular, his tenure marks the first time that they’ve lived above poverty and benefited from their country’s tremendous natural resources.
It’s now clear that a redistributionist agenda has not been ruinous to Bolivia’s economy. Far from it: During the Morales era, the economy has grown at twice the rate of the Latin American average, inflation has been stable, the government has amassed substantial savings, and an enterprising and optimistic indigenous middle class has emerged. . . .
Morales also dramatically increased social spending. He poured money into building roads, schools, and hospitals, an expansion of infrastructure that was particularly transformative in the countryside. And he established modest but deeply popular cash transfer programs. . . .
But my post then asked if, even if official government statistics seemed to be showing success, there might be another perspective on what was going on. I found a piece at Bloomberg from February 2019, headline “So Much Gas, So Few Allies Spells Trouble in Populist Nation.” The gist was that Bolivia had long been the only big natural gas producer in its region, which had enabled it to charge premium prices to places like Brazil and Argentina. But those countries were gradually figuring out ways to access cheaper supplies. Oh, and Bolivia’s gas production was also sharply dropping due to lack of investment under the socialist government:
“Basically, there’s a new game in town that has broken the Bolivian monopoly on natural gas in South America,” said Fernando Valle, an oil and gas analyst at Bloomberg Intelligence. “When you have super high margins somewhere, someone is eventually going to find a way to go into that market and undercut you. That’s what’s happening to the Bolivians now.” . . . In 2018, Bolivia’s gas exports fell by about 30 percent, drastically impacting the government’s revenue and the entrance of foreign currency . . . .
The cracks had already begun to appear, even if the cheerleaders at the Nation didn’t choose to see them.
In the October 20, 2019 election, returns on election night appeared to show Morales going down to defeat. But then the vote count was stopped, with no reason given. The next morning, Morales’ people announced that in the final tally their man had won just enough votes to be re-elected without a run-off.
There was an immediate explosion of protests over the election result. Morales called in the OAS to perform a review, and they issued a Report in November. My November 11, 2019 post captured the flavor:
[T]he [OAS] Report makes clear that the efforts of Morales and his people to rig the election were remarkably obvious, crude and amateurish. . . . Really, Evo, you should have been flunked out of Evil Dictator School for having learned so little about how to properly rig an election.
Within weeks, Morales had resigned. Bolivia went through a year of turmoil, leading up to a re-run of the election in October 2020. The victor was Morales’ Socialist side-kick Luis Arce, who has held the presidency since then.
So the Socialists have had another five years to fix the problems and get their program to work. How has that gone? The key industry in Bolivia for funding the Socialist dream has been natural gas production. OilPrice.com had an article on August 28, with data sourced to Rystad Energy. The chart includes data from 2014 to 2025, and projections to 2033:
Bolivia gas production, consumption, and exports
Production has fallen by nearly half since 2014, with declines accelerating in the past few years. I guess that every dollar you reinvest in producing gas is one dollar less that’s available to buy votes.
Bolivia’s economy is on the brink of collapse. . . . Facing reelection, [President] Arce refused to cut public spending, reduce subsidies, or liberalize the economy. Instead, the government imposed price controls, stricter currency regulations, and restrictions on importers’ access to dollars. This led to severe shortages of fertilizers, medicines, fuel, cleaning supplies, and food. Prices skyrocketed, and distrust in the boliviano grew. People rushed to exchange bolivianos for US dollars, which were scarce. The central bank imposed further restrictions, pushing demand to the informal market—common in countries like Venezuela or Argentina. Two exchange rates emerged. . . . Given the current trajectory, Bolivia could be headed for a crisis similar to Argentina’s in 2001 or even Venezuela’s. . . .
In short, it’s the same old story. According to the latest data from the IMF, Bolivia’s per capital GDP in 2025 is $4,585. By contrast, the U.S. per capita GDP is given as $89,599.
In the first round of the recent presidential election, held back in August, the MAS party of Morales and Arce got just 3.2% of the vote. That’s what they call “beyond the margin of fraud,” and it looks like they completely gave up on rigging the election. The run-off, held October 20, was between candidates described by NPR here as a “centrist” and a “conservative.” The “centrist,” Rodrigo Paz, won.
NPR says that voters were “outraged by the country’s economic crisis and frustrated after 20 years of rule by the Movement Toward Socialism party.” NPR also notes that Paz had “gained traction among working-class and rural voters disillusioned with the unbridled spending” of the Morales/Arce/MAS regime.
Paz takes over in a very difficult situation handed to him by his Socialist predecessors. In the first instance he will have to withdraw the pervasive handouts that the Socialists have put in place. That is not going to be popular. At least Bolivia didn’t have to shoot the Socialists out of office. But they have a very deep hole to dig out of.
Recent warming is mostly due to natural climate factors…only 1/3 is attributable to the rising GHG concentrations.
CO2’s impact on warming is likely wildly overstated.
A recent paper by Ad Huijser, “Global Warming and the ‘impossible’ Radiation Imbalance,” published in Science of Climate Change, presents a detailed analysis that challenges the widely held assumption that rising greenhouse gas (GHG) concentrations are the sole, or even the primary, drivers of recent global warming.
By comparing observed energy trends with theoretical forcings, the study concludes that natural factors play a significant and dominant role in the warming observed since the mid-1970s.
The Discrepancy: GHG Forcing vs. Observed Warming
The study scrutinizes the Anthropogenic Global Warming (AGW) hypothesis, which attributes all observed warming solely to human-caused GHG emissions. Using satellite data from the CERES program and Ocean Heat Content (OHC) data from the ARGO float program, the author analyzed the Earth’s Top of Atmosphere (TOA) radiation imbalance—the net energy flux into the Earth’s thermal system.
Natural factors dominate
The central finding is that the assumed radiative forcing trend from GHGs is insufficient to account for the magnitude of the observed TOA radiation imbalance. The discrepancy suggests that another, significant factor must be involved in heating the planet.
The analysis points strongly toward natural forcings, specifically a long-term increase in incoming shortwave solar radiation, as the significant, dominant factor.
The paper’s findings:
Two-thirds of the observed global warming must be attributed to natural factors that increase incoming solar radiation. This is due to a natural forcing trend of about 0.035 W/m2.
Only one-third is attributable to the rising GHG concentrations. This is due to a GHG-related forcing of about 0.019 W/m2.
This increase in incoming solar energy is likely due to natural changes in factors like cloud cover and surface albedo (the reflectivity of the Earth’s surface). The study argues that the observed radiation imbalance correlates strongly with these natural processes, appearing largely unrelated to GHGs.
Implications for Future Climate Policy
The study’s findings show the planet’s warming is largely being driven by external factors (increased solar input) and not solely by an internal atmospheric resistance (GHGs), thus implying a much lower climate sensitivity than that suggested by most IPCC-endorsed Global Circulation Models (GCMs).
This new paper questions the alarmist claims about “heat in the pipeline” and suggests that future warming will be driven by natural forcings as long as they are acting, rather than historical emissions.
It underscores the importance of fully accounting for natural variability, especially in solar input, when evaluating both historical warming trends and the effectiveness of future climate mitigation policies.
The U.S. Department of Energy is urging the heads of State in the European Union (EU) to repeal or significantly change climate regulations adopted in July 2024 that require companies to conduct due diligence to prevent adverse human rights and environmental impacts across the supply chain, DOE said Wednesday.
The U.S. Department of Energy is urging the heads of State in the European Union (EU) to repeal or significantly change climate regulations adopted in July 2024 that require companies to conduct due diligence to prevent adverse human rights and environmental impacts across the supply chain, DOE said Wednesday.
DOE joined Qatar in sending a letter to the European leaders.
“As two of its most trusted partners and the world’s leading LNG producers, we reaffirm our deep commitment to supporting the EU’s prosperity and stability,” the two governments began the letter.
“We write in this spirit, united in our views, to express our deep concern over the continued lack of action to address the universally acknowledged, serious, and legitimate concerns raised by the global business community regarding the Corporate Sustainability Due Diligence Directive (CSDDD). Particularly its unintended consequences for LNG export competitiveness and the availability of reliable, affordable energy for EU consumers,” DOE Secretary Chris Wright and Qatari Minister of State for Energy Affairs Saad Sherida Al-Kaabi wrote in the letter.
In 2024, U.S. LNG exporters supplied approximately 45% of Europe’s LNG needs while Qatar supplied about 12%, according to the European Commission.
The two governments urged reconsideration of Articles 2 and 22, which mandate that companies registered outside the EU generating net turnover of more than €450 million must submit detailed plans showing how they will meet climate goals compatible with limiting global warming to 1.5°C, as required by the Paris Agreement signed in 2016.
The U.S. and Qatar governments have objected to Articles 27 and 29, which include provisions related to the financial penalties and civil liabilities of companies deemed non-compliant. As the regulations are currently written, financial penalties could potentially reach 5% of a company’s global turnover.
“We have consistently and transparently communicated how the CSDDD, as it is worded today, poses a significant risk to the affordability and reliability of critical energy supplies for households and businesses across Europe and an existential threat to the future growth, competitiveness, and resilience of the EU’s industrial economy,” wrote U.S. Energy Secretary and Qatari Energy Minister.
U.S. business groups opposing the directive include the Chamber of Commerce, the American Petroleum Institute, the Business Roundtable, and the National Association of Manufacturers.
In December 2024, the business groups collectively sent a letter expressing their concerns to South Carolina U.S. Sens. Tim Scott and Linsdey Graham and to U.S. Rep. Jim Jordan, R-OH, and Patrick McHenry, R-NC, now retired. Near the same time, Qatar’s Kaabi vowed to stop selling gas to the EU if fined under due diligence regulations, MSNBC reported.
In August, the EU committed to undertake efforts to ensure that the sustainability directive includes provisions reducing administrative burdens on businesses, including small- and medium-sized enterprises, and to propose changes to the requirement for coordinated civil liability rules. To date, the EU Parliament has not reported further actions related to the directive.
The U.S. and Qataris said in the letter that a continuation of the climate regulations could disrupt trade and investments across nearly all EU economies. “Its implementation could jeopardize existing and future investments, employment, and compliance with recent trade agreements,” the letter said.
The European Parliament reportedWednesdaythat its members are considering changes to the climate directive and related regulations that would reduce administrative burdens on companies, with a vote on simplified sustainability and due diligence rules scheduled ahead of a plenary session in Brussels on Nov. 13, although no specifics were provided.


You must be logged in to post a comment.