Michael Mannโ€™s โ€œFire Hoseโ€ of Misinformation: Projection at Its Finest

In his latest op-ed for theย San Francisco Chronicleย โ€” melodramatically titledย โ€œIโ€™m a climate scientist. Trumpโ€™s U.N. address is a fire hose of misinformationโ€โ€” Mann plays the role of truth-teller, warning the public about Donald Trumpโ€™s supposedly dangerous rhetoric at the United Nations. According to Mann, nearly โ€œevery single word [Trump] spoke drips with mendacity.โ€

A man with long, dark hair and a beard, sitting at a table with a glass of milk in front of him, looking contemplative while saying 'Really?'

From Watts Up With That?

By Anthony Watts

Dr. Michael Mann is at it again.

In his latest op-ed for the San Francisco Chronicle โ€” melodramatically titled โ€œIโ€™m a climate scientist. Trumpโ€™s U.N. address is a fire hose of misinformationโ€โ€” Mann plays the role of truth-teller, warning the public about Donald Trumpโ€™s supposedly dangerous rhetoric at the United Nations. According to Mann, nearly โ€œevery single word [Trump] spoke drips with mendacity.โ€

But when you peel back the grandiose framing, Mannโ€™s essay reads less like the sober analysis of a scientist and more like the polemic of an activist. Worse, much of what he accuses Trump of doing โ€” cherry-picking, exaggerating, revising history, and fearmongering โ€” is precisely what Mann himself has perfected over the last 25 years.

So, if Mann wants to talk about โ€œfire hoses of misinformation,โ€ then letโ€™s have that conversation. But letโ€™s do it honestly.

Mann the Politician, Not the Scientist

Early in the piece, Mann frames Trumpโ€™s speech as part of an โ€œanti-science agendaโ€. This is a rhetorical sleight of hand heโ€™s used for decades: conflate โ€œscienceโ€ with โ€œMichael Mannโ€™s opinions about climate policy.โ€ Anyone who questions him is not engaging in debate, but waging war on science itself.

This is not how science works. Science is not a political loyalty oath, nor is it a courtroom drama (though Mann has spent more time in the courts than most scientists). It is about predictions, testing, and falsification. And this is where Mannโ€™s own record collapses under scrutiny.

Mannโ€™s Hurricane Prediction Debacle

If Trumpโ€™s speech was a โ€œfire hoseโ€ of questionable claims, then Mannโ€™s hurricane predictions over the past decade are a burst water main.

Letโ€™s look at his hurricane forecast record: (h/t to WUWT reader RelPerm)

  • 2024:ย Predicted 33 storms. Actual: 18.ย Missed by nearly half.
  • 2023:ย Predicted 15.9 ยฑ 4. Actual: 20.ย Missed again.
  • 2022:ย Predicted 14.9 ยฑ 3.8. Actual: 14.ย Close only because the error bars are wide enough to drive a truck through.
  • 2021:ย Predicted 11.9 ยฑ 3.4. Actual: 21.ย Almost double the forecast.
  • 2020:ย Predicted 19.8 ยฑ 3.4. Actual: 30.ย Off by 10 storms.
  • 2019:ย Predicted 10.9 ยฑ 3.2. Actual: 18.ย Way off.
  • 2018:ย Predicted 10.2 ยฑ 3.2. Actual: 15.ย Miss.
  • 2017:ย Predicted 15.3 ยฑ 3.9. Actual: 21.ย Miss.
  • 2015:ย Predicted 6.9 ยฑ 2.6. Actual: 11.ย Miss.
  • 2014:ย Predicted 9.3 ยฑ 3.0. Actual: 6.ย Miss.

For a man so fond of lecturing others about accuracy, his record predicting storms is nothing short of embarrassing. You shouldnโ€™t be predicting hurricanes to a tenth of a storm in the first place โ€” the false precision itself is absurd. But to then miss repeatedly, year after year, while still posturing as an unimpeachable authority? That takes gall.

And yet, this is the same Mann who denounces others as โ€œanti-scienceโ€ for questioning climate models. If he held himself to the same standard he applies to Trump, heโ€™d be out of the business.

The 1970s Cooling Scare: A Case of Selective Memory

Mann sneers at Trump for referencing the 1970s cooling scare, calling it a โ€œmyth promoted by climate deniersโ€. According to him, no serious scientists predicted global cooling โ€” only a few isolated speculations about aerosols.

This is revisionist history.

In fact, a survey of the peer-reviewed literature from that era shows that roughly two-thirds of climate papers published between 1965 and 1979 predicted cooling. Titles like โ€œโ€œBrace Yourself for Another Ice Ageโ€ (Science Digest, 1973) and โ€œThe Cooling Worldโ€ (Newsweek, 1975) werenโ€™t invented by skeptics decades later; they reflected real scientific debate at the time.

Even Americaโ€™s most trusted news anchor at the time, Walter Cronkite of CBS News, told viewers in 1972 that โ€œBritish professor Hubert Lamb says that a new ice age is creeping over the Northern Hemisphere.โ€

Hilariously, the New York Times ran a contradictory 1992 headline: โ€œScientists Suggest Global Warming Could Hasten the Next Ice Age.โ€

To erase this history โ€” to insist that โ€œthe scientific community never predicted coolingโ€ โ€” is itself misinformation. Mannโ€™s own students, if they were taught honestly, could find these papers in any library archive.

Mann also recycles one of his favorite talking points: that Exxonโ€™s scientists in the 1980s โ€œsecretly predicted the precise planetary warming that has occurredโ€.

This claim has been debunked time and again. Exxonโ€™s internal memos explored scenarios โ€” not predictions. They acknowledged wide uncertainty and explicitly cautioned that outcomes were speculative. Thatโ€™s what responsible research does: it brackets possibilities.

But in activist hands, those memos have been twisted into prophecies of doom, weaponized as โ€œExxon Knewโ€ talking points. What Mann calls โ€œprecise predictionsโ€ were in reality rough sketches. Presenting them otherwise is deliberate misrepresentation.

Perhaps the most brazen claim in Mannโ€™s op-ed is that climate impacts are โ€œactually exceeding the scientific predictionsโ€.

Letโ€™s check the facts:

  • Wildfires:ย U.S. burn acreage has declined dramatically since the 1930s. Global wildfire trends are downward.
  • Hurricanes:ย No increase in global frequency. Accumulated Cyclone Energy (ACE) fluctuates but shows no long-term rise.
  • Tornadoes:ย U.S. strong tornado counts (EF3+) have trendedย downwardย since the 1970s.
  • Floods:ย Deaths from flooding worldwide are at record lows thanks to better infrastructure and warning systems.

Mann ignores all of this. Instead, he cherry-picks every bad-weather headline and presents it as proof that the apocalypse is here. This isnโ€™t science; itโ€™s confirmation bias with a press pass. Mann ends with a flourish, warning that Trump is carrying out a โ€œplan laid down by plutocrats and pollutersโ€.

This is Mannโ€™s trademark move: anyone who disagrees with him is not just mistaken, but corrupt. Theyโ€™re oil-funded shills, anti-science zealots, existential threats to humanity. Itโ€™s an intellectually lazy way to shut down debate, and itโ€™s a tactic he has used on fellow scientists as well as politicians.

The irony, of course, is that Mannโ€™s own career has been a masterclass in politicizing science โ€” from the infamous โ€œhockey stickโ€ graph (produced with dubious statistical tricks) to his ongoing legal crusades against critics. He is not the impartial defender of truth he pretends to be; he is a partisan warrior, wielding โ€œscienceโ€ as a cudgel.

In the end, Mannโ€™s essay is not a sober takedown of Trumpโ€™s speech. Itโ€™s projection.

  • He accuses Trump of misinformation while spreading his own.
  • He mocks Trump for imprecision while missing his own forecasts by miles.
  • He accuses Trump of rewriting history while doing precisely that with the 1970s cooling scare.
  • He accuses Trump of serving plutocrats while himself serving the political machinery of climate alarmism, where research grants, media attention, and policy influence flow only to those who stay on message.

If the public today is drinking from a โ€œfire hose of misinformation,โ€ itโ€™s because Michael Mann has had his thumb on the spigot for decades.

The Bottom Line

Michael Mann has built his career not on scientific precision, but on the art of narrative control. He takes a kernel of science, strips away the nuance, exaggerates the worst-case scenarios, and then uses the result to bludgeon his opponents. As Iโ€™ve always said, channeling Carl Sagan: Manntastic claims require Manntastic evidence. Yet, all the supposed evidence is only in his head.

This is not science. Itโ€™s advocacy dressed up as inevitability.

So, when Mann declares himself the authority on misinformation, we should remember: this is the same man whose hurricane forecasts flopped year after year, who rewrites climate history, and who has turned science into a weapon for political warfare.

If anything in this debate deserves to be called a โ€œfire hose of misinformation,โ€ itโ€™s Michael Mannโ€™s op-ed itself.

September 2025 Arctic Ice Beatsย Expectations

The experts involved in SIPN are expected SII 2025 September to be somewhat lower than recent years, but Arctic ice extents exceeded the 19-year averages.

Vast expanse of Arctic sea ice broken by patches of open water, under a gray sky.

From Science Matters

Byย Ron Clutz

Bar chart displaying July 2025 sea ice outlook predictions by various contributors, illustrating predictions in square kilometers for statistical and dynamical models.
Figure 1. Distribution of SIO contributions for July estimates of September 2025 pan-Arctic sea-ice extent. Public/citizen contributions include Sun.

July 2025 was the final report of the Sea Ice Prediction Network (SIPN) before the actual September monthly extent is reported by NOAA Sea Ice Index (SII). The report (link in red) gave this overview.

2025: July Report from Sea Ice Prediction Network

The July 2025 Outlook received 22 pan-Arctic contributions (Figure 1). This yearโ€™s median forecasted value for pan-Arctic September sea-ice extent is 4.27 million square kilometers with an interquartile range of 4.13 to 4.54 million square kilometers. This is lower than observed in 2023 (4.37 million square miles) and 2024 (4.35 million square miles) observed in September. The lowest sea-ice extent forecast is 3.38 million square kilometers, from Sun, which would be a new record low for the satellite period (1979-present); the highest sea-ice extent forecast is 5.17. . . The observed extent values are from the NSIDC Sea Ice Index (Fetterer et al., 2017), based on the NASA Team algorithm sea ice concentration fields distributed by the NASA Snow and Ice Distributed Active Archive Center (DAAC) at NSIDC (DiGirolamo et al., 2022; Meier et al., 2021). 

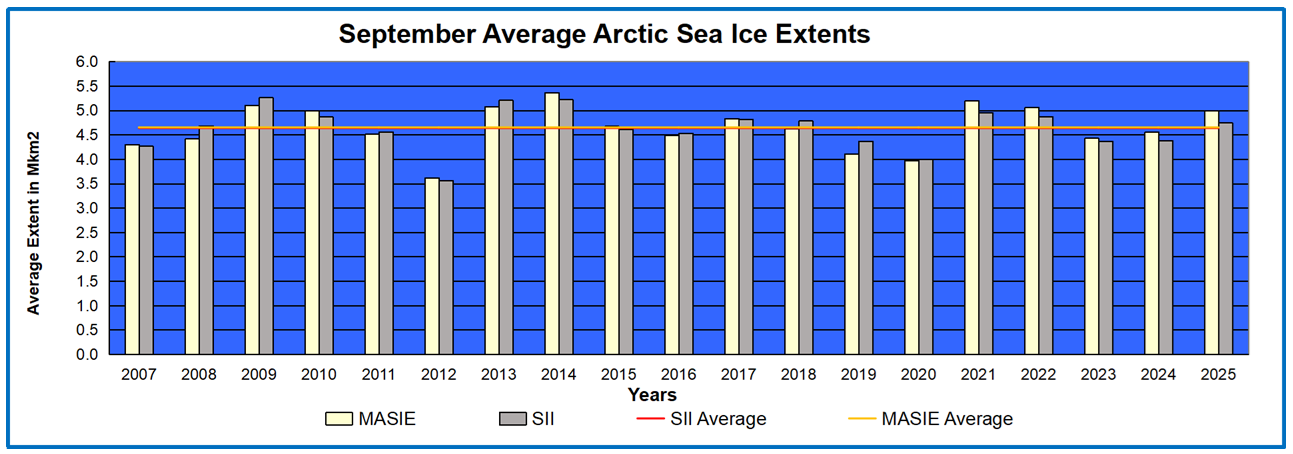
These are predictions as of August 20 for the September 2025 monthly average ice extent reported by NOAA Sea Ice Index (SII). This post provides a look at the 2025 September monthly averages comparing MASIE and SII datasets. (19 year average is 2007 to 2025 inclusive).

Bar graph showing September average Arctic sea ice extents from 2007 to 2025, with MASIE and SII averages indicated in different colors.

SIP network predicted SII would be 4.27M km2, and the actual result is 4.7M, while MASIE reported 5.0M km2.

The table below provides the monthly Arctic ice extent averages for comparisons (all are M km2)

MonthlyMASIE 2025SIIv.4 2025MASIE -SIIMASIE-19yr AVESIIv.4-19yr AVE
Jan13.20613.1310.075-0.583-0.470
Feb13.80213.7450.057-0.878-0.715
Mar14.27414.1400.134-0.587-0.545
Apr13.84613.910-0.063-0.249-0.109
May12.49712.559-0.062-0.119-0.108
June10.51010.4850.025-0.306-0.388
July7.9427.6600.282-0.345-0.375
Aug5.8545.3950.459-0.020-0.220
Sept4.9904.7450.2450.2980.050

The first two data columns are the 2025 YTD shown by MASIE and SII, with the MASIE surpluses in column three.ย  Column four shows MASIE 2025 compared to MASIE 19 year averages, while column five shows SII 2025 compared to SII 19 year averages.ย  ย 

MASIE started the year in deficits to average but recovered in spring to virtually match average in August, and now 298k km2 above average. SII was below its averages throughout and much lower than MASIE in July, and in August down by nearly half a Wadham. That gap reduced to -245k km2 in September.

Current Arctic Ice Extent Conditions

Line graph comparing September Arctic ice extents from MASIE and SII v.4 datasets for years 2007 to 2025, showcasing trends over days.

The month of September shows the annual dip in arctic ice extents, then recovering to end slightly higher than the beginning.  Note MASIE 2025 started 170k km2 above average and ended 316k in surplus. SII v.4 began 319k km2 in deficit to MASIE and ended 153k lower.

The table below shows the distribution of ice over the Arctic regions ofr yesterday September 30, 2025, in comparison with the MASIE average and some other years of note.

Region2025273Day 273 ave.2025-Ave.20072732025-2007
 (0) Northern_Hemisphere5265296494715731813940868831178413
 (1) Beaufort_Sea5677765464762130149874369033
 (2) Chukchi_Sea38299122074716224451382940
 (3) East_Siberian_Sea502004299345202660311501693
 (4) Laptev_Sea22945116869460758235245-5793
 (5) Kara_Sea99236279-3528715367-14375
 (6) Barents_Sea013476-134764851-4851
 (7) Greenland_Sea170295239645-69350353210-182915
 (8) Baffin_Bay_Gulf_of_St._Lawrence7793055264226654224735682
 (9) Canadian_Archipelago379648370610903830713572513
 (10) Hudson_Bay50713054201719363135
 (11) Central_Arctic29475682992334-447662626511321057

The massive surpluses in Eurasian basins of Chukchi, E. Siberian and Laptev more than offset smaller deficits in Atlantic basins Kara and Greenland seas. The over surplus was 318k km2 or 6.4%, and exceeded 2007 by 1.2 wadhams of ice extents.

Summary

The experts involved in SIPN are expected SII 2025 September to be somewhat lower than recent years, but Arctic ice extents exceeded the 19-year averages.

Footnote:

Some people unhappy with the higher amounts of ice extent shown by MASIE continue to claim that Sea Ice Index is the only dataset that can be used. This is false in fact and in logic. Why should anyone accept that the highest quality picture of ice day to day has no shelf life, that one yearโ€™s charts can not be compared with another year? Researchers do this, including Walt Meier in charge of Sea Ice Index. That said, I understand his interest in directing people to use his product rather than one he does not control. As I have said before:

MASIE is rigorous, reliable, serves as calibration for satellite products, and continues the long and honorable tradition of naval ice charting using modern technologies.

More on this at my postย Support MASIE Arctic Ice Dataset

A gold seal of approval featuring a star in the center, surrounded by a laurel wreath, with a blue ribbon and the text 'SEAL OF APPROVAL' at the bottom.

MASIE: โ€œhigh-resolution, accurate charts of ice conditionsโ€
Walt Meier, NSIDC, October 2015 article in Annals of Glaciology.

Mediaโ€™s Psyop Against Climate Scientists

A coordinated offensive unfolded with precision September 2 against five scientists questioning the popular mediaโ€™s most sacred bogeyman โ€“ the hypothesis that human-induced emissions of carbon dioxide threaten to overheat the planet.

Portraits of five scientists featured in a critical review of greenhouse gas emissions on U.S. climate, with the U.S. Department of Energy logo in the center.

From CO2 Coalition

By Vijay Jayaraj

A coordinated offensive unfolded with precision September 2 against five scientists questioning the popular mediaโ€™s most sacred bogeyman โ€“ the hypothesis that human-induced emissions of carbon dioxide threaten to overheat the planet.

The scientists attacked had written a report published in July by the U.S. Department of Energy (DOE), โ€œA Critical Review of Impacts of Greenhouse Gas Emissions on the U.S. Climate.โ€

Delivering virtually identical narratives, proclaiming that 85 โ€œclimate expertsโ€ had discreditedthe DOE report, were CBS, NPR, ABC, CNN, The New York Times, Los Angeles Times, Reuters and others.

Language in the news reporting was nearly indistinguishable, and the focus identical: a number (โ€œ85โ€ or โ€œdozensโ€), a designated group (โ€œscientistsโ€ or โ€œexpertsโ€) and a verdict (โ€œflawed,โ€ โ€œlacks merit,โ€ โ€œfull of errorsโ€). This is not the natural variance of independent newsrooms pursuing a story. This is the result of a shared press release, a common source or a backroom agreement to push a common story line.

It was a master class in singing the same tune that would make any propaganda ministry proud โ€“ a calibrated flash mob of climate-fear messaging in an explicitly partisan tone.

Fooling the Public

The first volley of the assault was a classic ad hominem attack. The authors of the DOE report, five of the worldโ€™s most distinguished and academically rigorous researchers of climate issues, were immediately branded as the โ€œTrump Team.โ€

This is a deliberately dishonest tactic. The authors โ€“ Drs. John Christy, Judith Curry, Steven Koonin, Ross McKitrick, and Roy Spencer โ€“ are not political operatives. They are scientists with decades of experience and hundreds of peer-reviewed publications.

Dr. Koonin served as Undersecretary for Science in the Department of Energy under President Obama, a fact conveniently omitted from most of the mediaโ€™s hit pieces. Drs. Christy and Spencer are world-renowned for developing the first global temperature dataset from satellites, for which they received NASAโ€™s Medal for Exceptional Scientific Achievement.

No mention that Ross McKitrick is a Canadian academic with no political ties. No mention that Judith Curry stepped away from academia partly because of the politicization of climate research and previously had been much sought after for her research into hurricane intensity.

Most critically, the authors themselves have stated that there was no oversight or compulsion from anyone in any government department during the creation of their report. They say they crafted the report independently, with no interference from Energy Secretary Chris Wright. But the media gloss over that. Instead, the scientists are derided as the โ€œTrump team.โ€

In stark contrast to the vilified DOE authors, the 85 individuals who signed the critical letter were anointed as โ€œclimate expertsโ€ and โ€œleading scientists.โ€ Yet, the list of signers is padded with individuals whose specializations are, to put it generously, tangential to the core issues of climate science.

The strategy is clear: assemble a gaggle of academics, label them โ€œclimate expertsโ€ and use the sheer number to create an illusion of overwhelming scientific consensus against the DOE report.

Sell Lies, Instill Fear With a โ€˜Black Mirrorโ€™

Adding to the theater, the National Academies of Sciences, Engineering, and Medicine (NASEM) has announced a panel to review the DOE report. But hereโ€™s the twist: The panel is headed not by a climate scientist, but by a biologist. Out of the panelโ€™s members,ย only a few haveย direct expertise in atmospheric science. Yet the announcement was trumpeted as if the nationโ€™s top climate experts were mobilized.

Predicting catastrophe is a media business model. NPRย warnedย of โ€œirreversibleโ€ sea-level rise in 2023, ignoring tide gauge records that showย no accelerationย beyond historical norms. News outlets regularly report on โ€œunprecedentedโ€ floods, yet data indicateย no uptick in floodsย due to climate change.

If everybody believed climate impacts were manageable, the case for sweeping carbon taxes, bans on fossil fuels and subsidies for wind and solar energy would collapse. Thatโ€™s why the DOE report โ€“ noting forecasting uncertainty, adaptation possibilities and economic trade-offs โ€“ is so threatening. It undermines a narrative of an โ€œexistentialโ€ threat or imminent collapse. So, the media did not debate the five scientists; they sought to destroy them and their report. Not with data, but with labels.

This is a psyops initiative like depicted in the Netflix dystopian series โ€œBlack Mirror.โ€ The media outlets are not mirrors reflecting reality; they are black screens projecting a manufactured one. They have become instruments of a political agenda, sacrificing journalistic integrity to enforce a specific viewpoint on climate change. They operate not as individual watchdogs but as a wolf pack. They decide what you should think and seek to broadcast it in unison until you do.

This commentary was first published by Daily Caller on September 22, 2025.

Vijay Jayaraj is a Science and Research Associate at the COโ‚‚ Coalition, Fairfax, Virginia. He holds an M.S. in environmental sciences from the University of East Anglia and a postgraduate degree in energy management from Robert Gordon University, both in the U.K., and a bachelorโ€™s in engineering from Anna University, India.

Whatโ€™s New!

CO2 Coalition recently filed two Endangerment Finding Comments to EPA:

CO2 Coalition Comment #1 on EPA Endangerment Finding

CO2 Coalition Comment #2 on EPA Endangerment Finding

The Endangerment Finding comment period has now ended.

The entire House of Cards of rules and regulations enacted to solve the nonexistent climate crisis are built on this one ruling and it will come tumbling down when it is overturned.

UN, EU, ICJ, climate cabal want to keep the poor impoverished

On the evening of September 30, 1882, Henry Rogers turned a switch, and theย Hearthstone Historic Houseย living room in Appleton, Wisconsin (my motherโ€™s hometown) was bathed in a soft amber glow. Hearthstone became the first home in the world lit by electricity.

A misty, overgrown urban landscape featuring crumbling buildings and fallen debris, with a large ferris wheel partially visible in the background.

CFACT

By Paul Driessen

A glowing candle next to a light bulb, symbolizing the contrast between traditional and modern forms of lighting.

On the evening of September 30, 1882, Henry Rogers turned a switch, and the Hearthstone Historic House living room in Appleton, Wisconsin (my motherโ€™s hometown) was bathed in a soft amber glow. Hearthstone became the first home in the world lit by electricity.

Today, few can imagine our lives without plentiful, reliable, affordable electricityโ€“for lights, computers, washers, dryers, dishwashers, heating, air conditioning, television, vehicles, hospitals, schools, factories, data centers, artificial intelligence, and moreโ€“to light, improve, and sustain our lives.

And yet, nearly 750 million people still have no access to electricity. Billions more have minimal, sporadic access. The vast majority live in sub-Saharan Africa: 600 million with no electricity; hundreds of millions more with minimal or sporadic power. Many Asians and Latin Americans are similarly deprived. Often, electrification rates are high in cities but extremely low in the countrysides.

Incredibly, across much of Europe, millions of poor and middle-class families are also deprived. Many simply cannot afford electricity prices that have skyrocketed in the wake of coal, gas, and nuclear power plant closures, in favor of wind and solar installations.

Other Europeans no longer have jobs, because factories and entire industries that cannot afford those prices closed down and sent their jobs to China and other coal-based-electricity nations. Still others are being told by climate-obsessed pressure groups, media, and political elites to light, heat, and cool only one room, wear more sweaters, and appreciate electricity when itโ€™s available, not gripe about its cost or absence.

Europe refuses to frack for oil and gasโ€ฆbut imports Russian fuels, thereby sustaining Putinโ€™s war on Ukraineโ€™s citizens and civilian infrastructure.

Several U.S. states have also imposed Euro-style electricity rates, rolling or recurring blackouts, and economic disruption in the name of saving the planet from climate calamities.

Leading, applauding, and demanding this insanity are the United Nations, European Union, International Court of Justice (ICJ), multilateral anti-development banks, non-governmental organizations, and even the now-defunct USAID. They harp about climate emergencies, demand that countries switch to โ€œcleanโ€ energy, and refuse to approve or finance fossil fuel projects even for Africa.

The ICJ recently asserted that people have a โ€œhuman rightโ€ to a โ€œclean, healthy, sustainable environmentโ€ โ€“ which, to the court, means no impacts from fossil-fuel-driven climate change. It said nothing about rights to reliable and affordable energy, modern healthcare, or decent living standards.

These proclamations and policies carry serious and often lethal consequences, especially for the worldโ€™s poorest people. They excuse and justify policies that effectively keep families and nations mired in poverty, squalor, joblessness, disease, and malnutrition.

President Trump has excoriated the UN for its โ€œbrutalโ€ climate and Net Zero policies. The rest of the world should do likewise.

The ICJ-defined right to a clean, healthy, sustainable environment also ignores the reality that โ€œclean energyโ€ requires extensive mining and minerals processing, using fossil fuels and resulting in extensive toxic land, air, and water pollution. Much of this dirty work is done in the poor familiesโ€™ own backyards (because the elites want no mining or processing in their fiefdoms), and much of it involves child and slave labor, no or substandard workplace safety rules, and rampant land and habitat desecration.

The subsequent wind, solar, and transmission installations impact hundreds of times more crop, habitat, and scenic lands than coal or gas power plants that generate electricity in far greater quantities, far more reliably, and far less expensively.

In Indiaโ€™s Thar Desert, next to Pakistan, native species are being sacrificed on the climate crisis and clean energy altar. Solar panels already blanket over 200 square miles; more than 2.5 million trees have been cut down to install them; and another 14,000 square miles of habitat (almost equal to Switzerland or half of South Carolina) could be clear cut for more panels, Vijay Jayaraj reports.

Even ponds that once attracted pelicans and a dozen other species are covered with solar panels. Numerous other wild species are also struggling to survive as their habitats are destroyed. Cleaning and cooling the panels already requires the equivalent of 300,000 peopleโ€™s drinking water needs every week.

This destruction is happening all over the world. The ICJ still insists wind and solar power foster โ€œclean, healthy, sustainable, climate-friendlyโ€ economiesโ€“and ignores the privation it perpetuates.

The limited, intermittent, unpredictable electricity from Climate Cabal-approved generators guarantees that the worldโ€™s still-impoverished people will never have the appliances we take for granted. They may eventually have cell phones and laptops, a few lights, dorm-room refrigerators, and jobs maintaining โ€œrenewableโ€ power systems.

However, they will never enjoy the modern healthcare, homes, and living standards that require 24/7/365 coal, gas, nuclear, or hydroelectric power.

So, before we let Net Zero fanatics in the Climate Industrial Complex inflict their lies, ideologies, and policies on people whoโ€™ve never had an opportunity to enjoyโ€“much less rejectโ€“the marvels of modern civilization, letโ€™s ask those prospective victims if theyโ€™re okay with that version of a โ€œclean, sustainableโ€ future, with giving up their aspirations for the lives and wonders they see in movies and magazines.

Letโ€™s find out whether theyโ€™ve had a chance to speak with their European counterparts and inquire about how Europeโ€™s automotive, glass, pharmaceutical, and other industries are faring. How many workers still have jobs? How many companies have moved their operations to China, India, or other faraway locales? How much do they enjoy living under the costs and restrictions imposed by EU politicians and bureaucrats?

Eastern Europeans werenโ€™t overjoyed to exchange six years under the Nazis for 50 years under the benevolent peopleโ€™s republics of the Soviet Union. Poor families in Africa, Asia, and Latin America might not be equally unexcited about the prospect of swapping their current daily grinds for the minimally better lives envisioned for them by would-be global ruling elites.

Perhaps they will no longer have to live in mud-and-thatch huts, carry water from distant wells, cook over wood and dung fires that infect women and babies with lung diseases, get intestinal diseases from parasite-infected water and spoiled food, suffer from malaria and other insect-borne diseases, be treated in antiquated hospitals that donโ€™t even have window screens, and die decades before they should.

But how much better will their lives be under policies imposed by elites who decide their fates after flying private jets from one of their mansions to the next 5-star, UN-sanctioned climate or economic conference?

The worldโ€™s poor donโ€™t just have a human right to truly clean, healthy, sustainable environments. They have a right to enjoy the benefits of affordable 24/7 electricity, well-paid jobs, and all the modern appliances, healthcare, homes, prosperity, and 6,000+ products made from petrochemicals that most people in industrialized nations already enjoy.

And they have the right to do so without being guilted and conned by phony claims that aspiring to such energy and lives will bring worsening storms and inundations from rising seas, more forest fires, stressed blood supplies, and other catastrophes conjured up by climate grifters and their political, academic, and media allies.

Poor and developing nations need to band together, finance their own energy infrastructure, development, health and prosperityโ€“and tell the carbon colonialists to take a hike.

CLAIM: Climate change is supercharging Europeโ€™s biggest hail

From Newcastle University and the โ€œclimate change causes everythingโ€ department, comes this โ€œbut models tell us soโ€ bit of faux scienceย without one single field measurement of hail size included.ย Of course, they used the highly flawed RCP 8.5 model to generate these headlinesโ€ฆ.because no other model would.

A stormy street scene featuring large ice balls scattered on the ground, with dark, ominous clouds overhead, lightning striking, and snow-covered buildings lining the street.

From Watts Up With That?

By Anthony Watts

From Newcastle University and the โ€œclimate change causes everythingโ€ department, comes this โ€œbut models tell us soโ€ bit of faux science without one single field measurement of hail size included. Of course, they used the highly flawed RCP 8.5 model to generate these headlinesโ€ฆ.because no other model would.

The Representative Concentration Pathway 8.5 (RCP 8.5) is now widely considered flawed and highly unlikely to represent a realistic โ€œbusiness-as-usualโ€ scenario. It was originally designed as a worst-case scenario, but it was often normalized and treated as a probable outcome in climate research and media. 
More here. โ€“ Anthony


Warming may lead to less frequent but bigger and more devastating hail storms, new research has shown.

Climate experts from Newcastle University, the Met Office and the University of Bristol used European-wide km-scale simulations to model future changes to hail with global warming. Published in the journal Nature Communications, the findings show that, under a high-emissions scenario (RCP8.5), severe hail is likely to become less common, except potentially for very large hail.

Severe hail has a diameter of 2 cm, while a diameter of 5 cm or more is considered very large. Bigger hailstones cause more damage than smaller ones, and even a small increase in their size could outweigh any benefits from having fewer hailstorms overall.  

The researchers attribute this decrease to more than one factor. Hail forms higher in the atmosphere as it warms, where storm updrafts could be weaker, and this gives hail more time to melt before reaching the ground. Another factor is the weakening large scale circulation, affecting the vertical profile of winds and leading to environments not beneficial for thunderstorm organization.

Importantly, the authors found that future warm seasons feature a warmer thunderstorm type similar to hail-producing storms found in the tropics, where the largest hailstones can still reach the surface. The findings suggest that, in the future, these storms will become most frequent over southern Europe, leading to regional increases in severe hail frequency.

Study lead author, Dr Abdullah Kahraman, Senior Researcher in Severe Weather and Climate Change, School of Engineering, Newcastle University and long-term Visiting Scientist at Climate Processes and Projections (CPP), Met Office Hadley Centre, said: โ€œOur findings indicate that the effects of climate change on severe thunderstorms are more complex than previously thought, and high-resolution models can produce results that differ significantly from earlier research. Society may need to prepare for less frequent, yet more damaging hail events locally, in a 5-degree warmer future.โ€  

Professor Lizzie Kendon, Head of Climate Projections at the UK Met Office and Professor of Climate Science at the University of Bristol, noted: โ€œThese results are very concerning. They imply we need to be prepared for tropical-type hailstorms impacting Europe in the future, associated with very large hailstones that can cause severe impacts. This possibility also extends to the UK, although the risk of hail here remains low into the future.โ€

Study co-author, Professor Hayley Fowler, Professor of Climate Change Impacts, Newcastle University School of Engineering, added: โ€œAs a society we need to be better prepared for unprecedented extreme events and this study shows that future storms in the Mediterranean could bring giant hail, with devastating impacts. Recent hailstorms have caused significant direct damage to properties and infrastructure, crops, and even aircraft!โ€

The teamโ€™s analysis shows that the possibility for very large hailstones decreases around Central Europe, and that it remains low over the British Isles and Northern Europe land areas. In contrast, it increases in Southern Europe in autumn and winter, balancing decreases in summer and spring.

The occurrence of warm-type thunderstorms in Southern Europe in a future warmer climate could amplify the impact of hailstorms in Italy and surrounding areas, with overall more frequent significant severe hail.

The authors acknowledge the uncertainty regarding the effect of enhanced melting associated with higher freezing levels on the largest hailstones. They recommend further studies of these warm thunderstorms to improve the understanding of their potential to produce very large and damaging hail at the surface.

Reference

Kahraman, A., Kendon, E.J., Fowler, H.J. et al. Future changes in severe hail across Europe, including regional emergence of warm-type thunderstorms. Nat Commun 16, 8438 (2025). https://doi.org/10.1038/s41467-025-62780-0


Journal Nature Communications DOI 10.1038/s41467-025-62780-0 

Iโ€™m a Meteorologist. The Met Office Has Serious Questions to Answer Over the Accuracy of its Temperature Measurements

In the 1990s and 2000s the Met Office gradually changed the way it measures the air temperature due to a process of automation, the primary purpose being to reduce costs. Human observers were largely replaced by machines which utilise platinum resistance thermometers (PRT) and data-loggers. This combination led to the possibility of reporting at a much greater frequency. This change has occurred across many other countries.

Modern glass-fronted building at dusk with illuminated features and light trails from passing vehicles.

From The Daily Sceptic

Byย Andrew Sibley

A close-up view of a traditional thermometer with a scale ranging from -40 to 120 degrees Fahrenheit, set against a bright, sunny sky with clouds.

In the 1990s and 2000s the Met Office gradually changed the way it measures the air temperature due to a process of automation, the primary purpose being to reduce costs. Human observers were largely replaced by machines which utilise platinum resistance thermometers (PRT) and data-loggers. This combination led to the possibility of reporting at a much greater frequency. This change has occurred across many other countries. Arguably, this change has had a measurable impact upon daily maximum and minimum temperature reports, which then feeds into longer-term climate reporting, although I am not aware of published research that has assessed the impact of this change (Chris Morrison has reported on this question recently).

We should note that PRT technology is not new โ€” the instruments were invented in the late 19th century and advertised commercially in the very early 20th century. They are generally accurate and have a faster response time than the traditional mercury-in-glass (MiG) and ethanol-in-glass (EiG) thermometers. The glass thermometers contain an internal index to mark the daily extremes, which are read in the morning and evening. For decades PRTs were used alongside the glass thermometers for observing and climate purposes, with the glass thermometers largely responsible for recording the daily highs and lows.

The practice for UK weather-observing staff in the 1980s and 1990s was to record the hourly temperature from the PRT (even half-hourly at busy airports). This had been the practice for many decades. For the climatological return, the MiG was used for the daytime maximum value, which was read at 2100 UTC (Coordinated Universal Time, or Greenwich Mean Time: GMT). The EiG thermometer recorded the night minimum temperature at 0900 UTC. Very rarely, an hourly PRT value would be higher than the daily maximum climatological readings from the glass thermometers (and lower at night). The PRT value would then take precedence in the daily register and climate return for the sake of consistency, but the vast majority of the climatological recordings arose from the glass instruments.

Use of the electric thermometers, combined with the data-loggers, enabled the collection of far greater amounts of data. Readings are now taken every 15 seconds, and four readings averaged over each one-minute period. Because of the faster response time of the PRTs, this has meant that shorter temporal peaks and lows in temperature can be measured. Essentially, short-period highs and lows that would have been missed by glass thermometers are now recorded in the climatological daily returns.

To see the significance of this, the response time of the different instruments can be assessed. As can be seen from the table below, the PRTs have a faster response time than the glass equivalent ones, with the larger difference being at very light wind speeds. The Stevenson Screens are only naturally aspirated, which means thermometers are recording at the lower wind speeds and so response times are longer. It seems likely that the change from the glass thermometers to the PRTs has an impact upon climate returns.

Table comparing the average response times of various thermometer types under different airflow conditions, highlighting significant differences between mercury-in-glass, alcohol-in-glass, and platinum resistance thermometers.

In terms of climatological daily averages for each station, one might think that the higher peaks, and lower lows would cancel each other out. However, the air near ground-level is generally more stable at night than during the day. This means that the glass thermometers have more time to respond to changes in air temperature at night. Thus, it would seem likely that the change in technology has less impact on the measurements at night. During the day, convective currents lead to greater variability in temperature, and likely to the recording of higher short-period daytime maxima (see figure 6 at this Met Office factsheet 17).

Historically, there was a change from the Glaisher temperature stand to the Stevenson screen in the 1870s, and multi-year studies were conducted to assess the difference in readings. The Glaisher stand was not fully protected from long-wave radiation from the ground or nearby buildings, which meant that slightly higher readings were taken in comparison with the ambient air temperature. Studies suggested an average difference of approximately 0.7ยฐC for a summer month (Laing, 1977, Met. Mag.). However, as far as I am aware no equivalent long-term studies have been conducted or published to assess the impact of the change to PRTs and higher frequency readings collected by data-loggers. Jennifer Marohasy has struggled to find information related to this question for an automatic weather station at Brisbane Airport. 

The other impact of note is the growth of urban development and the impact this has on daily average temperatures. It is true that many Met Office observing sites are now classed, according to WMO classification, at Class 4 or 5, which suggests larger possible sources of error in daily reports (errors of up to 2 or 5ยฐC respectively). Analysing the Met Office station inspection reports, for example at the Cambridge Botanical Gardens (available in the National Met Archive in Exeter), reveals the struggle the Met Office has had over the years to maintain the quality of its observing sites in the face of urban development. An historical study of the Cambridge Botanic Garden shows the temperature screen has moved several times since the 1950s as development has encroached upon the garden, with three significant buildings erected in the last 20 years alone. 

In modern cities, it is likely that the larger errors in temperature for WMO Class 4 and 5 stations occur at night due to the heat-retaining qualities of steel, concrete and glass buildings. Heat is absorbed during the day and released slowly through the night. As urbanisation has increased with population growth and development, then, we may ask whether the full impact of the change in land use has been captured in climate assessments. Spencer, Christy and Braswell have recently produced a paper on this question related to changes in population density which indicates a significant amount of warming is due to the effects of urban heat.

So, there are a number of questions for climatologists to answer. How has the move to PRTs and data-loggers affected climatological returns? And secondly, how has urban development and the downgrading of the quality of observing sites as a result of urban encroachment affected how climate extremes are measured, particularly in the last 30 years? These are factors that have become more pressing since the 1990s as land-based observations have increased in importance. It is noteworthy that climatologists have worked hard to adjust temperature records from the 19th century, for example in the HadCRUT5 dataset, which, following the retrospective adjustments over a century after the fact, showed more warming than earlier versions of the HasCRUT dataset. The Met Office reported in 2020 that, as well as increased use of land-based observations in the new dataset, it utilises โ€œstatistical methods to extend the datasetโ€™s coverage in the early record and in areas that are still data-sparse today, such as the rapidly warming Arcticโ€. Such statistical methods in the data set are of course somewhat subjective and imperfect. It is also relevant to note that as land-based observations have become more important in the dataset, the quality of such observations has decreased with possibly larger sources of error from long-wave radiation.

Greater care and attention now ought to be given to the more quantifiable effect of recent changes in temperature recording equipment and the growth in the built environment. The suspicion is, of course, that changes in both may have led to higher temperatures in the dataset since the 1990s, over and above any actual climatic temperature increase.

Andrew Sibley is a semi-retired Chartered Meteorologist with an MSc in Environmental Decision-Making and an MPhil in Theology.

Feds deaf to eagle-kill warning

Land-based wind turbines kill golden eagles, so every turbine requires an Eagle Protection Act permit from the U.S. Fish and Wildlife Service (FWS) to kill them.

From CFACT

By David Wojick

Land-based wind turbines kill golden eagles, so every turbine requires an Eagle Protection Act permit from the U.S. Fish and Wildlife Service (FWS) to kill them.

These permits are predicated on a supposed mitigation strategy where turbine kills are offset by reducing the number of eagles electrocuted by power poles. Electrocution is estimated to kill about 500 golden eagles a year. The strategy calls for 12 eagles to be saved for every 10 killed by wind turbines.

My research on this strategy found that the number of golden eagles actually saved from electrocution must be very low, far lower than the number killed by wind turbines. The math is quite simple. The number of power poles being made safe is far too low to be effective.

So I set out to inform the FWS of my findings, which should be of great concern to them. They need to rethink their golden eagle wind-kill mitigation strategy.

Beginning on September 25, I sent the cautionary email shown below to over a dozen FWS people and offices. Most of the people were in the Migratory Birds Office, which oversees the Eagle Protection Act permitting. In addition, each of the eight FWS regional offices which issue the Eagle-kill permits has a specific email address for that purpose, so I sent to them.

I sent every email twice in one week and to date have not received a single reply. So, I am here publishing the email to make it in effect an open letter to the Fish and Wildlife Service.

Here is the generic body of my FWS email:

 1

โ€œSubject: Electrocution mitigation for wind kills does not work

Hello FWS,

I understand FWS is looking into eagle take permits for wind turbines at Secretary Burgumโ€™s request. I just did a study on the mitigation component and my finding is that electrocution mitigation in its present form is completely ineffective. Very few, if any, electrocution deaths are being prevented, certainly not the 1.2 deaths per turbine death that is called for.

The reason is that the poles per death number FWS is using is far from what is needed. While FWS currently requires about 278 poles to be โ€œmade safeโ€ per wind-killed eagle, the correct number may be closer to 67,000. It is no wonder the mitigation program has failed.

The national average is actually close to 370,000 poles per eagle death based on 500 kills with 185 million poles. The research literature suggests that high risk poles may be 5.5 times deadlier, which is 67,000. At this rate fixing just 278 poles per wind-kill will have little if any effect. Better data might change these numbers a bit but not enough to make a difference. This is explained in section 1 of my report which is at https://www.cfact.org/2025/06/29/cfact-report-feds-fail-to-offset-wind-turbine-eagle-kills/.

Given these numbers there should be a moratorium on permitting until an effective mitigation strategy is developed. FWS regulations call for monitoring the effectiveness of mitigation.

See my https://www.cfact.org/2025/07/28/fws-is-violating-its-own-eagle-kill-regulations/.

I will be happy to discuss this important issue.

My best regards,

David Wojick, Ph.D.

CFACT Senior Advisor and Policy Analyst

End of email to FWS.

I am now pursuing other means of communication. In addition, I invite people who object to a specific wind power project to use this data and object to that projectโ€™s eagle kill permit. Without this Federal permit, the wind project cannot operate.

The Regional Permitting Office contacts are listed here:

https://www.fws.gov/program/migratory-bird-permits/contact-us

Maybe this will get their attention.

Media and the German climate expert

We had informed about this very strange interview in “heute” from ZDF.
Dunja Hayali got a “confirmation” for a rather “far-fetched” thesis of the German Meteorological Society: We could reach global warming of 3ยฐC above pre-industrial temperature levels as early as 2050.

A depiction of the Earth surrounded by a radiant sun, symbolizing climate change and global warming.

From The KlimaNachrichten

By Frank Bosse

A target board with several arrows stuck in it, illustrating aims or goals.

We had informedย about this very strange interview in “heute” from ZDF.
Dunja Hayali got a “confirmation” for a rather “far-fetched” thesis of the German Meteorological Society: We could reach global warming of 3ยฐC above pre-industrial temperature levels as early as 2050.
Stefan Rahmstorf was used as a key witness and was announced as follows in theย video:

“He works at the Potsdam Institute for Climate Impact Research and is one of the leading international experts in this field” 

We had also shown how he avoided a correct answer to the question posed “3 degrees possible in 2050?”.

So Dunja Hayali could feel vindicated in the end. At min. 4:19 comes her message:

That this topic, which was really at the top of the agenda for a few years, is no longer a priority for some people, even for a few governments…. wouldn’t you have to communicate differently?

Quite apart from the fact that this is a massive election campaign aid for the Greens (it is their topic No. 1!), she is absolutely right, just different from what she thinks.

Rahmstorf should have expressed much more clearly that the requested 3ยฐC in 2050 is exaggerated and “far-fetched”.
This is what Zeke Hausfather (a truly recognized expert and IPCC author) did in a post on X on 9/28/2025:

Screenshot of a Twitter post by Zeke Hausfather discussing the German Meteorological Society's warning about potential 3ยฐC global warming by 2050 and its likelihood.

โ€žโ€ฆ it is far-fetched that we will reach 3ยฐC globally in 2050.”

Clear question, clear answer! He substantiates this and shows the few climate models that predict 3ยฐC warming in 2050:

A graph depicting global mean temperature anomalies (ยฐC) projected from 2020 to 2100 based on various climate models. The lines represent different model outputs, including CanESM5 and KACE-1-0-G, with shaded areas indicating uncertainty ranges.
Sourceย 

They have “only” one problem: They already show 2ยฐC warming today, while in the ZDF interview Stefan Rahmstorf rightly mentions that we are currently only seeing 1.3ยฐC.
The model mean shows this, but these three outlier models have a much too high, unrealistic sensitivity to a CO2 increase and are therefore out of the question for all real experts for future projections of the real Earth! Gavin Schmidt (NASA) assigns them to a “wolfpack” here, they should not be used, as this leads to erroneous results, as an example for Arctic sea ice shows.

The question inevitably arises: Is Stefan Rahmstorf the expert he was announced to be?

It is not so easy to answer. It knew the real facts for sure, he doesn’t do research in a vacuum. So there is only one possible explanation: With his torrent of words about “we are at the top of the predictions” (also inaccurate, as shown in the article linked above), he avoided a clear answer, as his colleague Zeke Hausfather gave. He thus accepts that the viewer is manipulated by Hayali in the way she did. He allowed a completely “far-fetched” thesis not to be clearly rejected by a “leading expert”. Thus, the viewer, who was not familiar with details, could come to the conclusion: “Rahmstorf has confirmed the forecast!”. In truth, it should have been cleared away!

Therefore, Hayali is right: Rahmstorf, as a scientist, MUST communicate differently. He has to convey clearly what we know to be certain, what we do not know to be certain and what is practically impossible.

So a suspicion falls on him: A cronyism in exaggeration and climate scaremongering with certain media.

What could a possible preliminary talk have looked like?

Hayali (H): “We want to know your opinion on the DMG forecast of 3 degrees in 2050”.

Rahmstorf (SR): “That is highly unlikely!”

H: “But we can’t and don’t want to put it that way, it misses the mark.”

SR: “What do you suggest?”

H: “Perhaps you will find comparisons that I could then interpret as if it were very possible?”

SR: “Yes, in the spirit of the matter that would be…. I come up with something. I will choose unctuous and somewhat enigmatic words.”

However, Rahmstorf did not seem to have felt completely comfortable in his skin during the interview on the station, his voice sounded a little brittle even during the welcome.

Perhaps he should no longer be questioned in the media until he has learned his communication lessons in science and gives adequate answers to clear questions?

For the reputation of climate science in Germany, this would actually be a good choice!

Energy price rises prompt call for more help withย bills

A rise in gas and electricity prices has prompted energy suppliers to call for “enduring” targeted support for those in financial difficulty.

A pile of burning money with flames and smoke in a dimly lit environment.

From NOT A LOT OF PEOPLE KNOW THAT

By Paul Homewood

Screenshot of a BBC News article headline discussing rising energy prices and calls for assistance with bills.

A rise in gas and electricity prices has prompted energy suppliers to call for “enduring” targeted support for those in financial difficulty.

Energy costs are up 2% from Wednesday for millions of people in England, Wales and Scotland as regulator Ofgemโ€™s latest price cap come into effect.

Campaigners say many will struggle with another winter of relatively high bills, with a record ยฃ4.4bn owed to suppliers by their customers, recent official figures reveal.

The government said it was taking “urgent action” to support vulnerable families this winter.

Some companies have schemes in place to write off debt or offer emergency vouchers, external, but these measures vary across the sector.

“The level of support [is] still insufficient for those that need it most,” said Ned Hammond, a deputy director at Energy UK.

“The government needs to make swift progress to improve targeting and design an enduring support scheme that effectively addresses fuel poverty.”

Full story here.

Quite astonishingly, the BBC go through the whole article without one single mention of โ€œNet Zeroโ€ or โ€œrenewable energy subsidiesโ€!

But they do note that the government has also pledged to bring down household energy costs by investing in home-grown energy, without bothering to challenge how bills can come down by paying offshore wind farms 50% more than the market price!

The whole thing is smoke & mirrors anyway, as any debt relief will end up being added to everybody elseโ€™s bills:

Text discussing Ofgem's proposal for a Debt Relief Support Scheme to assist energy suppliers in managing significant customer debt.