Net Zero and British Grid: Dire Straits (Kathryn Porter)

Electrification has become the default answer to almost every energy and climate question. Heat? Electrify it. Transport? Electrify it. Industry? Electrify it. In policy circles, electrification is often treated as a frictionless substitute for fossil fuels: cleaner, simpler, and largely inevitable. In this new report I take a look at what electrification would mean for the GB power grid, if it went ahead as planned. I also consider the impact of additional demand from AI data centres.

A futuristic cityscape featuring renewable energy sources like solar panels and wind turbines, with smart cars on a vibrant road. The skyline includes modern skyscrapers and digital icons representing technology and connectivity.

From Science Matters

By Ron Clutz

A split image showing a vibrant industrial scene with oil refineries on the left and a dark, desolate landscape with ruined structures on the right, connected by a yellow arrow indicating a transition.

Kathryn Porter’s recent article on the plight of UK’s electrical grid at her blog: Electrification – can the grid cope? The excerpt below provides findings from her new research paper, available at the link above.

Electrification has become the default answer to almost every energy and climate question. Heat? Electrify it. Transport? Electrify it. Industry? Electrify it. In policy circles, electrification is often treated as a frictionless substitute for fossil fuels: cleaner, simpler, and largely inevitable. In this new report I take a look at what electrification would mean for the GB power grid, if it went ahead as planned. I also consider the impact of additional demand from AI data centres.

A cartoon illustrating three stages of energy consumption: 'Old Energy' shows a smoke-emitting power station, 'New Energy' features wind turbines with a backup power station, and 'No Energy' crosses out the power station entirely, labeled 'Greening the Land'.

Electrification policy rests on optimistic assumptions

Across heating, transport and industry, electrification targets rely on a similar set of assumptions:

♦  that consumers will change behaviour rapidly,
♦  that costs will fall quickly and predictably, and
♦ that electricity infrastructure will expand smoothly to accommodate new demand.

The report tests these assumptions sector by sector and finds them wanting.

The good news is that electrification targets are unlikely to be met without some form of compulsion. In heating, rapid deployment of heat pumps is implausible under current conditions. Consumer resistance remains high, installer numbers are growing too slowly, and both capital and running costs are materially higher than for gas heating. Even where heat‑pump subsidies reduce upfront costs, households still face additional expenditure on larger emitters, pipework and insulation, as well as higher ongoing energy bills because electricity prices remain far above gas prices. These are not marginal issues – they are fundamental barriers to mass adoption.

A humorous illustration showing cartoon characters pulling various colored electrical plugs towards a large, distressed electrical outlet on the wall.

Transport electrification faces a similar gap between ambition and delivery. Mandates for electric vehicles are running ahead of public willingness to adopt them, while grid and charging‑infrastructure constraints remain severe. These problems are magnified for larger vehicles. There is currently no credible fast‑charging solution for HGVs, and electrifying buses outside dense urban centres is far more challenging than policy documents typically acknowledge, particularly where vehicles do not return regularly to a single depot.

In industry, the constraint is both technical feasibility and economic viability. High electricity prices have driven deindustrialisation across large parts of the UK economy, reducing electricity demand far more quickly than electrification can increase it. In practice, deindustrialisation is the dominant trend, and a stronger driver of demand than electrification across the economy as a whole.

Across all three sectors, the modelling used by both NESO and the Climate Change Committee depends on behavioural and technological assumptions that are optimistic, weakly evidenced, and often inconsistent across scenarios. My report does not assume electrification will fail entirely, but it does find that current targets are unlikely to be met without significant compulsion, which brings its own political and social risks.

Illustration of a renewable energy facility featuring solar panels and wind turbines, with power lines and a city skyline in the background.

The system is under strain even without electrification

The bad news is that, even without electrification, the electricity grid is likely to struggle unless action is taken. One of the most important findings of my report is that the GB electricity system is already heading towards a serious adequacy problem even if large‑scale electrification largely fails.

Renewables cannot provide security of supply during prolonged low‑wind winter events, and reliance on interconnectors is risky when neighbouring systems face similar weather patterns. Meanwhile, just under 5 GW of nuclear generation is scheduled to close by 2032 at the latest, and around 12 GW of CCGT capacity is at risk of closure due to age and declining utilisation.

While Hinkley Point C and perhaps a small amount of new open‑cycle gas capacity may come online over the next five to seven years, this does not come close to offsetting expected closures. Under plausible assumptions, the system could face a capacity shortfall of around 12 GW on cold, low‑wind winter days.

In such conditions, meeting demand without rationing would be impossible.

Replacing or upgrading ageing gas generation is constrained by long lead times. New rotors typically require around 5 years, and entirely new gas turbines 7-8 years, reflecting global supply‑chain bottlenecks. These are physical constraints that cannot be resolved by market reform or policy ambition alone.

Britain is not alone in facing a potential problem with system adequacy. Norway, the Netherlands and Germany were all considered as part of the report and in each case, possible shortages are identified. Norway assumes that flexibility, demand response, or batteries will full the gap. The Dutch are less confident and intend to monitor the generation mix in neighbouring countries in the hope of persuading them to maintain enough firm generation to secure the Dutch grid on low wind days. Only Germany has explicitly identified a need to build more gas generation, although its target is likely inadequate.

View of Earth from space at night, showcasing city lights and the outline of landmasses, with a spacecraft in the foreground.
Europe at night from space NASA 2016

Flexibility helps, but does not replace firm capacity

One of the report’s central findings is that electrification does not increase demand evenly. Heat pumps, EV charging, and industrial electrification all tend to concentrate demand in time (cold evenings, post‑work charging windows), and concentrate demand in space (residential feeders, urban substations, motorway corridors).

Annual energy numbers hide this  – a system can look comfortable
on a terawatt‑hour basis while becoming acutely
stressed for a few hundred hours a year.

Flexibility features heavily in electrification plans with smart charging, demand response, batteries, and thermal storage. While flexibility can shave peaks, this only works where consumers tolerate loss of convenience. In many cases, policymakers ignore real-world constraints such as fire risks associated with overnight operation of domestic appliances, and noise restrictions within multi-occupancy residential buildings. Batteries are energy‑limited and cannot cover prolonged stress events. Many flexibility services depend on digital systems that introduce new operational and cyber risks. Flexibility may reduces costs at the margin, but it does not eliminate the need for firm capacity, resilient networks, or system strength.

A row of high-voltage power towers against a blue sky, with illuminated power lines connecting them.

Infrastructure challenges present further risks

In addition to the issues with reliable generation capacity, there are further difficulties with distribution and transmission constraints which arrive earlier and are also hard to fix quickly. Key points from the report include:

  • Local distribution networks were not designed for mass electrification of heat and transport
  • Reinforcement timelines are measured in years, and often a decade or more
  • Connection queues and “paper capacity” obscure real‑world deliverability

The report also identifies risks with aging grid infrastructure and the recently identified risks that premature closure of offshore gas pipelines may constrain gas supplies to the grid on cold winter days, limiting the gas available for electricity generation.

Electricity pylons against a sunset background with a rising red graph overlay, symbolizing growth in energy consumption or production.

What this means in practice

Taken together, the findings point to an uncomfortable conclusion. The GB electricity system is likely to struggle to maintain today’s level of demand reliably, let alone accommodate the additional 7–10 GW of load in 2030 implied by current electrification agendas. AI data centres are therefore likely to pursue off‑grid solutions, not because of technological failure but because the grid is no longer perceived as sufficiently reliable for mission‑critical loads.

Large‑scale electrification of heat and industry before 2030 appears improbable, and likely remains so for several years thereafter. Without decisive policy action, the probability of regional rationing, blackouts and cascading grid failures rises materially.

To restore Britain’s energy security, government must
pivot from aspirational modelling to credible planning.

This means:

♦  supporting life extension of ageing gas generation,
♦  accelerating procurement of new dispatchable capacity,
♦  reforming network investment incentives to prioritise resilience, and
♦  reassessing electrification timelines.

Net zero targets cannot be allowed to override public safety.
Security of supply must once again become
the foundational principle of UK energy policy.

Aerial view of a busy highway interchange surrounded by trees and buildings, showcasing multiple lanes of traffic converging at a roundabout.

While Sadiq Khan Frolics on Billionaire Pal’s Gas-Guzzling Superyacht, Ulez is Exposed as a Money-Making Scheme at the Expense of Hardworking Londoners

In a damning indictment published in Wednesday’s Daily Mail, researchers from the University of Birmingham have laid bare the futility of London Mayor Sadiq Khan’s Ultra-Low Emission Zone (Ulez) expansion, concluding that the scheme has delivered zero tangible benefits to London’s ambient air quality.

A luxurious superyacht docked in the harbor, featuring a sleek exterior design with multiple decks and large windows. Inset images show the opulent interior with elegant furnishings, a grand piano, and a stylish circular seating area.

From Tilak´s Substack

By Tilak Doshi

An artistic portrait of a man with gray hair and a serious expression, wearing a blue suit, next to a green sign that reads 'Ultra Low Emission ULEZ Zone' under the 'Transport for London' logo.

In a damning indictment published in Wednesday’s Daily Mail, researchers from the University of Birmingham have laid bare the futility of London Mayor Sadiq Khan’s Ultra-Low Emission Zone (Ulez) expansion, concluding that the scheme has delivered zero tangible benefits to London’s ambient air quality.

Analysing data pre- and post the August 2023 Ulez rollout, which blanketed Greater London with a £12.50 daily levy on older vehicles, the study found no statistically significant dips in nitrogen dioxide (NO2) or particulate matter (PM2.5) levels. This revelation strips away the veneer of environmental virtue from Khan’s project, exposing it as yet another assault on ordinary motorists. Ulez epitomises the corruption of science in service of predatory revenue extraction and class war.

The Ulez Expansion: A Timeline of Overreach

Ulez’s origins trace back to 2019, when Khan started the scheme in central London, ostensibly to curb emissions from diesel and petrol cars and trucks to alleviate respiratory health. By 2021, it sprawled to the North and South Circular roads, ensnaring 3.8 million residents. The 2023 mega-expansion to all of Greater London where pollution was even less of a problem — spanning 1,500 square kilometres and nine million people — ignited fury, manifesting in protests and sabotage.

This wasn’t mere policy tweak; it was the punitive imposition of burdensome taxes and fines on the car-dependent masses.

London’s ‘Blade Runners’—a nod to the dystopian film — emerged as folk heroes in this resistance. These activists armed with tools from angle grinders to filling foam have vandalised over 4,500 Ulez enforcement cameras since March 2023. Videos on X show them toppling poles in daylight, while passive resisters rack up fines they refuse to pay — a backlog now nearing half a billion pounds, with only one in five drivers settling on time.

This revolt echoes broader European pushback against green mandates, from farmer uprisings to voter revolts against eco-zealotry. Mayor Khan peddles Ulez as a lifeline against ‘toxic air’, claiming 46% reductions in NO2 and 41% in PM2.5 since inception. But these figures stem from dubious counterfactual modelling, i.e., hypothetical conjectures as to what ‘would have occurred’ if there were no Ulez in operation, not real-world evidence.

The Birmingham study echoes earlier Imperial College findings: post-2019, PM2.5 barely budged, and NO2 fell by a paltry 3% — hardly the salvation promised.

London’s air has improved dramatically over decades, thanks to a combination of deindustrialisation, cleaner fuels and better internal combustion engines – not Khan’s cash-grab. DEFRA data shows pollutants such as nitrogen oxides, sulphur dioxide, PM10 and PM2.5 since 1970 plunging, rendering Ulez’s marginal impact invisible amid given trends.

A line graph displaying the decline of various air pollutants in the UK over 50 years, comparing levels to those in 1970. The pollutants include nitrogen oxides, PM10, PM2.5, and sulfur dioxide, with notable percentage reductions shown.

The Dodgy Foundations of ‘No Linear Threshold’ Science

At Ulez’s core lies the ‘no linear threshold’ (NLT) model — borrowed from radiation risk and applied to air pollution. This assumes that every bit of pollutant, down to almost zero, inflicts harm. This extreme metric has fuelled WHO guidelines that deem even trace PM2.5 deadly.

Such an approach to ‘safety’ has more to do with belief in a misanthropic deep ecology where man’s presence can only detract from a pristine unsullied nature.

The Ulez scheme is scientific sleight of hand, metastasising into pseudoscience that threatens economies and livelihoods. Nobel laureate John Clauser calls it a “dangerous corruption“, echoing the climate and Covid hysterias — both instilling fear to justify centralised state control.

WHO assessments, far from rigorous, rely on arbitrary thresholds unsupported by robust epidemiology. Studies tout thousands of premature deaths from pollution but ignore confounders like poverty or lifestyle choices involved in those deaths they count. Real toxicological evidence suggests the potential of hormesis — low doses may even benefit health — yet the NLT standard persists, propping up policies like Ulez.

Khan’s team cites it to claim ‘social justice’, arguing the poor suffer most from dirty air. But as Ross Clark noted in the Spectator, the data don’t stack up; Tube stations like Hampstead which are deep underground harbour air 30 times worse than roads yet escape scrutiny.

Worse, the Mayor’s office funds its own research by commissioning Imperial College reports that conveniently affirm Ulez’s virtues. Emails obtained by the Conservative Party under the Freedom of Information Act showed Professor Frank Kelly of Imperial College London and Shirley Rodrigues, Deputy Mayor for the Environment, apparently working together to “fight back” against other research published by the same university that was not supportive of Ulez. The Conservatives accused Professor Kelly and Mr Khan’s office of having “an alarmingly cosy relationship”.

The pay-to-play dynamic reeks of bias. When the policymaker bankrolls the ‘science’, objectivity evaporates. Independent probes, like the University of Birmingham’s, reveal the emperor’s nakedness: no air quality wins, just economic pain.

Revenue Racket: The True Driver Behind Ulez

If not health, then what? Follow the money. Ulez has hauled in over £70 million in penalties alone since it was introduced in 2019, according to FOI-requested data, despite Khan’s protestation that it’s “not about making money“. Transport for London (TfL) faces a £15 billion shortfall, and Ulez helps fill it by fining the vulnerable. In its first year post-expansion it netted £450 million, much from the £180 non-payment fines hitting low-income drivers hardest.

Tradesmen — plumbers, electricians — face ruinous costs for non-compliant vans; mothers shuttling kids as well as the elderly and disabled are stranded without affordable transport. Outer London’s sparse public transport amplifies the harshness. While Ulez conducts war on the poor with its highly regressive taxes, elites in their electric Teslas or high-end cars see no problem in maintaining their luxury beliefs.

Khan, Co-Chair of C40 Cities, preaches ‘climate justice’ for the Global South while squeezing London’s working and middle classes. C40 is focused, in its own words, on “fighting the climate crisis and driving urban action that reduces greenhouse gas emissions and climate risks”. Khan’s 2024 book Breathe: How to Win a Greener World sounds as sanctimonious as most of the Mayor’s other utterances on things ‘green’. But the Mayor’s sanctimony crumbles under scrutiny of his lifestyle. While Londoners fork over for an aged diesel car, Khan enjoys a birthday bash on a £268 million superyacht – a gas-guzzling behemoth with a carbon footprint rivalling fleets of cars – owned by his billionaire tycoon friend.

How does one champion ‘social justice’ from onboard a superyacht deck? It’s a stark reminder: rules for thee, but not for me. Ulez dovetails with the whole repertoire of actions in the war against Britain’s motorists: low-traffic neighbourhoods, bike-lane encroachments, high costs of parking, 20 mph speed limits, the putting up of bollards and planters to restrict car traffic altogether and experimenting with zoning restrictions for 15-minute cities — all curtailing freedom under green pretexts.

London’s traffic crawls at 8-20 mph, comparable to the speed of Roman chariots in the streets of Londinium, a regression over two millennia blamed on climate alarmism. Khan’s plans for London align with the World Economic Forum vision of slashing the global car fleet by 75% by 2050. In this coming neo-feudalism dreamt up by WEF technocrats, the 25% of remaining cars will be the preserve of the ruling philosopher kings and their apparatchiks.

The Human Toll

Over the years as more stringent environmental regulations for motor vehicles come into operation, millions of perfectly good functioning cars, vans and trucks are forced on to the scrapheap and owners who are already struggling find they need a new bank loan to buy another vehicle just to get to work to pay the bank back for the last one. Ulez’s regressive bite is profound: gig workers, small businesses and families teeter on financial edge while meeting bills made astronomical by ever higher energy costs brought on by subsidies and green policy costs.

A 2017 study, untainted by green ideology and focused on health impacts, gave an estimate of the social costs of air pollution from cars in the UK. “Social costs” here refer to costs which include the damage on human health caused by car pollution. It found that it amounted to £25 a year or less for each car. In other words, just two entry fees for the Central London ULEZ would cover the social cost of this pollution for a whole year.

This mirrors Covid-era follies: low-fatality risks hyped to sow fear and erode liberties. Climate ‘science’ follows suit, with the ‘no linear threshold’ model as the new pseudo-scientific dogma. But as global air quality trends over the past half century show — smog cleared in Tokyo, Los Angeles and New York City in the 1970s — that hysteria is unwarranted. Lifespans lengthen and health improves absent green meddling.

Ulez isn’t salvation for respiratory disease; it’s a revenue ruse cloaked in corrupted science, waging a punitive assault on motorists. As London’s Blade Runners symbolise, resistance grows. While Khan gambols in his buddy’s superyacht, London’s average motorist chokes on fines. It’s time to dismantle London’s Ulez edifice. The Daily Mail exposé, amplifying longstanding critiques by sceptics, demands accountability.

Dr Tilak K. Doshi is the Daily Sceptic‘s Energy Editor. He is an economist, a member of the CO2 Coalition and a former contributor to Forbes. Follow him on Substack and X.

I’m a Meteorologist. The Met Office Has Serious Questions to Answer Over the Accuracy of its Temperature Measurements

In the 1990s and 2000s the Met Office gradually changed the way it measures the air temperature due to a process of automation, the primary purpose being to reduce costs. Human observers were largely replaced by machines which utilise platinum resistance thermometers (PRT) and data-loggers. This combination led to the possibility of reporting at a much greater frequency. This change has occurred across many other countries.

Modern glass-fronted building at dusk with illuminated features and light trails from passing vehicles.

From The Daily Sceptic

By Andrew Sibley

A close-up view of a traditional thermometer with a scale ranging from -40 to 120 degrees Fahrenheit, set against a bright, sunny sky with clouds.

In the 1990s and 2000s the Met Office gradually changed the way it measures the air temperature due to a process of automation, the primary purpose being to reduce costs. Human observers were largely replaced by machines which utilise platinum resistance thermometers (PRT) and data-loggers. This combination led to the possibility of reporting at a much greater frequency. This change has occurred across many other countries. Arguably, this change has had a measurable impact upon daily maximum and minimum temperature reports, which then feeds into longer-term climate reporting, although I am not aware of published research that has assessed the impact of this change (Chris Morrison has reported on this question recently).

We should note that PRT technology is not new — the instruments were invented in the late 19th century and advertised commercially in the very early 20th century. They are generally accurate and have a faster response time than the traditional mercury-in-glass (MiG) and ethanol-in-glass (EiG) thermometers. The glass thermometers contain an internal index to mark the daily extremes, which are read in the morning and evening. For decades PRTs were used alongside the glass thermometers for observing and climate purposes, with the glass thermometers largely responsible for recording the daily highs and lows.

The practice for UK weather-observing staff in the 1980s and 1990s was to record the hourly temperature from the PRT (even half-hourly at busy airports). This had been the practice for many decades. For the climatological return, the MiG was used for the daytime maximum value, which was read at 2100 UTC (Coordinated Universal Time, or Greenwich Mean Time: GMT). The EiG thermometer recorded the night minimum temperature at 0900 UTC. Very rarely, an hourly PRT value would be higher than the daily maximum climatological readings from the glass thermometers (and lower at night). The PRT value would then take precedence in the daily register and climate return for the sake of consistency, but the vast majority of the climatological recordings arose from the glass instruments.

Use of the electric thermometers, combined with the data-loggers, enabled the collection of far greater amounts of data. Readings are now taken every 15 seconds, and four readings averaged over each one-minute period. Because of the faster response time of the PRTs, this has meant that shorter temporal peaks and lows in temperature can be measured. Essentially, short-period highs and lows that would have been missed by glass thermometers are now recorded in the climatological daily returns.

To see the significance of this, the response time of the different instruments can be assessed. As can be seen from the table below, the PRTs have a faster response time than the glass equivalent ones, with the larger difference being at very light wind speeds. The Stevenson Screens are only naturally aspirated, which means thermometers are recording at the lower wind speeds and so response times are longer. It seems likely that the change from the glass thermometers to the PRTs has an impact upon climate returns.

Table comparing the average response times of various thermometer types under different airflow conditions, highlighting significant differences between mercury-in-glass, alcohol-in-glass, and platinum resistance thermometers.

In terms of climatological daily averages for each station, one might think that the higher peaks, and lower lows would cancel each other out. However, the air near ground-level is generally more stable at night than during the day. This means that the glass thermometers have more time to respond to changes in air temperature at night. Thus, it would seem likely that the change in technology has less impact on the measurements at night. During the day, convective currents lead to greater variability in temperature, and likely to the recording of higher short-period daytime maxima (see figure 6 at this Met Office factsheet 17).

Historically, there was a change from the Glaisher temperature stand to the Stevenson screen in the 1870s, and multi-year studies were conducted to assess the difference in readings. The Glaisher stand was not fully protected from long-wave radiation from the ground or nearby buildings, which meant that slightly higher readings were taken in comparison with the ambient air temperature. Studies suggested an average difference of approximately 0.7°C for a summer month (Laing, 1977, Met. Mag.). However, as far as I am aware no equivalent long-term studies have been conducted or published to assess the impact of the change to PRTs and higher frequency readings collected by data-loggers. Jennifer Marohasy has struggled to find information related to this question for an automatic weather station at Brisbane Airport. 

The other impact of note is the growth of urban development and the impact this has on daily average temperatures. It is true that many Met Office observing sites are now classed, according to WMO classification, at Class 4 or 5, which suggests larger possible sources of error in daily reports (errors of up to 2 or 5°C respectively). Analysing the Met Office station inspection reports, for example at the Cambridge Botanical Gardens (available in the National Met Archive in Exeter), reveals the struggle the Met Office has had over the years to maintain the quality of its observing sites in the face of urban development. An historical study of the Cambridge Botanic Garden shows the temperature screen has moved several times since the 1950s as development has encroached upon the garden, with three significant buildings erected in the last 20 years alone. 

In modern cities, it is likely that the larger errors in temperature for WMO Class 4 and 5 stations occur at night due to the heat-retaining qualities of steel, concrete and glass buildings. Heat is absorbed during the day and released slowly through the night. As urbanisation has increased with population growth and development, then, we may ask whether the full impact of the change in land use has been captured in climate assessments. Spencer, Christy and Braswell have recently produced a paper on this question related to changes in population density which indicates a significant amount of warming is due to the effects of urban heat.

So, there are a number of questions for climatologists to answer. How has the move to PRTs and data-loggers affected climatological returns? And secondly, how has urban development and the downgrading of the quality of observing sites as a result of urban encroachment affected how climate extremes are measured, particularly in the last 30 years? These are factors that have become more pressing since the 1990s as land-based observations have increased in importance. It is noteworthy that climatologists have worked hard to adjust temperature records from the 19th century, for example in the HadCRUT5 dataset, which, following the retrospective adjustments over a century after the fact, showed more warming than earlier versions of the HasCRUT dataset. The Met Office reported in 2020 that, as well as increased use of land-based observations in the new dataset, it utilises “statistical methods to extend the dataset’s coverage in the early record and in areas that are still data-sparse today, such as the rapidly warming Arctic”. Such statistical methods in the data set are of course somewhat subjective and imperfect. It is also relevant to note that as land-based observations have become more important in the dataset, the quality of such observations has decreased with possibly larger sources of error from long-wave radiation.

Greater care and attention now ought to be given to the more quantifiable effect of recent changes in temperature recording equipment and the growth in the built environment. The suspicion is, of course, that changes in both may have led to higher temperatures in the dataset since the 1990s, over and above any actual climatic temperature increase.

Andrew Sibley is a semi-retired Chartered Meteorologist with an MSc in Environmental Decision-Making and an MPhil in Theology.

Coutinho Writes To CCC

Just a pity she did not take the CCC to task when she was in power for doing exactly the same in their previous costings!

A graphic depicting rising electricity prices with the words 'ELECTRICITY PRICES RISING APOCALYPTIC' on a fiery background featuring a burning electrical plug and stormy clouds.

From NOT A LOT OF PEOPLE KNOW THAT

By Paul Homewood

Coutinho strikes back!

Just a pity she did not take the CCC to task when she was in power for doing exactly the same in their previous costings!

2023’s ‘Record Temperatures’ Were Not Driven by CO2 Emissions, New Science Paper Finds

It is becoming increasingly obvious to serious climate scientists that sudden changes in temperature and weather cannot be directly attributed to any long-term effect of warming caused by human-produced ‘greenhouse’ gases. Suggestions to the contrary are best left to climate comedy-turn Jim ‘jail the deniers’ Dale and the guided hands writing most mainstream media copy. Last year saw a large spike upwards in global ‘hottest year ever’ temperatures and alarmism went into overdrive. But a recent paper published by the EU weather service Copernicus shows that the warming spike was driven by a strong, naturally occurring El Niño oscillation.

From The Daily Sceptic

By Chris Morrison

It is becoming increasingly obvious to serious climate scientists that sudden changes in temperature and weather cannot be directly attributed to any long-term effect of warming caused by human-produced ‘greenhouse’ gases. Suggestions to the contrary are best left to climate comedy-turn Jim ‘jail the deniers’ Dale and the guided hands writing most mainstream media copy. Last year saw a large spike upwards in global ‘hottest year ever’ temperatures and alarmism went into overdrive. But a recent paper published by the EU weather service Copernicus shows that the warming spike was driven by a strong, naturally occurring El Niño oscillation. Furthermore, the 0.29°C spike is not unprecedented in the observation record since a slightly larger rise occurred in 1976-77.

The Copernicus paper published in the journal Atmospheric Chemistry and Physics is of particular interest because it makes a connection between a strong El Niño developing across the southern hemisphere after a prolonged La Niña. El Niño is the positive phase of the ENSO natural climate variation, while La Niña, which tends to lower temperatures, is the corresponding negative episode. In the years around 2023 and 1976, a strong El Niño occurred after a prolonged La Niña phase. In 1976 the spike was even higher at a reported 0.31°C.

The work published through Copernicus is firmly in the mainstream, so the seemingly obligatory reference is made to the unproven suggestion that global temperatures since 1950 have been rising “principally due to human activities”. This may well be the considered opinion of the scientists involved, conveniently so since such work is unlikely to be published with a different take on the politicised ‘settled’ climate science behind the Net Zero project. However the authors point out that the recent temperature spike has been a societal cause for concern, not least because its causes “are not obvious”. Thankfully such doubts do not unduly cloud the judgements of those engaged in important Net Zero work, including Jim Dale, Justin Rowlatt of the BBC and George Monbiot of the Guardian.

There has been a recent scrabble in climate circles to explain the temperature spike, given the lack of scientific proof linking it to rises in just one trace atmospheric gas, namely carbon dioxide. The authors note the recent reduction in atmospheric particulates or aerosols caused by cleaner marine fuels, increased solar activity and the Hunga Tonga submarine volcano eruption and the associated boost to upper atmosphere water vapour. But they come down on the side of the argument that “ENSO is the primary reason for the global warming spikes”.

Their conclusion is based on two significant recent observations, but they attempt to back up their work by citing the findings of climate models. Such computer models have a poor track record since they are frequently used to provide cover for pre-prepared narratives and conclusions. Whether they can provide useful or conclusive information on the chaotic, non-linear atmosphere is a subject for endless argument, but they are the best we have for attempting to measure climate mechanisms. In their paper, the scientists show that climate models that are subject only to internal variability can generate temperature spikes, although they are an uncommon occurrence. But when a prolonged La Niña immediately precedes an El Niño in the simulations, as occurred in 1976 and 2023, “such spikes become much more common”.

“Thus, our results underscore the importance of the El Niño-Southern Oscillation driving the occurrence of global warming spikes such as the one in 2023, without needing to invoke anthropogenic forcing, such as changes in atmospheric concentrations of greenhouse gases or aerosols, as an explanation,” they conclude.

There have been a number of scientific papers trying to understand the recent temperature spike, although some are inconvenient in failing to support the ‘boiling’ trope and are therefore ignored in the mainstream. As the Daily Sceptic recently reported, a detailed paper from a group of mathematicians and scientists published in Nature found “limited evidence” for a global warming surge over the last the last 50 years. “No change in the warming rate beyond the 1970s is detected despite the breaking record temperatures observed in 2023,” they wrote. It is important to consider random noise caused by natural variation when investigating the recent pauses in temperature, and the more recent “alleged warming acceleration,” they argued.

All of which, of course, helps knock on the head the fast-emerging pseudoscience of weather attribution. These whackadoodle weather findings of computer models attributing individual events to long-term changes in the climate caused by humans feature heavily in mainstream media. In the absence of scientific backing, notably from the Intergovernmental Panel on Climate Change despite its usually alarmist outlook, their political job is to help catastrophise natural events such as hurricanes, flooding and droughts. They are pseudoscience since their claims cannot be disproved or falsified. They are outside the scientific process and are simply opinions. The distinguished climate writer Roger Pielke Jr. calls them “weather attribution alchemy”. It says it all that they are now the main instrument used to alarm and scare populations into believing in a non-existent climate crisis.

Chris Morrison is the Daily Sceptic’s Environmental Editor.

Why Are Scientists So Slow to Abandon Their Failed Climate Models?

Climate modeling has arguably been worse than nothing because false information has been presented as true and “consensus.” Alarmism and disruptive policy activism (forced substitution of inferior energies; challenges to lifestyle norms) have taken on a life of their own. Fire, ready, aim has substituted for prudence, from science to public policy. 

From The Daily Sceptic

BY CHRIS MORRISON

The only way that global populations can be persuaded to embrace the insane policy of removing irreplaceable fossil fuel energy from human society within less than 30 years is to be kept in a perpetual state of fear. The climate must be seen to be tipping, collapsing and generally behaving in a way to turn Mother Earth into an uninhabitable fireball. Step forward the UN-backed Intergovernmental Panel on Climate Change (IPCC) that bases over 40% of its climate impact predictions on the implausible suggestion that temperatures will rise up to 4°C in less than 80 years (current rate of progress over last 25 years – about 0.2°C). Step forward climate scientists who use similar temperature projections to back 50% of their impact forecasts, and step forward trusted messengers in mainstream media who hide behind ‘scientists say’ as a cover for promoting almost any scary clickbait nonsense.

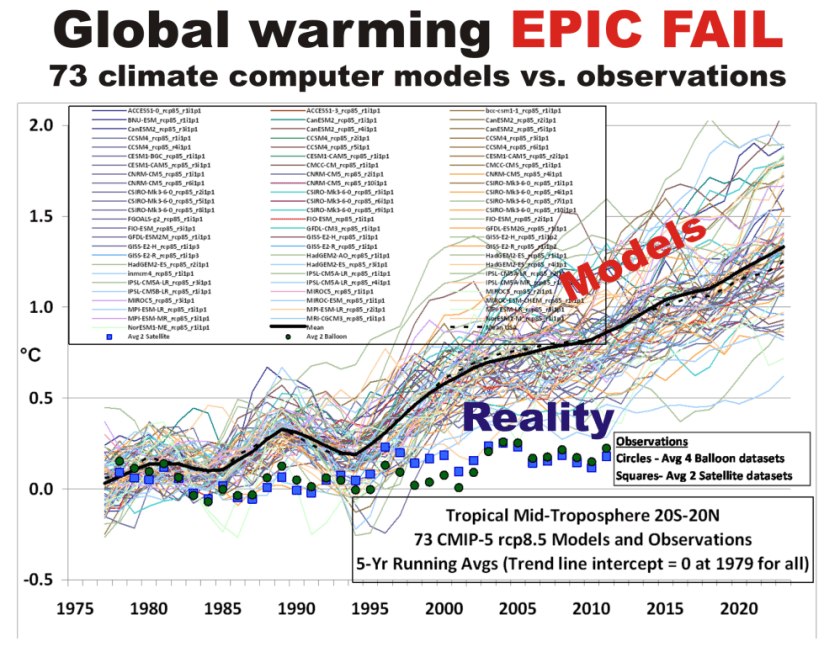
The distinguished academic and science writer Roger Pielke Jr. has been a fierce critic of using a set of temperature and emission assumptions in climate models known as RCP8.5. This scenario suggests temperatures could rise in short order by 3-4°C, and it is responsible for producing much of the propaganda messaging that backs the collectivist Net Zero project. Pielke recently said that the continuing misuse of scenarios in climate research had become pervasive and consequential, “so much so that we can view it as one of the most significant failures of scientific integrity in the 21st Century so far”. Now Pielke has returned to the fray trying to understand how such obvious corruption of the scientific process has been allowed to stand for so long – the short explanation being “groupthink fuelled by a misinformation campaign led by activist climate scientists”.

Pielke starts by noting that he cannot explain why the “error” has not been corrected by the IPCC or others in authoritative positions in the scientific community. In fact, he says, “the opposite has occurred – RCP8.5 remains commonly used as a baseline in research and policy”.

Last March, the BBC ran a story claiming that Antarctica Ocean currents were heading for collapse. To drive home the scare, there was even a reference to the 2004 climate disaster film The Day After Tomorrow. The scientists’ claims were based on computer models fed with RCP8.5 data – a fact missing from the BBC’s imaginative story.

The above graph shows the progress the IPCC made from 2000 to 2014 in upping its baseline scenario to RCP8.5. Watts per square metre (W/m2) refers to the difference between incoming and outgoing radiation, or energy waves, at the top of the atmosphere. The RCP8.5 scenario takes its title from the W/m2 number. Interestingly, it might be noted that climate model temperature forecasts also started to go haywire from the middle of the 2000s, a fact that suggests activist scientists started work in earnest on producing the correct results needed to ferment the exploding green agenda.

Pielke observed that in 2000, the IPCC presented 40 baseline scenarios that described an envelope of possible emission futures. In 2014 it published its fifth assessment report (AR5), and although an earlier draft noted a majority of scenarios were above 6.0 the final report mentioned only RCP8.5. Since then, the IPCC has pulled back a little – noting in the latest assessment report (AR6) that the massive temperature rises are of “low likelihood”. But this admission is not to be found in the widely-distributed ‘Summary for Policy Makers’. A recent highly critical report on AR6 by the Clintel Foundation found that the IPCC was still using RCP8.5 that was “completely out of touch with reality”.

Despite the IPCC appearing to pull back a little, Pielke notes it still has many champions. Recently, the AR5 working group co-chair Chris Field and Marcia McNutt, President of the U.S. National Academy of Science, wrote that RCP8.5 had long been described as a ‘business-as-usual’ pathway with a continued emphasis on energy from fossil fuels with no climate policies in place. This was said to remain “100% accurate”.

How things change in just two decades of relentless green propagandising. In 2000, the authors of the UN’s Special Report Emissions Scenario (SRES) said:

The broad consensus among the SRES writing team is that the current literature analysis suggests that the future is inherently unpredictable and so views will differ as to which of the storylines and representative scenarios could be more or less likely. Therefore, the development of a single ‘best guess’ or ‘business-as-usual’ scenario is neither desirable or possible.

Such is the debate in 2000 of scientists working their way through the scientific process. But little evidence of such questioning can be found within the ranks of scientists following the agenda that has been ‘settled’ for them by political operatives. Today, RCP8.5 is deeply woven into the fabric of climate research and policy, observes Pielke. “Understanding how we got here should provide a cautionary warning for how science can go astray when we allow self-correction to fail,” he hopes. A less charitable view might be, don’t believe a word the IPCC, the legions of activist climate scientists and their useful idiots in the mainstream media say until they rid themselves of the RCP8.5 corruption.

Chris Morrison is the Daily Sceptic’s Environment Editor.

Revealed: Ulez Expansion Predicted to Cut Air Pollution by Just 1.5%

The Ulez ‘discussion’ has all of the same elements, with modelled health benefits calculated by Imperial College and Mayor Khan’s justification that he is “saving lives”, implying that opponents are wannabe murderers. Of course, this time around, the public is thankfully much more sceptical.

From The Daily Sceptic

By ALEX KRIEL

Listening to the discussion over Ulez expansion feels like an action replay of the way in which many were convinced to overreact to Covid, leading to policy responses which caused significantly more harm than good. The Ulez ‘discussion’ has all of the same elements, with modelled health benefits calculated by Imperial College and Mayor Khan’s justification that he is “saving lives”, implying that opponents are wannabe murderers. Of course, this time around, the public is thankfully much more sceptical.

In this short note, we wanted to set out how those ‘lives saved’ numbers are derived and to demonstrate that at best the numbers are seriously misrepresented and at worst completely wrong. In fact, applying the Government and Imperial’s own logic, there is a very strong case to say that the expansion of Ulez will, on balance, harm Londoner’s health when considering the downstream economic consequences of this policy.

The major flaw in Imperial’s model is the one-dimensional nature of its assumption that air pollution drives health and life expectancy. In the real world health is driven by a number of interacting factors with income being the primary driver. There are many assumptions one could dispute that (perhaps unsurprisingly) work towards inflating the claimed health benefits of reducing air pollution, but we focus only on the flaw of largely ignoring policy consequences.

The Imperial team presents several numbers, including: attributable deaths (3,600 to 4,100), improved life expectancy (five to six months) and life-years saved (6.1 million). We wanted to focus on the claimed benefits of the Mayor’s Transport Strategy in terms of life expectancy and life-years saved.

Before leaving attributable deaths, it is important to note that these are not in any sense deaths that can be avoided, nor are they deaths that are subject to reduction by the Transport Strategy. The figure appears to compare current death rates with death rates if all human emissions had been removed for all prior periods. It is a theoretical construct (similar to an unmitigated pandemic) and only a small fraction of this number would be theoretically impacted by road transport (around 15%). Only the going-forward numbers (life-years saved) relate to the Transport Strategy and there the benefits are relatively low at 0.4%. It is important to note that there has only ever been one death, of a young and chronically unwell girl ever recorded in England (56 million population) where the death certificate mentions air pollution. Tragic as this death clearly is, it again highlights the disconnect between the theoretical attribution number and actual deaths recorded; we suggest ignoring the attributable deaths figure.

Looking at the claimed benefits of implementing the Transport Strategy, it is possible for a layman to understand the main assumptions on which these health benefits are based. In summary, it is assumed that reducing 10 µg m-3 achieves roughly a 6% reduction in all cause mortality. Note however 10 µg m-3 is more than all anthropogenic PM 2.5 emissions as estimated for England as a whole, so any benefits are scaled down from 6%. So a 1 µg m-3 reduction generates roughly a 0.6% improvement in life expectancy (i.e., ten times less).

Looking at life-years saved and extended life expectancy, the key assumptions are poorly explained. For those in a hurry, the detail shows that all of the Transport Strategy initiatives to 2050 combined will deliver a projected 0.4% reduction in life-years lost to air pollution using projections to 2154. There is a claimed five to six month extension in life expectancy, so the life expectancy of a London male of around 80 years would be extended to around 80.4 years.

These gains are stated relative to a baseline and for some inexplicable reason the Imperial team has decided to use 2013 pollution levels to establish the baseline and in the process to ignore the available data for 2019. This serves to inflate the baseline.

The acid test is: are the results of modelling compatible with observed reality? And on that basis the Imperial Ulez modelling falls flat. The model covers the impact of the entire Transport Strategy to 2050 which covers many more steps than Ulez. The Imperial document is somewhat vague about what those steps are – they are cryptically referred to as 2025 LES, 2030 LES and 2050 LES. It is enough to note that the goal of Mayor Khan’s 2018 Transport Strategy is to “aim for 80% of all trips in London to be made on foot, by cycle or using public transport by 2041”. So the first thing to clarify is that the claimed 6.1 million saving of life years relates to a significant number of measures, well beyond Ulez expansion. In effect these combined steps will largely eliminate private car traffic.

The chart below is constructed from the Imperial material and shows that PM 2.5 µg m-3 population weighted (PWAC) pollution falls over a number of steps and Ulez on a standalone basis has a near zero impact. Also, you can also see that a fair chunk of gains have already been banked between 2013 and 2019.

The failure of Ulez to achieve any meaningful reduction in pollution is very clearly shown in a separate document prepared by Jacobs which looks at the impacts of Ulez only. The table below shows the impact of Ulez expansion on PM 2.5 µg m-3 concentration, with an estimated improvement of less than 2%.

There is a slightly better outcome for NOx pollutants which are reduced by 5.4% across Greater London. This feeds in to the health impact assessment which unsurprisingly shows near zero benefit from Ulez for PM 2.5 reductions, for most health-related metrics.

Looking at life expectancy, the report does acknowledge that due to the large population (around 8.9 million) and the extraordinary long time period over which these benefits are expected to crystalise (up to 2154) then there are around 1.5 billion life-years involved (years × population). For any stated benefit to be meaningful, it needs to referenced to the base case value. The 6.1 million life-years saved is then within the context of a total of around 1.5 billion life-years; this saving is around 0.4%. Correspondingly, the impact on life expectancy from all of the pollution schemes (not just Ulez) adds up to around 22 to 27 weeks additional life expectancy. In the context of male life expectancy of 80 years (roughly) this would improve to 80.4 years as a consequence of 30 years’ worth of restrictive climate policies (ignoring any economic consequences).

The core flaw in the calculation is the one-dimensional thinking that underpins this (and all similar calculations) in that all reductions in PM 2.5 concentrations lead to a reduction in the mortality rate. This thinking ignores any link between people’s incomes and health outcomes, which is the primary driver of health. This is the same dishonest cop out that Professor Ferguson made in his infamous Covid paper. This facilitates a myopic focus on ‘safety’ and generates solutions that do far more harm than good.

In setting out the methodology that states that health outcomes will improve with a reduction in air pollution on a more or less linear basis, the Government’s own figures show that real world data prove that this assumption is not correct (or at least over-simplified). Its own data for the regions of the U.K. show that (if anything) this relationship is reversed.

Life expectancy in Scotland is much lower despite having far and away the lowest concentration of anthropogenic PM 2.5 pollutants. Many studies with and between countries show this clearly (e.g. life expectancies by national deprivation deciles, England: 2018 to 2020).

In order to get a handle on how much more significant factors other than PM 2.5 can be, we looked at a recent paper that considers the impact of changes in different factors on life expectancy across 29 European countries (the paper also looks at each factor in isolation using multivariate analysis). The chart below shows the life expectancy impact of a 1% change in the listed factors. There are of course some caveats, but you can immediately see that economic activity dominates the outcomes with a 13-month gain in life expectancy for a 1% gain in GDP versus say a 2.7 month gain for a 1% change in PM 10-2.5. Also note there is no statistically significant relationship between CO2 and life expectancy.

In another section of the same paper the author states: “France and Sweden, some of the countries closest to their potential LE (life expectancies), are also amongst those with the highest NOx level.” The real message, though, is that if you dent people’s income by narrowly pursuing PM 2.5 reduction, you will, on balance, shorten life expectancy and not increase it. The Jacobs’ report confirms that there will be multiple negative impacts on business and economic activity. We guess that on balance Ulez will lower life expectancy when factoring in the impacts on business and family incomes, as well as quality of life considerations.

In the post Covid world, we have understood that politicians of all stripes will shamelessly use emotional manipulation in order to get reasonable people to comply with their unreasonable edicts. That is why understanding how reliable, or otherwise, attributable deaths, life-years saved and life expectancy figures are is so important. You can almost guarantee that these estimates will be manipulated and potentially used to rationalise illogical and damaging policies.With opaque models it is relatively easy to produce results to order.

The political process assumes that the individuals involved are able to understand competing objectives and arrive at a sensible compromise. However, we saw in the case of Covid that many politicians have limited scientific understanding and will tend to pursue unachievable safety, at any cost.

The State seems to be redefining its role with a narrow group of ideologically-driven technocrats setting somewhat arbitrary targets. Achieving those targets requires wholesale changes to people’s lives. Very often economic, mental health and other impacts are barely considered and historically established constitutional boundaries between the State and the citizen are often ignored.

In the case of Ulez expansion, the 59% of respondents to the public consultation who clearly opposed the expansion were simply ignored.

Various sops will no doubt be offered to voters, but is it important that readers realise that there is a direction of travel to these various steps. Finally, remember Albert Camus’s wise warning that, “The welfare of humanity is always the alibi of tyrants.”

Alex Kriel is by training a physicist and was an early critic of the Imperial Covid model. He is a founder of the Thinking Coalition, which comprises a group of citizens who are concerned about Government overreach. This article was first published on the Thinking Coalition website. Sign up for updates here.

Were the Lockdowners and Vaccinators Really Just Trying to Save Lives?

In this sense, then, Hadas’s thesis seems undeniable: the millions who signed on to lockdowns and demanded their governments force-vaccinate their peers were not just wrong in a direct, empirical sense – that is, for believing that lockdowns and vaccines would improve health in any way. They were also much more profoundly wrong in a moral sense.

From The Daily Sceptic

By EUGYPPIUS

Daniel Hadas, whose sensitive and measured commentary on the pandemic I’ve long valued, recently offered these remarks on lockdowns and mass vaccination on Twitter:

It needs to be understood that the true motivation of the lockdown and forced vaccination Covid response really was Saving Lives.

Saving Lives wasn’t a smokescreen for some other hidden plan.

Of course, there was opportunism: there were those who used the state of emergency to claw power, money, fame to themselves. There were both supporters and opponents of the Covid measures who did that.

Where [there] is opportunity, there will be opportunists.

But mere opportunism is not enough to drive forward the leaders and followers in a revolution on the scale of the Covid response.

That requires faith, and the faith that drove this revolution was the faith in Saving Lives.

To deny the authenticity of the project to Save Lives is to remain perilously ready to sign up to all current and future projects to remake society and morality in the name of Life-Saving.

nd it is to remain blind to the fact that Saving Lives has come to mean hacking away at the limits of what can be done to men, women and children in the name of saving their lives and those of others.

This thesis angered many people, at least some of whom misconstrue what Hadas is arguing. The point is not that a genuine commitment to ‘Saving Lives’ might excuse the response or make it better. Rather, a commitment to Life-Saving public health interventions is in Hadas’s view the ominous root of the problem, because Life Saving is in fact a shallow goal that sounds good enough to rationalise all manner of harmful, destructive policies. Almost anything can be justified – any amount of collateral damage accepted – if it is for Saving Lives, and this is why all of us should cultivate a distrust of self-appointed Life Savers everywhere we encounter them.

In this sense, then, Hadas’s thesis seems undeniable: the millions who signed on to lockdowns and demanded their governments force-vaccinate their peers were not just wrong in a direct, empirical sense – that is, for believing that lockdowns and vaccines would improve health in any way. They were also much more profoundly wrong in a moral sense. Even if lockdowns and vaccines had the potential to stop the virus, nobody deserves house arrest or forced medical treatment for the crime of being a potential vector of infection. Placing Life Saving ahead of all other outcomes is very dangerous and also very stupid, for the simple reason that we are all going to die. As a justification, it functions as a mere pretence to ignore the very real trade-offs that lurk in any alleged solution to anything. Explaining how it could be a good idea to delay the deaths of some elderly and sick people at the cost of the well-being, physical health and autonomy of billions is very hard. Pleading that ‘we need to save lives’ is easy.

That said, I find the thesis less than complete. The public health establishment and its media collaborators carefully manufactured public support for their response by sowing far and wide the belief that it was necessary to Save Lives. Had we acted otherwise – say, by staying open and not doing very much – this, too, would have been marketed as the Best Way to Save Lives, and many millions would have believed it just as sincerely as they believed in lockdowns. To this comes the fact that Life-Saving in one form or another is proffered as justification for a wide range of modern political pathologies, from mass migration schemes to climate change. Especially in ageing European countries like Germany, where an ever-growing number of pensioners and their health anxiety dominate national discourse, there are few better ways to sell noxious political programmes to the masses. Without our naïve Life-Saving ethos, it’s not clear to me we wouldn’t have had lockdowns, though they would have required a much different kind of argument.

The extent to which states can be said to act upon clear motives at all is a further problem. A longstanding Plague Chronicle argument is that modern managerial government doesn’t have goals, motivations or purposes in any human sense. Our countries everyday do all kinds of truly insane things behind paper-thin justifications that bear no scrutiny. A lot of what is maligned as ‘conspiratorial’ discourse, on both the Left and the Right, represents an effort to reimpose logic on state actions, generally by positing that the stated goals are a pretence for some deeper, hidden purpose. Most of the time these analyses just aren’t convincing, and they function to obscure the blunt reality that we find ourselves beset by an incomprehensible post-liberal political order, in which state actions have been farmed out to a vastly complex network of stakeholders, NGOs, academics, bureaucrats and special advisory committees. For every area of policy the constellation of forces will be different, and nobody has any clear understanding of how the system works – not even the most powerful individuals in the midst of it all. Everything the state does is the sum of these thousands of different forces. What complicates this picture even further, is the fact that those responsible for policy formulation don’t act directly to shape outcomes in the outside world. Their motivations are almost always institutionally mediated, and for this reason much more confined and limited in perspective. They want to secure promotion and grant funding, they want to be thought well of by their peers, they want to satisfy their superiors, and many other petty careerist personal things of this nature.

To say that ‘climate change policy’ is motivated by a desire to reduce carbon emissions, then, is merely to outline a descriptive thesis from outside. Such a thesis will sink or swim insofar as it explains actions of the system as a whole, but no such motivation is present in the system itself. The apparatus of modern governance is a vast inhuman machine consisting of human components; it doesn’t have thoughts any more than a storm system does. And in this sense, I think Saving Lives as the motivation behind lockdowns and mass vaccination is not quite right. Popular supporters of mass containment certainly saw these policies as Life Saving, and this helped enable them. The state itself, however, was playing a rather different game, one which fell (depending on the country) somewhere on a scale from ‘virus suppression’ to ‘virus eradication’ – lives be damned. The pandemicists’ abandonment of prior mitigationist plans in favour of mass containment entailed precisely deprioritising Life Saving in favour of a new, pathogen-centred approach.

“That may very well be, Eugyppius, but what of the people at the start of it all, before lockdowns were taken up by the system? Surely they had human motivations, even if the regime cannot.”

This is true. The Neil Fergusons, Tomas Pueyos and Christian Drostens who sold lockdowns to their countries and the world surely did so for specific, personal reasons. The problem is that these reasons are very elusive. In fact, the more I read their early statements and their leaked correspondence, the more elusive they seem to me. Their words and actions, however, have a very clear and persistent sinister undertone, which is not a mere artefact of retrospect. Their mysterious coordination with each other, their willingness to engage in highly manipulative messaging and risk magnification, their reliance on foreign agents to launder research and strategies from China, and their constant efforts to justify with pseudoscientific findings apparently preconceived conclusions, are all very unsettling. The ambient Life-Saving ethos of modern society surely helped them win the argument in the moment and get away with it in the longer term, but whatever they thought they were up to, may have been something much different.

This article originally appeared on Eugyppius’s Substack newsletter. You can subscribe here.

New research ponders consequences of ocean iron fertilization

Any deliberate large-scale interference in natural processes must be fraught with risks and difficulties. Nevertheless some scientists think they should seek to impose their will on nature, invoking climate models and CO2-obsessed theories as the excuse.

From Tallbloke’s Talkshop

July 7, 2023 by oldbrew 

Any deliberate large-scale interference in natural processes must be fraught with risks and difficulties. Nevertheless some scientists think they should seek to impose their will on nature, invoking climate models and CO2-obsessed theories as the excuse.
– – –

Removal of excess carbon dioxide in the atmosphere, in addition to major reductions in ongoing emissions, is required to stave off the most severe consequences of climate change, claims EurekAlert [Talkshop comment – without offering any evidence].

Large-scale ocean iron fertilization is one of several strategies that could help remove carbon dioxide, but new research published this week in Global Change Biology by a Bigelow Laboratory for Ocean Sciences researcher and colleagues shows that it might also negatively affect marine ecosystems in far corners of the ocean.

Using advanced models of ocean biogeochemistry and ecology, the team showed that iron fertilization in the Southern Ocean could exacerbate climate change-driven nutrient shortages and productivity losses in the tropics, potentially hurting the coastal fisheries on which many people rely.

The findings illustrate both the interconnected nature of the ocean and the need for more objective research on the relative advantages and unintended consequences of marine carbon dioxide removal.

“These modeling experiments demonstrate the need to understand not only the implications of marine carbon dioxide removal strategies for carbon cycling, but also the ecological and ‘downstream’ implications, even those decades in the future or thousands of miles away,” said Bigelow Laboratory Senior Research Scientist Ben Twining, one of the study’s co-lead authors.

The ocean is the planet’s largest sink for carbon emissions. Unsurprisingly, then, plans for carbon dioxide removal are increasingly focused on marine-based strategies like iron fertilization.

The basic idea is that adding valuable micronutrients to certain areas of the ocean — like the iron-limited Southern Ocean — will stimulate primary productivity by allowing other nutrients to be more completely consumed, enhancing the amount of carbon dioxide that phytoplankton absorb at the surface and, ultimately, sink to the seafloor when they die.

Advocates for ocean iron fertilization have pointed out that the solution doesn’t require land or freshwater and can be implemented more quickly than other strategies. And past modeling efforts have shown that iron fertilization does indeed reduce atmospheric carbon.

However, early research also showed that fertilization could exacerbate a process known as “nutrient robbing” by hampering the supply of critical nutrients from iron-limited areas to adjacent regions, in turn reducing the amount of marine life and productivity at the tropics.

On top of that, a 2021 report by the U.S. National Academies of Science argued that the current knowledge base around marine carbon dioxide removal approaches like fertilization was insufficient, especially when it came to scientists’ understanding of how fertilization would interact with other climate-change driven changes to ocean processes.

To help fill some of those knowledge gaps, the authors of the current study expanded previous modeling work, incorporating recent research on how phytoplankton use micronutrients like iron and additional considerations for climate change and fisheries impacts.

“One of the new aspects of our work was to layer ocean iron fertilization on top of climate change,” Twining said. “We also connected our results to a fisheries model, as a way to put the predicted changes in productivity into terms that are more meaningful to people.”

Their results showed a five percent decline in the biomass of fish and marine species in the tropics, including economically important coastal areas, due to large-scale iron fertilization. This was on top of a 15 percent decline expected due to climate change as warming temperatures stratify the ocean, depriving the surface of critical nutrients.

“It’s notable how the ‘fingerprint’ of ocean iron fertilization on the levels of nutrients was similar to that expected from climate change,” said co-lead author of the study, Alessandro Tagliabue at the University of Liverpool. “This raises significant hurdles to the detection and monitoring of any negative impacts of fertilization.”

Full article here.

1903 Ulysses Storm among windiest ever in British Isles

A mighty storm that tore across Ireland and the UK more than a century ago produced some of the strongest winds the British Isles have ever witnessed..

From NOT A LOT OF PEOPLE KNOW THAT

By Paul Homewood

h/t Euan Mearns

This is a very interesting read:

A mighty storm that tore across Ireland and the UK more than a century ago produced some of the strongest winds the British Isles have ever witnessed.

Scientists reviewed Storm Ulysses of 1903 by digitising paper-based weather readings from the time and subjecting them to a modern reanalysis.

Many places would have felt gusts in excess of 45m/s (100mph or 87 knots).

The cyclone left a trail of death, shipwrecks, smashed infrastructure, uprooted trees and widespread flooding.

“We think it is likely that the winds were stronger in some locations than anything in the modern period 1950-2015,” explained Prof Ed Hawkins from the University of Reading and the National Centre for Atmospheric Science.

“The precise values are a bit uncertain as the reanalysis does not produce gust values at the surface but they would have been pretty high to cause the damage we see in photos from the time – on a par with big storms in 1990, 1997, 1998 and the Great Storm of 1987,” he told the BBC.

Storm Ulysses is so called because it inspired a passage in James Joyce’s famous novel Ulysses.

The windstorm blasted through the British Isles over 26 and 27 February. Its track ran across Ireland, northern England and Scotland.

The Times newspaper recounted widespread damage, a sizeable number of injuries, and fatalities.

The Royal National Lifeboat Institution (RNLI) reported 10 significant crew rescues from distressed ships. A pier in Morecambe was damaged, and a train in Cumbria was blown over.

Ulysses’ ferocity was well recognised at the time. But by reanalysing the raw weather observations from 1903, using the very latest modern numerical modelling techniques like those that produce today’s daily forecasts, researchers have now obtained a new, more detailed appreciation of the event

Read the full story here.

What is particularly interesting is how this new reanalysis compares with what was reported at the time:

https://digital.nmla.metoffice.gov.uk/IO_5b71781a-3386-40f9-9093-ece63944a34e/

It is now believed that many places experienced gusts of over 100 mph, which is well above anything actually recorded at the time. As we find with hurricanes, anemometers in the past were often not in the places where gusts are highest. Whereas as now we have a host of automatic monitors in the most exposed places.

Storm Ulysses shows why it is difficult to make direct comparisons with storms in the past.