Global warming, climate change, all these things are just a dream come true for politicians. I deal with evidence and not with frightening computer models because the seeker after truth does not put his faith in any consensus. The road to the truth is long and hard, but this is the road we must follow. People who describe the unprecedented comfort and ease of modern life as a climate disaster, in my opinion have no idea what a real problem is.
According to a June 23 New York Times report, “Former NOAA Employees Revive Climate Site Shut by Trump Administration,” a small group of former NOAA employees has recreated much of the former Climate.gov website under a new domain, Climate.us, after the original site was effectively retired during the Trump administration. The project reportedly involved former NOAA staff, approximately $280,000 in crowdsourced funding, and the painstaking recataloging of more than a thousand reports, datasets, articles, and educational resources.
According to a June 23 New York Times report, “Former NOAA Employees Revive Climate Site Shut by Trump Administration,” a small group of former NOAA employees has recreated much of the former Climate.gov website under a new domain, Climate.us, after the original site was effectively retired during the Trump administration. The project reportedly involved former NOAA staff, approximately $280,000 in crowdsourced funding, and the painstaking recataloging of more than a thousand reports, datasets, articles, and educational resources.
The Times presents the effort as a heroic restoration of a valuable public resource. Perhaps. But there is another way to look at it.
The fact that a handful of former government employees devoted substantial time and money to rebuilding a climate communications website demonstrates something many observers have long understood: the climate movement is not disappearing simply because the political environment has shifted. Far from it.
If anything, this episode illustrates the determination of climate advocacy networks to preserve and perpetuate their institutional infrastructure regardless of who occupies the White House.
What Exactly Was Lost?
One detail in the Times story deserves particular attention: NOAA communications director Kim Doster stated that research products previously housed under Climate.gov would remain available through NOAA.gov and affiliated websites.
That raises an obvious question: if the underlying data, research products, and reports continue to exist elsewhere within NOAA’s web ecosystem, then what exactly was being “saved”?
The answer appears to be less about preserving raw scientific information and more about preserving a particular presentation and advocacy interpretation of that information.
Climate.gov was never merely a repository of temperature records, satellite measurements, or hurricane statistics. It functioned as a communications portal designed to translate climate science for public consumption. As the Times itself notes, supporters valued it because it was aimed at teachers, journalists, and the general public rather than exclusively at researchers. In other words, it was a climate marketing tool.
That distinction matters. Scientific data and scientific advocacy/messaging are not the same thing. The existence of a website devoted to interpreting climate information through a particular institutional lens does not automatically make that interpretation indispensable.
The Problem of Relevance
There is another issue that deserves consideration. Much of the material being restored was created under assumptions, projections, and narratives that may or may not remain relevant to current conditions.
Climate science evolves. Datasets change, methodologies are revised, models are updated or canceled, and forecasts are adjusted. Simply recreating an archived website does not guarantee that every article, educational resource, or explanatory document remains useful or accurate in light of current observations.
Indeed, one of the recurring problems in climate communication has been the tendency to preserve alarming projections long after real-world observations have complicated the original narrative.
That is why skepticism remains important. The question should never be whether information can be preserved. The question should be whether that information remains relevant, accurate, and consistent with observed reality.
Archiving material is easy. Critically evaluating it is harder.
Climate Advocacy Never Takes a Vacation
The broader lesson from this story is political rather than scientific. Many commentators have suggested that recent political changes represent some sort of permanent turning point in the climate debate. The reduction of federal climate programs, the restructuring of agencies, and the reassessment of various climate policies have led some observers to conclude that the era of climate alarmism is winding down.
That would be a mistake. History shows us that movements built over decades do not disappear overnight. The recent rise of irrational socialism is a perfect example.
The Climate.us project demonstrates that there remains a substantial network of activists, former officials, advocacy organizations, academics, and donors committed to maintaining the climate narrative regardless of changes in government priorities.
When one institutional pathway closes, another opens, when one website disappears, another appears, when one source of funding dries up, new funding sources emerge.
This is not unusual. It is how political and ideological movements operate. The climate movement is no exception.
A Preview of What Comes Next
The political winds are always changing, anyone who believes today’s policy environment will remain unchanged indefinitely has not been paying attention to history.
Administrations change.
Congressional majorities change.
Agency leadership changes.
Public priorities change.
When those changes occur, climate advocacy organizations will be positioned to move aggressively. The infrastructure is being maintained now precisely because its supporters expect future opportunities.
That is perhaps the most important takeaway from this story. The people rebuilding Climate.gov’s advocacy platform are acting on the assumption that climate politics remains a long-term project.
They are probably correct. Clearly, in their minds, the debate is not ending. It is merely entering another phase.
Why WUWT Matters
For that reason, websites such as Watts Up With That remain as important as ever.
The role of WUWT has never been to suppress information. It has been to examine claims, challenge assumptions, scrutinize data, and ask questions that many institutional climate organizations would prefer not be asked.
That mission becomes even more important when climate communications efforts become increasingly centralized and insulated from criticism.
Independent scrutiny is essential.
Scientific claims deserve examination.
Model projections deserve comparison against observations.
Policy proposals deserve cost-benefit analysis.
Public communications deserve fact-checking.
Those responsibilities do not disappear when political circumstances appear favorable to climate skeptics.
If anything, this is precisely the moment when skeptical analysis must remain vigilant.
The recreation of Climate.gov under a different name serves as a reminder that climate advocacy infrastructure is resilient and persistent. Supporters of climate alarmism are investing significant effort to preserve the narratives, educational materials, and communication channels they regard as essential.
Those who favor open debate, transparency, and rigorous examination of climate claims should be equally committed to preserving institutions that provide critical analysis and alternative viewpoints.
Because one thing is certain: the climate debate is not going away, it is just waiting for the political winds to shift.
Political fortunes rise and fall. Administrations come and go. Government priorities shift, but the underlying contest over how climate science is interpreted, communicated, and used to justify policy will continue.
And when the political pendulum inevitably swings again, the push for expansive climate and energy policies will likely return with renewed vigor. That is exactly why independent skeptical voices must remain active, engaged, and prepared for the long haul.
We will have the 20th anniversary of WUWT in November; we’ve done it all without government grants, and we survived oppression, demonetization, and blacklisting by Google and other search platforms.
“Climate science is the worst example to try to explain and defend the scientific method. But will Andrew Dessler seriously reconsider his unrealistic view of climate science in theory and practice? Climategate exposed the bias that has continued to this day.”
“Climate science is the worst example to try to explain and defend the scientific method. But will Andrew Dessler seriously reconsider his unrealistic view of climate science in theory and practice? Climategate exposed the bias that has continued to this day.”
The romantic view of government sees wise, selfless rulers implementing policy to better the common good. Never mind that many alleged market failures are government-related on close inspection, and ‘government failure’ (the political process as described by Public Choice economics) must be weighed against ‘market failure’.
Enter climate experts relying on global climate modeling. Enter Andrew Dessler, atmospheric scientist at Texas A&M University, who doubles as a climate alarmist/campaigner. “Angry Andy” has no appetite for critics of his view of settled science and impending doom short of Big Government (Big Climate Brother). [1] He knows what’s best and wants to save us from ourselves–and with an Amway look in his eye.
Andrew Dessler has fooled himself. In an attempt to capture the common sense, moral high ground, he presents the following description of good science without seriously seeing how climatology has sabotaged itself for “the cause.” [2] His bio states:
I spent 2000 as a Senior Policy Analyst in the White House Office of Science and Technology Policy (photo). While there, I became aware of a profound lack of understanding among policymakers and the general public about how science works and how to interpret the conflicting claims one often hears in policy debates. Based on that experience, I wrote a book that uses examples from the climate change arena to explain how science is used and misused in the policy arena.
Arguments over any scientific topic — climate change, vaccines, you name it — revolve around competing claims. For climate change, the claims are: Is the Earth warming? Are humans to blame? What will the impacts be? Over the last 150 years, the scientific community has developed a remarkably robust method for sorting out which claims are true and which aren’t. That method is what I want to walk through.
Comment: Dessler is being vague with his qualitative questions. Jumping from the human influence to “impacts” (highly negative to him) is subtle deceit.
So how does science generate knowledge? If you ask a high schooler, they’ll give you the version they learned in ninth grade: an individual scientist forms a hypothesis, runs an experiment, and draws a conclusion. That’s more or less what happens at the individual level, though in practice it’s more iterative — you design, test, and refine all at once, landing on a slightly different idea each time until you reach a conclusion about whatever hypothesis you’ve ended up with.
Comment: Dessler again hides the weenie. Climate models are far from objective when it comes to “design, test, and refine.” Models are causality deficient and not testable as is CO2 science performed under other-things-equal conditions (the greenhouse).
But this isn’t science. It’s only step one. Any individual scientist can make mistakes — scientists are human. Maybe there’s a bug in the code, maybe there’s an error in the experiment. Just because someone ran an experiment and reached a conclusion doesn’t mean it’s right, and scientists don’t treat a single result as settled truth.
Comment: Experiments? This scientific method is beyond climate models, what Dessler conveniently hides (more deceit). And what about the Climategate scientists who were the cream of the IPCC crop? Experiments under the scientific method are controlled, just the opposite of the gravy train of climate ‘science’.
Step two is peer review, the first layer of quality control. The scientist writes up what they did and submits it to a journal, which sends the paper to other experts in the field. Those experts judge whether the methods are sound, whether it properly references prior work, and whether the conclusions actually follow from the data. Ask any scientist and they’ll tell you peer review is miserable — the comments come back brutal, often harsh, and you have to revise and resubmit, sometimes multiple times, before an editor finally accepts the paper.
Comment: Peer review? Back to Climategate. “I can’t see either of these papers being in the next IPCC report. Kevin [Trenberth] and I will keep them out somehow, even if we have to redefine what the peer-review literature is!” – —Phil Jones, Director of the Climatic Research Unit, July 8, 2004.
Peer review catches an immense amount of bad science, but it can’t catch all of it. Reviewers get sloppy or overworked, they miss obvious mistakes, and they can’t catch hidden errors — a bug in the code, a misread instrument. So a peer-reviewed paper making it into a journal doesn’t mean the paper is right. Nobody treats a single paper as the final word.
Comment: Inherent biases of researchers with a “cause” and retractions and new-replacing-old explains a lot of climate alarm. Why has ‘peer review’ failed on a variety of population and resource issues since the Paul Ehrlich heyday in the 1960s? Neo-Malthusianism has passed the review test in such publications as Science and Nature from the beginning.
That’s where step three comes in: the crucible of science. Important results get retested by the broader community. If you publish something interesting, it gets dissected. Sometimes people try to reproduce your work directly but more often they test its implications. If someone claims X is true, and that implies that Y is also true, then scientists will go check Y. If a claim survives this gauntlet long enough, it becomes accepted. That’s how we generate knowledge.
Let me give an example: the ozone hole. In 1985 — and I doubt many people watching were around then, but I remember it well — Joe Farman and his colleagues published observations from Antarctica showing that a huge chunk of ozone was disappearing every year.
Comment: Okay, give us some examples from the mainstream climate science literature. The predictions from the 1980s to the present. Oops, can’t go there. More deceit from the-fix-is-in Dessler.
Through this process, a consensus emerged. And it’s worth being clear that this consensus is organic. There’s no vote, no poll, no meeting where it gets decided. Scientists go to conferences, talk to one another, and independently arrived at the same answer. It’s the ultimate free market of ideas. After the consensus was established, the peer-reviewed literature doesn’t even mention the rival theories — it simply takes chlorine chemistry as given. That’s what a consensus looks like. It doesn’t mean every single scientist agrees, but it does mean there’s no longer any legitimate debate.
Comment: And what does this have to do with the alarmist conclusion of physical climate science? The rest of the story please.
So where can you see what scientists actually think? It’s all in the peer-reviewed literature, which contains the entire historical record of the argument: the discovery, the competing theories, the debate, the testing, and finally the community coalescing around one answer. But there’s a lot of room for misrepresentation. You can dig up an old paper claiming the ozone hole was caused by dynamics and wave it around as if there still was a debate about the cause of the ozone hole — without mentioning that the idea was disproven long ago and that even its own authors no longer believe it.
Comment: And regarding CO2 as a major negative and threat to the future of human flourishing? That is the debate.
There’s a bigger problem, though: the peer-reviewed literature is written in a language I call “nerd.” It’s extremely hard to read — honestly, some of it is hard for me to follow. It takes graduate students years to work through the literature in a single field, so we can’t expect policymakers or ordinary people to do it.
Comment: And look at the ruined reputation of climate science, based on climate models and polluted by activists (such as Dessler) who look to politics and government first.
This is where scientific assessments come in. The most famous is the IPCC — the Intergovernmental Panel on Climate Change. The job of an assessment is to read and summarize the peer-reviewed literature, synthesizing what’s settled, what’s been disproven, and what remains genuinely debated.
Comment: Sorry, but the IPCC is thoroughly politicized. As Dessler said about the IPCC Climategate gang back in 2009: “There is no doubt that these emails are embarrassing and a public-relations disaster for science.”
To ensure the assessments accurately summarize the peer-reviewed literature, assessments are written by large teams, which are far less prone to bias than individuals and which dilute the influence of any one scientist with an axe to grind. The teams are deliberately assembled to avoid stacking the deck, and the reports themselves go through multiple rounds of peer review. That rigorous process is exactly why you can trust them and why people consider the IPCC to be the gold standard of what we know about the climate system. An assessment produced through a different process may well not be credible.
Comment: “… why people consider the IPCC to be the gold standard of what we know about the climate system. An assessment produced through a different process may well not be credible.” Sorry, but outside of The Tribe (a term used by Judith Curry), consensus is not science. Qualitative relationships do not mean climate alarm–that is where the bias, tribe, and cause come in.
You can even watch the consensus evolve across assessments. Take the attribution of warming. The 1990 IPCC report said the observed warming was broadly consistent with model predictions but also comparable to natural variability — in other words, we don’t know whether humans are responsible. By 1995, it concluded that the balance of evidence suggested a discernible human influence — a sentence only a committee could write, and one that barely commits to anything. By 2001, most of the warming over the previous 50 years was judged “likely” due to greenhouse gases; by 2007, “very likely”; by 2013, “extremely likely.” The 2023 report says essentially the same as 2013 — there’s not much stronger language available.
Comment: That aside, is the human influence good or bad? Deep Ecology’s guilty-until-proven-innocent does not cut it. A simple task such as dividing the warming into max and min increases and by month would be a good start to estimate benefits and costs. Focus on that, Professor Dessler. Data trumps models, right? Government is hardly the institution of effective change.
So, to wrap up: science is our ultimate tool for deciphering the universe — the most successful method we’ve ever developed for determining what’s true and what isn’t. Our understanding is written into the peer-reviewed literature, so if you want to know what scientists think, that’s where to look. And for those of us who don’t speak nerd, scientific assessments are the Rosetta Stone — they translate nerd into English.
Comment: And the skeptics of climate alarm and forced energy transformation agree and ask for climate science to follow the scientific method, as done in the separate field of CO2 Science.
Summary
Dessler has fooled himself in his romantic view of climate science, which is one of the worst if not the worst offender of the scientific method. My major points are restated (and Dessler is invited to respond, implicitly or explicitly):
Climate modeling is at the core of physical climate science. Yet global climate reproductions are causality-deficient and not testable per the scientific method. CO2 science, conducting experiments in greenhouse (‘other things equal’) conditions is the opposite (and beneficial). Settled science? Nope. As MIT climate scientist Kerry Emanuel noted: “I actually share with [opponent] John [Christy] an inherent distrust of complicated models. I don’t like them particularly. It’s one of the necessary evils.”
The RCP 8.5 base case, which launched a thousand journal articles, has been abandoned by the climate establishment. This related to the climate modeling problem, above.
Peer review? Consider this quotation from the Climategate emails (Phil Jones, 2004): “I can’t see either of these papers being in the next IPCC report. Kevin and I will keep them out somehow — even if we have to redefine what the literature peer-review status is in the late 2000s.” Dessler himself admitted: “There is no doubt that these emails are embarrassing and a public-relations disaster for science” (2009)].
Government funding and self-interest working in unsettled space is a recipe for pseudoscience. A climate scientist, owing to a number of factors, can simply chose to investigate the negatives of the human influence on climate rather than study the positives. And by making a convenient assumption (RCP 8.5), the worst-case scenario is presented as ‘science’.
Consensus is not science. Climate science is unsettled. MIT’s Emanuel, author of What We Know About Climate Change, remarked: “If I’d written a book called What We Don’t Know about Climate Science, it would have been an encyclopedia.”
The IPCC process has been compromised by politics between the core of the report to the Summary for Policymakers to the media interpretation of the Summary without correction by the scientific community.
Physical climate science is just the beginning. Public policy must also consider climate economics (which Dessler rejects: “In order to solve the climate problem, the first thing we need to do is ignore the economists”) and government failure alongside alleged market failure and analytic failure.
Climate science is the worst example to try to explain and defend the scientific method. But will Andrew Dessler seriously reconsider his unrealistic view of climate science in theory and practice? Climategate exposed bias that has continued to this day.
It is time for humility and a start-over. Climate alarmism is old, largely falsified, and rightfully demoted in the public eye. Realism and depoliticization can bring physical climate science back to the realm of respected science.
“If you’re pushing fossil fuels at this point, you’re anti-human.”
I find the path we’re on now — the rich world survives (if lucky), but abandons everyone else — to be morally problematic.
Hey assholes. We’ve been telling you for decades that this was going to happen if we didn’t reduce greenhouse gas emissions. You didn’t listen and now it’s all happening. We hope you’re happy. Enjoy the heatwaves, intense rainfall, sea level rise, ocean acidification, and many other things, you fucking morons.
[2] This infamous term was used by Michael Mann in a Climategate email (May 30, 2008): “I gave up on Judith Curry a while ago. I don’t know what she thinks she’s doing, but it’s not helping the cause, or her professional credibility.”
The Media does not neutrally transmit IPCC findings. It applies its own filters, consistently tilting toward greater drama and urgency.
Media framing of the IPCC tends to amplify urgency and severity, often emphasizing worst-case or dramatic elements while simplifying or compressing uncertainty language.
The Media does not neutrally transmit IPCC findings. It applies its own filters, consistently tilting toward greater drama and urgency.
This is a predictable outcome of journalistic incentives rather than a conspiracy, but it underscores the value of going to primary sources (full reports, Technical Summaries) for balanced understanding. Independent AI-driven analyses like Galiani et al. offer promising tools for quantifying these distortions going forward.
Media framing of the IPCC tends to amplify urgency and severity, often emphasizing worst-case or dramatic elements while simplifying or compressing uncertainty language.
This aligns with the Galiani et al. preprint discussed in Roger Pielke Jr.’s Substack, which found a consistent severity shift (+5% to +9% on their scale) and uncertainty compression as IPCC content moves into newspaper coverage from major US/UK outlets.
Pielke’s June 8, 2026 Substack piece presents the Galiani et al. preprint as potentially groundbreaking empirical evidence of systematic amplification bias in the IPCC’s communication pipeline—specifically from Technical Summary (TS) to Summary for Policymakers (SPM), and then to media. This isn’t a broad attack on climate science fundamentals but a focused critique of how information is framed, simplified, and escalated as it moves toward policy and public consumption.
A new study finds the IPCC Summary for Policymakers has systematically amplified climate science beyond what the underlying report actually says
A potentially very significant new preprint by Galiani et al. documents how the IPCC (Intergovernmental Panel on Climate Change) and the media introduce bias into assessment and reporting on climate change — A bias toward more extreme claims. The Honest Broker has the story.
The paper is a preprint and its data files are not yet available, so the findings should be considered preliminary.
Specifically, the paper claims that the IPCC Summary for Policymakers (SPM) is biased toward making claims more extreme than the underlying science represented elsewhere in the IPCC reports. This assertion has often been made by critics of the IPCC, but this is the first analysis that I am aware of that seeks to systematically evaluate the claim with data.
Today’s post shares my interpretation of the new analysis.
What Galiani et al. Did
Scientific findings of the IPCC — especially those projecting climate futures — can be thought of as the result of a linear process, shown in the figure below. The process begins with the selection and prioritization of scenarios to be used in projective climate research. Researchers then apply those scenarios in further modeling, ultimately publishing results in the peer reviewed literature.
Then the IPCC, which is organized into more or less independent chapter teams, assesses the published literature producing a chapter (which goes through multiple drafts and comment stages). The IPCC Chapters are the basis for the IPCC Technical Summary and Synthesis Report, which then feed into a Summary for Policymakers (SPM). The SPM is typically what drives media coverage and policy.2
The figure above also shows with the red dashed-line the focus of Galiani et al. which represents a subset of this communiation chain. The paper focuses on three dimensions of potential bias: severity shift, uncertainty compression, and scenario salience.
Severity shift measures whether emphasis is given to the more extreme end of a source document’s reported quantitative range. The paper scores severity shift on a five-point ordinal scale: −2, −1, 0, +1, +2. Percentages in aggregate results — such as +13% — are averages across many scored pairs. Table 1 illustrates each level with a sea level rise example.
Uncertainty compression measures whether summaries strip out the IPCC’s formal probabilistic vocabulary — such as, virtually certain (99–100%), very likely (>90%), likely (>66%).
Scenario salience measures selective citation of individual scenario results.
The range of outcomes for any variable across scenarios — such as 0.28 m to 1.01 m of sea level rise by 2100 in AR6, or 1.4°C to 4.4°C of warming — is not a probabilistic distribution of real-world outcomes. The exercise reveals a design flaw in the IPCC — while some specialists may understand that projected ranges across scenarios for any variable are neither forecasts nor a probabilistic range, most others will not.
What Galiani et al. Found
Galiani et al. scored ~114,000 matched claim pairs drawn from all six IPCC Assessment Reports (1990–2023) and 116,000 newspaper articles from ten major US and UK outlets, using three independent large language models — GPT-5-mini, Claude Haiku 4.5, and Gemini 2.5 Flash — to evaluate each pair on the three dimensions: severity shift, uncertainty compression, and scenario salience. The headline result is unambiguous: at every measured stage, in every Assessment Report, claims shift systematically toward the more severe end of the scientific ranges presented by the IPCC in its Technical Summary.
The dominant effect is severity shift — the tendency to emphasize the upper end of reported quantitative ranges while backgrounding or ignoring the lower end. At the TS-to-SPM stage, severity shift ranges from +4% to +13% of the maximum possible upward distortion under their unitless ordinal scale (across the six Assessment Reports, peaking in AR4 (2007). Media coverage adds a further +5% to +9% bias on top of what the SPM already contains.
Uncertainty compression — the stripping of calibrated IPCC confidence qualifiers — is a secondary but consistent effect. Scenario salience is the smallest channel, which the authors interpret as evidence the cascade does not depend on scenario cherry-picking. However, the analysis fails to recognize that the largest scenario bias effect is already baked into the severity shift.
The figure below from the paper shows that the “amplification cascade” is documented across all IPCC assessment cycles, with the most recent three assessments showing greater bias in the SPMs towards amplifying scientific claims than the first three IPCC assessments.
Three further findings stand out.
First, in the AR6 cycle, left-leaning and right-leaning media outlets show virtually identical amplification patterns, after a divergence over the three previous cycles.
Second, the media results are robust across five alternative sample restrictions including removing The Guardian (most amplification), removing the Wall Street Journal (most de-amplification), and equalizing outlet weights — none of which changes the direction or qualitative magnitude of the findings.Interestingly, the media outlet judged to have played things the most straight? Fox News!
Third, the pattern reproduces independently across all three LLMs, with Gemini scoring systematically lower than GPT and Claude but all three showing the same directional cascade.
The fact that the media has a bias toward amplifying climate science will come as a surprise to absolutely nobody. However, the finding that the IPCC SPMs also reflect that same bias is a very significant finding.
Why Galiani et al. Matters
Galiani et al. offer the first evidence that the IPCC process amplifies climate science in the direction of more extreme conclusions, beyond those reported in the Technical Summaries, and by extension, beyond that found in the peer revewed literature. Because Galiani et al. look at only a subset of the climate science communication chain, their results should be interpreted as just a floor of possible amplification bias.
As I’ve documented here at THB at length, the over-reliance on extreme climate scenarios in research and policy represents an enormous source of bias, beyond that documented in this new preprint.
I had been unconvinced of the climate change narrative since the earliest days. When the global warming circus opened for business in the 1980s, we were just coming off the back of the alarm over the hole in the ozone layer, so a second atmospheric emergency in the space of a few years seemed just a little too much of a coincidence.
I had been unconvinced of the climate change narrative since the earliest days. When the global warming circus opened for business in the 1980s, we were just coming off the back of the alarm over the hole in the ozone layer, so a second atmospheric emergency in the space of a few years seemed just a little too much of a coincidence.
However, it was only the advent of the internet that confirmed my suspicions that climate science had a problem. I still remember dialling up on a modem – in the wee small hours, when there was more bandwidth – to visit a site called Still Waiting for Greenhouse, where the first climate sceptics used to convene. One particular story that struck a chord with me concerned a scientific assessment of warming on Australia. Computer simulations had confirmed, or so it was said, that Australia would see a dramatic increase in rainfall. However, when sceptics pointed out that this would be an unalloyed good in such a dry country, new simulations quickly appeared, overturning the previously settled science and demonstrating, no doubt conclusively, that rainfall would disappear almost entirely. Now I felt for sure that there was a problem.
It’s hard to make an empirical case that the climate is deteriorating. Hydrologists have understood for thousands of years that weather patterns change constantly. Indeed, we now know that they exhibit trends on all timescales, from hours, to years, decades, centuries, millennia and beyond. That being the case, the few decades of warming seen recently don’t look anything out of the ordinary, and other ways of frightening the populace must be found.
One of the earliest ideas market-tested by the alarmists was to try to convince the public that mankind was definitely affecting the climate – a case of ‘never mind that the weather changes naturally all the time, now humans are changing it’. In 1995, when the Intergovernmental Panel on Climate Change (IPCC) issued its second assessment of the world’s climate, it claimed that it had detected “discernible human influence on global climate“, in the shape of a strong warming of the atmosphere high above the tropics. So thrilled was the media with this ‘fingerprint’ of mankind’s guilt that even the subsequent revelation that the finding fell apart if the old data used were brought up to date did nothing to dim that enthusiasm. Sceptics, on the other hand, now knew that something was badly wrong.
Buoyed by their success with the ‘fingerprint in the sky’, the IPCC’s Third Assessment went further, trying to convince the public that the world was hotter than it had ever been before, or at least that it was hotter than the Medieval Warm Period, a staple of sceptic objections to the global warming narrative. Climate science’s poster child to do this was the Hockey Stick graph, a now infamous scientific concoction representing Northern Hemisphere temperatures for the last 800 years. For most of that period, there had apparently been a steady cooling, but then, at the dawn of the 20th century, there was a sudden switch to warming, with unprecedented levels reached by the 1980s.
The IPCC clearly saw the graph as a weapon, placing it front and centre in the Third Assessment Report and in the press conference that launched it. It went on to become an icon of the global warming movement – apparently incontrovertible evidence that mankind was wrecking the planet.
But if the rise of the Hockey Stick was spectacular, the fall from grace of the graph itself and of the scientist behind it, one Professor Michael Mann, was just as extraordinary. The tale has been told elsewhere, but for our purposes suffice it to say that through years of doggedly determined research, two Canadians – retired mining engineer Steve McIntyre and economist Ross McKitrick – revealed that the hockey stick shape of the final graph was a function of data that was entirely spurious – comically so – and an invalid statistical analysis.
But more important than the fact of shattering of the IPCC’s icon was the reaction of the scientific community – not just those directly involved in climatic research, but those who might have brought relevant expertise from other fields, and also those working in scientific publishing and institutions. Nobody but nobody, it seemed, dared to criticise the Hockey Stick or indeed to accept that it was flawed. Indeed, the reaction was exactly the opposite – to circle the wagons and to insist that the graph was valid, and that McIntyre and McKitrick had nefarious motivations. This was no easy task. So daft were the data behind Mann’s results and so catastrophic his calculations, the scientific establishment was reduced to making the ludicrous argument that despite these obvious failings, he had still reached the correct answer.
The failure of scientists to speak out about the Hockey Stick would have appeared strange to many, but not to those familiar with the ways of climate scientists. It had long been clear that anything other than total support for the narrative of catastrophic global warming was considered taboo in scientific circles. Just how little deviation from orthodoxy was considered acceptable, and just how strong a grip the climate mafia’s omertà had on those making a living in the field became clear in a 2008 statement by Joanne Simpson, a pioneer of the field, issued shortly after her retirement:
Since I am no longer affiliated with any organisation nor receiving any funding, I can speak quite frankly. … The main basis of the claim that man’s release of greenhouse gases is the cause of the warming is based almost entirely upon climate models.
That she had been too scared to say something so mild while working for the US government speaks volumes.
Another scientist, Roger Pielke Jr., who was committed to the idea of manmade climate change but who had the temerity to point out that there was no sign of it in the data on hurricanes, found himself moved from the large comfortable office he had previously enjoyed into a windowless cupboard, And then, when he failed to take the hint, found even that filled with a growing pile of junk-filled boxes. As the eminent hydrologist Demetris Koutsoyiannis explained, “diversity in scientific opinion is now strictly prohibited”, or, as another wag put it: “The opposite of diversity is university.”
Any lingering doubts that climate science was utterly corrupt should have been put to bed by then, and if they hadn’t, events at the end of 2009 would have sealed the deal. On the eve of the Green Blob’s annual climate conference, thousands of emails between some of the world’s most prominent climatologists, including the team behind the Hockey Stick, were leaked onto the internet. Climategate, as the affair was dubbed, revealed the depths to which the field had sunk: nobbling of journals, silencing of critics, fixing data to give desired answers – it went on and on. In one extraordinary email, it was suggested that everyone in climate science knew the Hockey Stick was baloney. In another, a climatologist asked “What if climate change appears to be just mainly a multidecadal natural fluctuation? They’ll kill us probably.” These were extraordinary revelations at a time when the world was being told that Mann’s work had received a clean bill of health and that the science of climate change was ‘settled’.
The world was scandalised; so much so that, for a few short months at least, sceptic voices were occasionally heard in the media. But then the scientific and bureaucratic establishments closed ranks and a systematic coverup began. No fewer than six inquiries were set up, on both sides of the Atlantic, and by dint of careful selection of panel members (no known sceptics), tight control over what was examined (nothing that had been criticised) and an absolute refusal to take evidence from those, like Mcintyre and McKitrick, who had been the chief critics of the Hockey Stick, all managed to reach roughly the same conclusion – ‘Nothing to see here, move along’.
The idea of manmade global warming may have started as real science, but the field was quickly overwhelmed by other forces. Scientists saw the arguments for climate catastrophe as delivering funding beyond their wildest dreams. Politicians saw it as a way to manipulate electorates and deliver power and wealth, as the rags to riches story of Al Gore makes clear. Their chief weapon in this regard was a fearful narrative of climate disaster, but as it was deployed more frequently and the predictions became more frightening, its progenitor lost control. It took on a life of its own, becoming in essence the foundation of a secular religion – a cult, in other words – complete with ‘holy’ texts, red-robed Extinction Rebellion priests and a girl prophetess in the shape of Greta Thunberg.
It’s hard to express how dangerous this is for our society. Cult members respond to primeval emotions, their thought processes bypassing the rational mind entirely. Driven by fear of cataclysm and in pursuit of redemption, they can and will inflict astonishing cruelty on others. Think the Spanish Inquisition, think Mao, Pol Pot and the Nazis.
Cults can and will corrupt institutions, civic, political, legal and scientific. My friend Professor Michael Kelly has tried for many years to get the Royal Society and the Royal Academy of Engineering – he is a fellow of both – to hold meetings on climate science and Net Zero that challenge the current ‘consensus’, but has been blanked at every step. These bodies, along with all the other scientific institutions, now seek to further the interests of the cult rather than science.
The media have mostly been corrupted too. Most outlets have long since banned sceptics from their output. The BBC even convened a seminar of what it said were “leading scientists” to justify the policy, but were left looking corrupt when internet sleuths uncovered the names of those in attendance, almost all of whom were environmental activists. There is barely even a pretence of even-handedness in most of the media. I recently asked the magazine of the Institute of Civil Engineers if I could write an op-ed responding to a piece it had published criticising Kemi Badenoch’s new-found scepticism about the feasibility of Net Zero. The response was that the editors would be pleased to have an article discussing how Net Zero might be delivered more cheaply, but that they would not countenance anything that questioned the wisdom of the target. The legendary physicist Richard Feynman once said he’d rather have questions that couldn’t be answered than answers that couldn’t be questioned. I agree, and Net Zero is clearly an example of the latter.
The Civil Service is entirely in the grip of the climate cult too. I have spent years trying to get Whitehall to correct its preposterous statements about the cost of renewables. But despite the existence of hard data refuting their claims, both ministers and officials simply blank any such demand. It’s as if they think their feelings about the climate outweigh any concerns about data, facts and the truth.
If a cult is what we are facing, we need to understand the threat it represents. A historical example gives a flavour of what we might expect. In South Africa in 1856 the Xhosa tribe fell into the grip of a cult led by a charismatic girl called Nongqawuse: the Greta Thunberg of her day. She persuaded the elders that if they slaughtered the cattle herds that were the basis of the economy and burnt down the granaries, everything would be miraculously reincarnated: ‘new people’ would come with ‘new cattle’. Suffice it to say this didn’t end well. Closer to our time, the murderous excesses of communist and fascist societies can be seen as a manifestation of the same phenomenon. Ed Miliband’s idea, aired as I write, of installing small wind turbines across the country is painfully reminiscent of the backyard steel furnaces installed during China’s perversely misnamed ‘Great Leap Forward’, a bid to collectivise agriculture and industrialise society in the space of just a few short years, after a cult had formed around the country’s revolutionary leader Mao Tse-tung. Millions died before more rational actors gained the upper hand again.
For years, I couldn’t understand why society appeared to have lost its collective mind. Why were we throwing away our cheap and reliable energy sources in favour of windmills and solar panels? It was surely madness. But now I know: climate science and climate politics have become corrupt, and together have unleashed a cult, infecting society with irrationality and silencing everyone who tries to stand against it. The results are plain to see. As our economy sinks ever further into the mire, and as Mr Miliband pushes ever harder to make sure it sinks entirely, we should be very worried. But at least we know that, as and when the lights go out, we can point the finger at the climate scientists who started us down this road.
Andrew Montford is the Director of Net Zero Watch and author of The Hockey Stick Illusion, a history of the rise and fall of the infamous climate graph.
The climate system is a complex, chaotic, coupled system involving the atmosphere, oceans, land, ice, biosphere, and solar/astronomical influences. Human emissions of greenhouse gases (primarily CO₂, methane) exert a warming influence via the greenhouse effect, with water vapor providing the strongest positive feedback. This much is well-established basic physics. However, translating that into quantitative predictions of future climate—how much warming, where, when, with what impacts—reveals substantial uncertainty and complexity that are often downplayed in public and policy discourse.
The climate system is a complex, chaotic, coupled system involving the atmosphere, oceans, land, ice, biosphere, and solar/astronomical influences.
Human emissions of greenhouse gases (primarily CO₂, methane) exert a warming influence via the greenhouse effect, with water vapor providing the strongest positive feedback.
This much is well-established basic physics.
However, translating that into quantitative predictions of future climate—how much warming, where, when, with what impacts—reveals substantial uncertainty and complexity that are often downplayed in public and policy discourse.
Every so often it’s worth stepping back from the daily barrage of nonsensical doom laden headlines and taking stock of where things actually stand. Not where press releases say they stand, not where advocacy groups would prefer they stand—but where the underlying science, data, and institutions genuinely are. Climate science today sits in an unusual position: technically sophisticated, heavily funded, and politically elevated to a degree few scientific fields have ever experienced. That combination brings both uncertainty and, inevitably, complications.
Let’s begin with the science itself.
There’s no question that the observational network is better than it was decades ago. Satellite measurements, ocean buoys, reanalysis datasets—these have added layers of detail that early researchers could only dream about. But improved instrumentation hasn’t eliminated uncertainty; it has simply shifted where that uncertainty resides. Surface temperature records, for example, remain subject to adjustments, homogenization techniques, and ongoing revisions. Each of those steps may be justified individually, yet the cumulative effect introduces a level of opacity that deserves scrutiny rather than automatic trust.
Climate models, meanwhile, continue to serve as the backbone of long-term projections. They’ve grown more complex, incorporating atmospheric chemistry, ocean dynamics, and land-use changes with increasing granularity. But complexity is not the same as accuracy. Model ensembles still display a wide spread in climate sensitivity estimates, and their historical performance shows mixed skill depending on the metric chosen. Some runs track observations reasonably well; others overshoot warming trends, particularly in the tropical troposphere—a region that was once expected to provide a clear “fingerprint” of greenhouse forcing.
What’s often missing in public discussions is the distinction between hindcasting and forecasting. A model tuned to match past data does not necessarily demonstrate predictive skill. As one often-cited principle in statistics reminds us, fitting known data is relatively easy; predicting unseen data is where the real test lies. Yet much of the confidence conveyed to policymakers rests on scenarios that extend decades into the future, relying on assumptions about emissions, technological change, and socio-economic pathways that are themselves highly speculative.
Then there’s the matter of attribution. The claim that recent warming is primarily driven by human activity is widely repeated, but the degree of certainty attached to that claim varies depending on how it is framed. Detection and attribution studies use statistical techniques to separate human and natural influences, but those methods depend heavily on model output. When models disagree, attribution inherits that uncertainty. It’s a circularity that rarely gets acknowledged in simplified summaries.
None of this is to suggest that greenhouse gases have no effect on climate. Basic radiative physics has been understood for over a century. The question has always been one of magnitude, feedbacks, and the relative importance of natural variability. Solar influences, ocean oscillations, and cloud dynamics remain areas where understanding is incomplete. Clouds in particular—those ubiquitous, ever-changing features of the atmosphere—continue to represent one of the largest sources of uncertainty in climate sensitivity estimates.
Now, pivot to the political climate surrounding all this.
Climate science has become deeply intertwined with policy in a way that few other disciplines have. Funding priorities, institutional incentives, and public messaging are all shaped by the perceived urgency of the issue. Governments allocate billions toward mitigation strategies, international agreements hinge on model projections, and entire industries are being reshaped under the banner of decarbonization.
This creates a feedback loop. Scientific findings inform policy, but policy priorities also influence which scientific questions receive attention. Researchers are human; they respond to incentives like anyone else. When funding agencies emphasize certain outcomes—say, impacts, risks, and worst-case scenarios—it’s not surprising that those areas see the most activity. More mundane questions, such as refining baseline measurements or exploring natural variability, tend to attract less attention despite their importance.
Media coverage amplifies this dynamic. Nuance doesn’t travel well in headlines. A study suggesting modest uncertainty doesn’t generate clicks; a projection of dramatic change does. Over time, this skews public perception, giving the impression of greater consensus and precision than the underlying science necessarily supports. It also discourages open debate, as dissenting views are often framed as obstruction rather than part of the normal scientific process.
There’s also the international dimension. Climate policy has become a central feature of global diplomacy, with agreements like the Paris Accord setting targets that are as much political as they are scientific. Developing nations balance economic growth against emissions constraints, while developed countries grapple with the costs of transitioning energy systems. The result is a patchwork of commitments, many of which rely on optimistic assumptions about future technology and compliance.
One of the more curious aspects of the current landscape is the level of certainty expressed in policy discussions compared to the conditional language found in technical reports. Scientific papers are filled with caveats, confidence intervals, and carefully worded conclusions. By the time those findings are translated into policy recommendations, much of that caution has been stripped away. What remains is a simplified narrative that may be easier to communicate but less faithful to the underlying evidence.
So where does that leave us?
Climate science is neither settled in the simplistic sense often portrayed nor entirely adrift. It’s a field marked by genuine advances alongside persistent uncertainties. The challenge lies in maintaining a clear boundary between what is known, what is inferred, and what is projected. Blurring those distinctions may serve short-term policy goals, but it does little to enhance long-term understanding.
A more productive approach would emphasize transparency—open data, clear methodologies, and a willingness to revisit assumptions. It would also encourage a broader range of inquiry, including studies that test prevailing models against observations without presuming their correctness. Scientific progress has always depended on questioning established ideas, not reinforcing them through repetition.
As for the politics, they’re unlikely to become less intense anytime soon. The stakes—economic, environmental, and ideological—are simply too high. But recognizing the difference between scientific evidence and political narrative would be a good place to start. Without that distinction, it becomes difficult to tell whether decisions are being driven by data or by the desire to appear aligned with it.
In the end, the climate system will do what it does, indifferent to our models and policies. Our task is to understand it as accurately as possible, acknowledging both what we know and what we don’t. That requires a level of intellectual honesty that can sometimes be in short supply when science and politics become so tightly coupled.
Spend enough time watching the public discussion around climate, and a pattern emerges that has less to do with radiative physics and more to do with how people process information under uncertainty. The persistence of “climate doom” narratives isn’t mysterious—it follows recognizable psychological and social patterns.
Spend enough time watching the public discussion around climate, and a pattern emerges that has less to do with radiative physics and more to do with how people process information under uncertainty. The persistence of “climate doom” narratives isn’t mysterious—it follows recognizable psychological and social patterns.
Before digging into the details, here’s the short list of what drives it:
Humans are wired to prioritize alarming information over neutral data
Media coverage amplifies extreme events while downplaying context
“Consensus” messaging substitutes for deeper understanding
Scientific uncertainty gets compressed into false precision
Moral framing turns disagreement into a social risk
Worst-case scenarios are treated as baseline expectations
Keep those in mind—they show up repeatedly.
Start with a basic feature of cognition: humans are highly sensitive to perceived threats. Psychologists call this negativity bias, and it ensures that alarming language—“catastrophic,” “irreversible,” “tipping points”—carries more weight than measured descriptions of gradual change with uncertainty ranges. That bias interacts with the availability heuristic, where people judge reality based on what they can easily recall. If media coverage repeatedly highlights wildfires, hurricanes, or heatwaves and links them to climate change, those events become intuitive proof, even when long-term datasets show more complexity or variability. Vivid imagery tends to override statistical context.
Most people don’t engage directly with technical literature, so they rely on institutional signals. Phrases like “scientific consensus” act as shortcuts, conveying that the issue is settled and discouraging further scrutiny. While there is broad agreement on some fundamentals, that agreement often gets extended in the public mind to areas where uncertainty remains—such as climate sensitivity, feedback mechanisms, and long-term projections. The complexity of climate modeling adds to this disconnect. Models depend on assumptions about emissions, cloud dynamics, and ocean behavior, and the literature routinely acknowledges uncertainty: “Climate projections are subject to uncertainties arising from internal variability, model structure, and future emissions scenarios.” Yet in public communication, those uncertainties are frequently compressed into precise-sounding forecasts, where ranges become single numbers and scenarios are treated as expectations.
At the same time, climate has increasingly been framed in moral terms—“saving the planet,” “protecting future generations”—which shifts the discussion from technical analysis into ethical territory. Once that shift occurs, disagreement carries social consequences. Skepticism can be interpreted as irresponsibility, and nuance can be viewed as obstruction. Media ecosystems reinforce this dynamic by amplifying emotionally engaging content, often favoring the most dramatic interpretations. Over time, users encounter a narrower range of perspectives, creating a perception of unanimity and reinforcing confidence in more extreme conclusions.
Another important factor is the treatment of scenarios. In scientific work, a range of possibilities is explored, including worst-case outcomes. These are useful for testing models, but in public discourse they often become the default narrative. High-end emissions pathways or upper-bound sensitivity estimates are presented as likely futures rather than conditional ones, anchoring perception around extreme outcomes. There’s also a broader psychological appeal here—large-scale crisis narratives provide structure, clarity, and a sense of purpose in a complex world, making them particularly compelling.
None of this means there is no signal in the data. Temperatures have risen, and atmospheric CO₂ has increased. The complexity lies in interpretation: how sensitive the system is, how reliable long-term projections are, and how specific events should be attributed. Those questions remain open to varying degrees, even if public messaging often implies otherwise. Where this becomes consequential is in policy. Decisions based on high-confidence, worst-case framing can prioritize urgency over reliability, with real implications for energy systems, economic stability, and access to resources.
Skepticism plays a necessary role in keeping those assumptions in check. It involves testing models against observations, questioning inputs, and maintaining visibility of uncertainty. When that process is sidelined, the feedback loop that refines scientific understanding weakens.
Bottom Line
The persistence of climate doom narratives follows a predictable pattern:
Human cognition amplifies threats
Media systems favor dramatic framing
Social dynamics reinforce consensus signals
Scientific uncertainty gets compressed or omitted
By the time the message reaches the public, it reflects more than the data—it reflects the filters it passed through.
Understanding those filters doesn’t resolve every question in climate science. It does make it easier to see why the conversation so often leans toward certainty and urgency, even when the underlying evidence remains probabilistic and open to interpretation.
Clauser’s presentation at Heartland highlights legitimate questions about measurement precision, calibration practices, and the gap between raw observations and interpreted “proof” of crisis-level anthropogenic dominance. Science benefits from such scrutiny, especially on a metric as foundational as planetary energy balance.
The Heartland Institute’s 16th International Conference on Climate Change (ICCC16) took place April 8–9, 2026, in Washington, D.C. A recurring theme across sessions was “What Is The Proof?” — a data-focused challenge to core claims in the mainstream climate narrative, rather than policy debate.
On April 9, Nobel Prize-winning physicist John Clauser (2022 Physics Nobel for work on quantum entanglement) delivered a keynote that addressed extreme weather in the first part and devoted the bulk of his time to Earth’s Energy Imbalance (EEI) as purported “proof” of a human-driven crisis.
EEI is the net difference (at the top of the atmosphere, or TOA) between absorbed incoming solar radiation and outgoing longwave (infrared) radiation emitted to space.
A sustained positive EEI means the planet is gaining energy overall, which must show up as warming (mostly in oceans, ~90% of the excess).
Claimed recent EEI: ~0.7 W/m² (about 0.2% of the total flux), per IPCC AR6 and recent WMO reports. This tiny residual is cited as direct physical evidence of anthropogenic greenhouse-gas trapping, with recent increases linked to record ocean heat uptake.
Proponents see it as more robust than surface-temperature records because it sidesteps urban-heat-island effects, sparse station coverage, and averaging issues with intensive variables like temperature. IPCC AR6 shifted emphasis toward EEI partly for these reasons.
Clauser argued that claims of a significant, alarming EEI lack robust proof due to measurement challenges and data adjustments.
Clauser’s presentation at Heartland highlights legitimate questions about measurement precision, calibration practices, and the gap between raw observations and interpreted “proof” of crisis-level anthropogenic dominance.
Science benefits from such scrutiny, especially on a metric as foundational as planetary energy balance.
At the same time, the convergence of satellite, ocean, and surface data on net energy gain (however small in W/m² terms) represents a physical constraint that any complete climate explanation must address—natural variability alone has struggled to fully account for post-1950s trends without invoking greenhouse forcing.
The debate underscores the difference between detecting a signal and proving its magnitude, attribution, and future implications demand high evidentiary standards. Heartland events like this serve as a counterpoint to consensus-focused forums, emphasizing data examination over alarm.
In his April 9 address to the Heartland Climate Conference, physicist John Clauser devoted the first quarter of his time to the issue of extreme weather events, and the remainder to something called the Earth’s Energy Imbalance, or EEI. On April 10, I summarized the portion of the presentation relating to extreme weather events in my prior post here. Today I will discuss Clauser’s presentation on EEI.
Before hearing Clauser’s presentation, I had heard of the EEI metric, but I had not studied it in depth. Nor had I realized the extent to which the IPCC and the climate cabal have embraced this metric as providing the preferred proof of impending dangerous global warming.
The metric that has previously been most used as the supposed proof of dangerous atmospheric warming generally goes by the name Global Average Surface Temperature, or GAST. Multiple entities put out non-identical versions of GAST. The big three entities that report GAST data are NOAA and NASA in the U.S., and the Hadley Center in the UK. To calculate some version of GAST, these organizations identify a collection of surface thermometer monitoring stations around the world, and obtain the readings from each of those stations on a daily basis. Typically, they average the high and low temperatures at each station to obtain a daily average for that station, and then average all the daily averages to obtain a monthly average for each station. Then they average the monthly averages for all the stations to obtain a world-wide average for each month. The number is typically reported not as an absolute temperature, but rather as an “anomaly,” that is, a deviation from some baseline. Each of the reporting entities has a different collection of stations and a different method for calculating the baseline.
The GAST methodology is how NASA and NOAA create their monthly charts showing a sharply rising world temperature trend. This is the methodology used by Mann, et al., to create the rapidly-rising “blade” of their famous Hockey Stick graph. And it is one of the three “lines of evidence” by which EPA claimed to find CO2 and other “greenhouse gases” to be a “danger to human health and welfare” in the 2009 Endangerment Finding (recently rescinded by the Trump administration).
But do the GAST graphs really prove that some kind of “average” temperature of the earth is rising, let alone that it will continue to rise in the future? There are big problems with using GAST as a measure of global average temperature, many of which Clauser pointed out:
Temperature is what is called an “intensive” parameter, not legitimately addable, and therefore not subject to averaging.
Many of the ground thermometers in the GAST networks are near buildings, parking lots, airports and the like, that can bias their readings with “urban heat island” effects.
Many sites in the GAST networks have been abandoned over the years, leading to efforts to in-fill missing data by algorithms.
There are not nearly enough thermometers in the GAST networks to constitute a sufficient sample for statistical purposes.
Vast areas of the world have no or almost no data for large portions of the record, e.g., Southern Hemisphere oceans, and again data have been created (rather than measured) and in-filled by algorithms.
The methods for determining the baselines for the “anomalies” are poorly defined and inconsistent among reporting entities..
The deficiencies in the GAST data, and particularly the in-filling (fabrication) of missing data, were a main basis for the Petition for Reconsideration of the Endangerment Finding that I pursued with colleagues during the Trump 45 and Biden administrations.
Clauser described a process by which the IPCC has gradually moved away from relying on GAST as its proof of global warming. The change occurred between IPCC’s Fifth Assessment Report (2013) and its Sixth Assessment Report (2021). From Clauser’s slides:
The IPCC’s Fifth Assessment Report AR5 (2013) reports include a graph versus time of “temperature anomaly”. The IPCC’s Sixth Assessment Report AR6 (2021) now relies on values for the Earth’s Energy Imbalance (EEI).
The [WMO] Report confirms that the Earth’s energy imbalance – the gap between heat absorbed and heat released – is the highest on record. In other words, our planet is trapping heat faster than it can shed it.
Granted, the EEI metric, if it can be observed with sufficient accuracy, offers tremendous advantages over GAST as an indicator of global warming (if that is in fact occurring). It avoids the problem of averaging non-averageable data; it avoids the expense of thousands of stations (and ocean-based buoys) around the world; it avoids problems of station continuity, instrument changes, and location changes. Theoretically, it could just be measured by some satellites. And, if satellite measurements can show heat building up in the atmosphere, that can provide a basis for prediction of ongoing warming.
It seemed like such a great idea. Unfortunately, Clauser shows in great detail why the whole project has been a bust. Satellites got launched at substantial expense, originally in 1985. A second generation, known as the Terra and Aqua satellites, went up in 1999 and 2002. Unfortunately, the satellites have proven to have insufficient accuracy and gaps in their measurement abilities that make it impossible to determine if there is any “energy imbalance” at all, and if so, how much.
The basic problem is that the amounts of energy coming in from the sun, and then departing back into space, are large; but the difference (if any) between the two, representing a possible build-up of energy in the atmosphere or oceans, is small. The IPCC gives a figure of the incoming radiation from the sun of 340 watts/square meter. The claimed EEI is 0.7 watts/square meter, which is only about 0.2% of the overall energy flux. This figure, appearing on Clauser’s Slide 27, is from the IPCC’s Sixth Assessment Report:
The numbers across the top show the incoming radiation from the sun of 340 w/sq.m. and outgoing of 100 w/sq.m. of short wave reflected solar radiation and 239 w/sq.m. of infrared radiation. The total of those two is 339. If you look in the lower left hand corner, you will see a figure of 0.7 w/sq.m. as the “imbalance.” That’s not exactly the difference between 340 and 339, but apparently they think it’s OK to do some random rounding of some figures but not others.
From Clauser’s Slide 34:
[P]ower-IN and power-OUT are both huge numbers, and . . . the difference between them is minuscule – about 0.2% of power-IN. That minuscule difference is the net imbalance that is sought, both experimentally and theoretically. A second difficulty occurs when power-IN and power-OUT are both hugely varying, both in time and in space, in a seemingly random and totally irreproducible fashion. Measurement and calculation errors (including round-off errors) of any of the three large component powers readily swamp the resulting error of the very small power difference. Extreme absolute measurement accuracy is thus required.
But do the satellites actually have the ability to measure the incoming and outgoing radiation at the top of the atmosphere (TOA) with sufficient accuracy to be confident that this small 0.7 w/sq.m. difference is real? Clauser has multiple quotes from the literature admitting that the measurement accuracy is not nearly adequate. Here are two quotes from Clauser Slide 33:
Loeb et al. (2012, p.111) admit, ”… A limitation of the satellite data is their inability to provide an absolute measure of the net TOA radiation imbalance to the required accuracy level. … .” Stephens et al. (2012) admit “… The combined uncertainty on the net TOA flux determined from CERES is ± 4 W/m2 (95% confidence) due largely to instrument calibration errors. …”
If your margin of error is +/- 4 w/sq.m. and you have measured an “imbalance” of 0.7 w/sq.m., then obviously that imbalance is not significantly different from zero. Honest scientists would admit that. Unfortunately, that is not the way of climate “science.”
Clauser’s slides go into great detail on the nature of the problem. Apparently, the portion of the outgoing radiation that constitutes reflected solar radiation gets widely scattered and comes from many random directions; and the satellite instrumentation is not sufficient to capture all of it. From Clauser Slide 37:
The field-of-view [of the satellite instruments] is not at all panoramic. As a result, scattered and/or reflected [outgoing] energy that arrived from angular directions from above and below the narrow angular acceptance ribbon [is] missed. . . . The result was a too-low reported [figure for outgoing reflected solar energy], and a corresponding very-much too-high reported EEI value (6.5 W/m2).
So the actual measured EEI from the satellites was 6.5 w/sq.m., but everyone recognized that that figure was impossible and would imply much more warming than observed. How to deal with the problem? Clauser quotes a 2011 paper from the famous James Hansen of NASA:
Because this result is implausible, instrumentation calibration factors were introduced to reduce the imbalance to the imbalance suggested by climate models, 0.85 W/m2 (Loeb et al. 2009). …
When the data are clearly wrong, you just use your favorite model to modify the data until they fit your preferred theory. And with that I’m only up to Slide 39 of Clauser’s 124 slides.
The story goes on and on from there. The climate “science” community was not willing to admit that they had no means to measure EEI to prove a build up of heat in the atmosphere and oceans. Hansen and others proposed using separately-measured changes in Ocean Heat Content (OHC) to fill the gaps in the satellite data, and extensive efforts have been made to do that. But the OHC metrics are filled with their own measurement problems, many of them comparable to the problems of measuring average atmospheric temperature via GAST: the measurement is done by buoys in the ocean, rather than satellites at TOA; there are not nearly enough buoys; they do not measure heat at TOA, and thus are not comparable to the satellite energy flux measurements; the buoys sink down and rise back up, but their location is only known when they surface; the process of converting temperature measurements to heat content is dubious; there is no coverage at all of the polar regions; and so on and on.
Clauser goes into great detail about how some combination of badly flawed satellite data and badly flawed OHC data get reverse-engineered to back into a pre-determined figure of about 0.7 or 0.8 w/sq.m. as the EEI. He includes several accusations of scientific misconduct, and uses the word “fraud” liberally.
But the gist is, the accuracy of the measurements is not sufficient to claim an EEI that is meaningfully different from zero.
With regard to EEI, the answer to the question “What Is The Proof?” is that there is no proof.
Lies, disinformation and fictional accounting are the order of the day as a desperate hard-Left UK government, aided by its pet Climate Change Committee, tries to keep its impossible Net Zero controlling agenda intact. The bedrock unproven science claims surround the suggestion that recent limited global warming presents an existential threat to the planet.
Lies, disinformation and fictional accounting are the order of the day as a desperate hard-Left UK government, aided by its pet Climate Change Committee, tries to keep its impossible Net Zero controlling agenda intact. The bedrock unproven science claims surround the suggestion that recent limited global warming presents an existential threat to the planet. Statistics are routinely tortured to produce claims of up to 1.7°C warming from the pre-industrial age, notable as reported in a recent silly ‘Trump’s brave new world’ article by Ambrose Evans-Pritchard in the Telegraph. In fact, temperatures have only risen by around 1.1°C over the last 100 years. Moving away from the tortured stats measured over a few cherry-picked months, it has recently been discovered from ice core records that rises of 1.1°C in the current interglacial, which started about 20,000 years ago, occurred in about one in six centuries.
Moreover, similar, although less frequent, temperature rises appear in earlier periods going back 150,000 years. The frequency here was around one in six to one in 20 centuries. Of further interest was the discovery that these routine rises became rarer before this date. None of these findings suggest that current warming is either unusual or solely caused by humans burning hydrocarbons. Needless to say, the findings will be ignored – as is most other inconvenient palaeo evidence – by climate headbangers and political activists prepared to fib about the climate and waste trillions of pounds on their command-and-control Net Zero fantasy.
Not yet in the rapidly pauperising UK, but in many others parts of the world, Net Zero is dead or entering its death throes. In addition, the 30-year ‘emergency’ around ‘settled’ climate science, with its political orders not to question scientific opinions, is being seen for the scam it is. Even in the UK, long gone are the days when this piffle from BBC presenter Jeremy Vine could be tweeted, seemingly with a straight face.
Attenborough and Thunberg talking to each other for the first time (on @BBCr4today, right now) is surely the radio moment of the decade, just as it closes. Well done @BBC@MishalHusain— Jeremy Vine | Here, on Tiktok, Insta & Facebook (@theJeremyVine) December 30, 2019
In so many ways, this ludicrous tweet sums up the dumbing down of education over decades. This allowed climate psychosis to take general hold, with a school-skipping doom goblin child meeting a famous TV voice over-artist to the accompaniment of chirping praise from another UK State broadcasting presenter.
Climate models, which are ultimately responsible for all the Attenborough/Thunberg et al ‘tipping point’ nonsense that drives the mainstream settled narrative, are almost invariably wrong in their conclusions. Decades of failed predictions confirm the fact that they cannot realistically model a chaotic climate. Knowledge of the role of clouds, the Sun and even ocean and air currents is too basic to be effectively modelled. Using these models should come with a warning that any human involvement in changes in the climate cannot be distinguished from natural variation. Computer-generated claims to be able to attribute individual weather events to human involvement should be supplied with a picture of the late Tommy ‘Just Like That’ Cooper, a great comedic conjuror famous for wearing a Fez and waving a magic wand.
Tommy ‘Just Like That’ Cooper
It is natural variation that the headbangers try to ignore. Only then can they demonise recent gentle global warming and spin the lie that collectivist action can stop the weather. This is why this latest temperature paper is important, and why it will be ignored in the mainstream. It would be impossible to impose a Marxist wet dream costing trillions of pounds and involving horrendous lifestyle changes if it became generally known that the recent rise in temperature was common throughout the last 200,000 years.
Written by the Emeritus Professor of Computer Science at Kingston University Les Hatton, the paper analyses publicly-available temperature information going back around 420,000 years from the Epica-Vostok Antarctica ice core dataset. It accepts that the data do not provide a global figure, which it is noted is a statistical amalgam with many assumptions and numerous proxies. The more cynical might note here that current global temperature datasets contain a great deal of ‘junk’ unnatural heat measurements, and are subject to considerable suspicious retrospective adjustments. The author notes that the Vostok ice core is a ”pure” record since it is based on a single location in a consistent manner over a long period. Again, sceptics might welcome the lack of measurements next to airport runways, solar farms and glass-clad high-rise buildings.
Professor Hatton has some interesting general comments about temperature, noting that interglacial peaks starting 400,000 years ago appear to be getting hotter. The interglacials are followed by ice ages and these seem to be getting colder. Carbon dioxide levels do not seem to play a large part in all this natural variation as the graph below going back 200,000 years clearly shows. In some periods, the red temperature line moves in a different direction to the blue CO2 marker.
Carbon dioxide levels in this dataset vary between 170 parts per million (ppm) and 280 ppm. If the level had fallen below 150 ppm, photosynthesis would have stopped and an almost certain mass extinction of land-based life would have occurred. Hatton observes that in 556 centuries of the 800,000-year Vostok database, CO2 was below 190 ppm.
Whatever the cause of the recent upturn in CO2, which has ‘greened’ the planet by up to 20% in the last 50 years, we seem to have dodged a very dangerous extinction bullet.
Chris Morrison is the Daily Sceptic’s Environment Editor. Follow him on X.
TIME Magazine recently posted an article titled “New Study Finds Air Conditioners Will Exacerbate Climate Change As Planet Warms,” claiming that expanding air conditioner use will harm the planet by increasing warming, and that people should “transition” away from refrigerants and use less AC. This is nonsense. Even according to their own models, massive expansions in AC use would only result in marginal temperature change. By contrast, modern air conditioning has been demonstrated to save thousands of lives each year.
TIME Magazine recently posted an article titled “New Study Finds Air Conditioners Will Exacerbate Climate Change As Planet Warms,” claiming that expanding air conditioner use will harm the planet by increasing warming, and that people should “transition” away from refrigerants and use less AC. This is nonsense. Even according to their own models, massive expansions in AC use would only result in marginal temperature change. By contrast, modern air conditioning has been demonstrated to save thousands of lives each year.
The article references a study published in Nature Communications, written by scientists from the Beijing Institute of Technology, a Chinese Communist Party (CCP) founded and run university. Their study used “a combination of climate science, energy modelling, and inequality analysis to map out future scenarios ranging from strong climate action to high emissions.” Their results were that as air conditioning use expands, it will add more to greenhouse gas emissions and contribute an additional 0.015°C to 0.05°C by 2050.
The study’s lead author warns that “if all low‑income regions gained the same access to air-conditioning as rich regions, related global emissions would jump dramatically—adding up to 0.05°C extra warming even in the most climate‑friendly scenario.”
The authors clarified that “air conditioning is not the solution to rising temperatures” while noting that “low-income countries cannot be left behind when it comes to keeping cool in a warming world.” The scientists recommend that people transition “away from traditional refrigerants,” as well as prioritize “decarbonizing power grids, and prioritizing other adaptive measures, like better insulation and shading. And people will need to learn to change their behaviors—avoiding using AC during peak hours, and turning the air conditioning down.“
One should be extremely skeptical when CCP-affiliated researchers promote studies that recommend other countries “decarbonize,” as China currently maintains a near total monopoly on green technology and is increasing its fossil fuel use. China is fond of telling other countries to decarbonize while also building up their own coal-powered infrastructure.
The scientists predict a sort of positive feedback loop of warming: warming causes expanded AC use, which causes more emissions, causing more warming, causing more AC use, on and on.
However, the study says that “income-driven AC growth adds 14–146 GtCO2eq and a further 0.003–0.05 °C of warming by 2050, even under SSP119.” SSP119 being a low-end emissions model scenario. But notice those numbers: 0.003-0.05 °C extra over the next 24 years, with a lot of assumptions loaded behind it. Those values are also average global temperature change. No one is going to feel that small of a change, and no weather dynamics are going to be impacted by that minor variance.
These are not new claims. The United Nations have been saying for years that AC use makes climate change worse, as every human activity apparently does. Our World in Data estimates that all world AC use contributes just 3 percent of total greenhouse gas emissions. Eliminating all AC use would have no noticeable impact on warming. For example, during the COVID-19 pandemic, global emissions dropped more than that in 2020, quite sharply, and it doesn’t even appear on the carbon dioxide measurement station data at Muana Loa. (See figure below)
Cutting AC will have even less impact.
There is no evidence that human emissions are causing any kind of dangerous runaway warming, nor that eliminating emissions from various economic sectors has had any impact on warming trends over the past few decades.
The paper recommends governments adopt dynamic pricing on electricity in wealthy countries in order to discourage people from running AC during peak hours of the day, which is an attack on consumer choice and safety. Since the researchers involved in the article are tied to the CCP, it is interesting to note that the government buildings they work in are fully air conditioned as are the homes and office of CCP leadership. In addition, the growth in China’s air conditioning use has been massive over the past decade. From 2010 to 2020, annual AC sales nearly doubled to 100 million units. By 2024, China’s stock of residential ACs continued to grow rapidly, doubling the per-household average over the previous decade, with cooling now estimated to account for 15 percent of electricity demand.
In China, air conditioning is common in urban areas and cities, but remains relatively rare in rural areas. Perhaps this article is an attempt to tamp down the hopes of rural Chinese, a suggestion that they forego adopting air conditioning for patriotic reasons to help the CCP fight climate change. If so, it is the height of hypocrisy on behalf of the CCP.
Studies published in the Journal of American Medical Association’s Internal Medicine and by the International Energy Agency (IEA) detail the fact that air conditioning saves tens of thousands of lives each year, and will serve an even greater role in preventing unnecessary premature deaths if the world continues warming in the future. During normal summer heat and even more so during periodic heatwaves in countries that naturally experience high temperatures, the adoption of widespread air conditioning use is rapidly becoming the most effective life saving measure.
“Lack of access to indoor cooling puts much of the global population at high risk for heat stress, adversely affecting thermal comfort, labour productivity, and human health,” says the IEA report. “[A]ccess to effective cooling has saved tens of thousands of lives . . . the average annual number of heat-related deaths averted by AC increase[d] 3-fold, reaching an estimated 190 000 lives saved per year during 2019-2021.”
Accordingly, any effort to limit the expansion of air conditioning use is logically going to lead to more sickness and probably death, especially in vulnerable populations like the elderly.
As mentioned in the introduction, misplaced fearmongering concerning the minuscule role of AC in climate change could lead to real world harms, if governments take these scientists seriously. Limiting air conditioning use will result in more people suffering from heat-related illness and discomfort. No one should listen to Beijing. China has a vested interest in promoting the so-called “green” technologies that it monopolizes, even as wealthy Chinese urban elites and government officials have air conditioning in their offices and homes. TIME should stand with the people in need of air conditioning and vet their reporting better, rather than becoming a shill for propaganda from the CCP.
“There is low confidence in past changes of maximum wind speeds and other measures of dynamical intensity of extratropical cyclones.”
AR6 assesses with medium confidence that future changes in overall ETC dynamical intensity (e.g., maximum wind speeds) “will be small”, though poleward shifts in storm tracks could lead to substantial regional changes in extreme wind speeds (increases in some areas, decreases in others).
The IPCC’s AR6 Working Group I Report, specifically Chapter 11 (“Weather and Climate Extreme Events in a Changing Climate”), provides a careful, consensus-based assessment of extratropical cyclones (ETCs), which include Nor’easters as a regional subset in the western North Atlantic.
AR6 explicitly states:
“There is low confidence in past changes of maximum wind speeds and other measures of dynamical intensity of extratropical cyclones.”
Large natural variability (e.g., influenced by modes like the North Atlantic Oscillation).
Inhomogeneities and limitations in historical data and reanalyses (e.g., fewer observations pre-satellite era).
Lack of robust, consistent trends across datasets for dynamical intensity metrics like maximum winds or central pressure deepening rates.
AR6 assesses with medium confidence that future changes in overall ETC dynamical intensity (e.g., maximum wind speeds) “will be small”, though poleward shifts in storm tracks could lead to substantial regional changes in extreme wind speeds (increases in some areas, decreases in others).
A case study in confidence inflation in climate science
UPDATE 2/25: After publishing this piece I was asked to write a related column for The Free Press. You can read my column here (apologies for any paywalls). If you are visiting THB for the first time from that column, Welcome! — RP
As New England digs out from a historic blizzard, today’s post takes a deep and technical dive into recent research — Chen et al. 20251 — claiming that Nor’easters have become detectably more intense over recent decades. That research asserts,
Our analysis of nor’easter characteristics reveals that the strongest nor’easters are becoming stronger . . .
Taking advantage of AI tools, I have replicated and extended the analysis. As is far too common in high profile climate research, the top-line claims of the paper do not survive scrutiny. Public commentary by the paper’s senior author and subsequent media reporting provide a case study in how uncertain and ambiguous findings are turned into strong claims expressed with absolute certainty.
Grab your coffee, settle in and let’s take a deep dive. Last July, a paper in PNAS by Chen and colleagues was accompanied by widespread media coverage claiming that the new paper was the first and last word on trends in the intensification of nor’easters. For example:
Live Sciencereported that nor’easters “have become 20% more destructive in the last 80 years.”
Inside Climate Newsdeclared that “the strongest ones are clearly getting stronger.”
The Weather Network, revisiting the study in December, announced that nor’easters are “growing more intense and producing more rain and snow than ever before.”
The University of Pennsylvania’s press release on the paper called its findings “unquestionable.”
Michael E. Mann, the paper’s senior author and a climate scientist at the University of Pennsylvania, in his accompanying blog post, stated that intensification “can now be seen in the observations.”
A closer reading of the paper shows that none of the above claims are a true reflection of what the paper actually says, supported by a simple extension of its methods and analysis.
Note: This post is a first experiment fully implementing my new use of AI for quantitative research – see How I use AI for more details. Today, I explore Chen et al., its supplementary materials, and the relevant ERA5 reanalysis literature. For readers interested in the quantitative details, please find more technical detail, data, and replication code for my analyses at the bottom of this post. Caveat lector!
Nor’easters are among the most consequential weather events affecting the densely populated U.S. East Coast, into New England and the Canadian maritime provinces. If the most intense storms have become detectibly more intense, and are expected to continue to do so, that has important implications for urban planning and decision making in other settings.
The bottom line: Chen et al. take on a worthwhile question but its headline claims, and those that followed publication, go meaningfully beyond what the data can currently support. Follow-on public discussion by its senior authors and in the media depart even further from what evidence and analysis can support. Worthwhile findings of uncertainty and ambiguity are transformed into unquestioned certainty in support of a narrative that everything is getting worse.
What Chen et al. did and what they found
Chen et al. use ERA5 — the European Centre for Medium-Range Weather Forecasts’ global reanalysis — to construct a historical record ofnor’eastersfrom 1940 to 2025. A nor’easter is a powerful, large-scale low-pressure storm system, called an extratropical cyclone (ETC), that forms along the east coast of North America, characterized by winds blowing from the northeast (giving such storms their common name), often accompanied by heavy rain or snow.
A reanalysis can be understood as a retrospective weather forecast: historical weather observations — from sources such as weather balloons, ships, land stations, and eventually satellites — are fed into a numerical weather model to reconstruct the historical state of the global atmosphere.
Ideally, the result is a consistent, gridded dataset of weather variables covering the entire planet, filling in gaps where direct observations were never made. ERA5 is the most widely used reanalysis in climate research. As we will see, going back further in time, reanalysis quality is far from uniform, and the creators of such datasets warn about its use for long-term trend analyses.
Using the ERA5 reanalysis, Chen et al. identify 900 storms from 1940 to 20242 that meet their criteria for an ETC. With this time series they apply a statistical technique called quantile regression to explore whether the intensity of the strongest ETCs has changed over time.
Quantile regression allows for a focus on extremes rather than just averages, enabling quantification of whether, for instance, the intensity of the top 10%, top 5%, or top 1% of storms have detectably changed over time.
Chen et al. report that from 1940–2025 record, the peak wind speeds of the most intense nor’easters — those in the top 1% (that is, about 9 storms) — increased by approximately 6%, from ~31 m/s (~69 mph) at the start of the record to ~33 m/s (~74 mph) by its end. The trend for the top quarter of storms (75th percentile and above) is similar in magnitude.
The authors then apply a damage-scaling relationship to translate this wind speed increase into a headline impact figure: asserting that economic loss potential is proportional to the cube of wind speed. They assert that a 6% increase in peak winds implies a ~20% increase in destructive power (see Pielke 2007 for a discussion of the sensitivity of damage estimates to assumptions about wind-damage scaling exponents).
The math is straightforward. Whether the underlying 6% increase in peak wind speed trend is real and “unquestionable,” however, does not stand up to scrutiny.
The paper also includes a very useful supplementary analysis: It includes a test of whether the results of 1940-2024 hold up when restricted to the era when data from satellites was systematically available (1979–2024). The satellite era is the period when global weather observations, and thus global reanalysis, became far more comprehensive and reliable, as described in a recent overview — The ERA5 global reanalysis from 1940 to 2022.
The supplementary analysis to Chen et al. includes information that dramatically undercuts the headline findings that were picked up and amplified by the media.
What the PNAS Supplementary Analysis to Chen et al. actually shows
A close look at the supplementary analysis reveals results that depart from the paper’s headline results.
Specifically, the satellite-era analysis (1979-2024) does show nominally significant trends — but they are concentrated in the 60th to 78th percentile range of storm intensity, not at the extreme tail, as claimed in the main body of the text.
For the very strongest storms (95th and 99th percentiles) that Mann’s post-publication blog post emphasizes, the satellite-era statistical significance does not reach conventional thresholds of significance. That means that the paper’s headline — the strongest storms getting stronger — is least well supported in the most trustworthy portion of the dataset of the satellite observational era.
In the paper, the authors emphasize a sensitivity analysis that starts their analysis in 1950 rather than 1940 — trimming just a single decade from the pre-satellite period. But even in this alternative analysis, statistical significance almost completely disappears across the distribution, as you can see in the image below.
Disappearing significance. Top panel, From Figure 4 in main text. Bottom panel, From figure S3 in SI. Annotations added by me.
The sensitivity analysis clearly indicates that one decade of early, sparse data is doing an enormous amount of work in generating the headline result. This inconvenient information is reported in the supplementary material but not discussed in the paper, in the university press release, or the senior author’s blog post on the paper. But that is just the start of problems with the headline results
The number and quality of those observations has changed dramatically over time. For instance, in 1940, ERA5 was working with roughly 17,000 global observations per day, almost entirely from land stations and ships, with virtually no coverage over the open ocean. By 2022, that number had grown to 25 million observations per day, with global satellite coverage providing near-complete atmospheric profiles worldwide. The preliminary back-extension to 1950 was released with explicit caveats about uncertainties and cautions about its use in research.
Logically, any reanalysis that is data-sparse over the ocean over the 1940s to 70s and data-rich from 1979 onward will tend to show apparent improvement in storm intensity over time, partly reflecting improved data coverage rather than real changes in storm behavior.
Chen et al. does not engage with any of this literature.
To put these uncertainties in concrete terms: The paper’s headline finding is a ~6% increase in peak wind speeds over 85 years, corresponding to a trend of roughly 0.2 m/s per decade at the 99th percentile. ERA5’s known negative bias for extreme extratropical cyclone winds is ~10% — and that bias is not constant over time.
Again logically, because ERA5 is data-sparse over the western Atlantic in the early decades and data-rich after 1979, the reanalysis almost certainly underestimates early-record wind speeds more severely than late-record ones. That means that any improvement in observational coverage from 1940 to 2025 could generate a spurious apparent trend of comparable magnitude to the claimed signal detected in Chen et al..
This does not mean the asserted trend detected by Chen et al. is necessarily an artifact of observational system and coverage changes. But it does mean the reanalysis data cannot currently be used to distinguish a real trend from a measurement artifact. That itself is an important and worthwhile finding, even if not ready made for climate headlines.
That brings us to the importance of rigorous standards for detection and attribution, as established by the Intergovernmental Panel on Climate Change (IPCC).
Chen et al. in context of the IPCC framework for detection and attribution
Whether ETCs have increased in intensity on climate timescales is ultimately a detection and attribution question: Has a change in the statistics of ETCs been detected in nor’easter intensity? If so, then we next ask about attribution: Can a detected change be attributed to human or natural factors, or perhaps both?
Achieving detection and/or attribution requires a robust evidence base, including: multiple independent datasets, multiple methods, often reinforced by earth system model simulations that can reproduce the observed change through known mechanisms.
Let’s review what AR6 actually says about extratropical cyclones. On past changes, AR6 Chapter 11 is explicit:
“There is low confidence in past changes of maximum wind speeds and other measures of dynamical intensity of extratropical cyclones.”
For projections, AR6 is carefully hedged, stating with medium confidence that for future changes in overall ETC intensity, “in the future, these changes will be small,” but their location and tracks may also change, along with other nuances.
The AR6 also evaluates time-of-emergence for ETC wind extremes. Time of emergence is the point at which a change in a particular weather or climate variable over decades or longer becomes large enough relative to climate variability to be robustly detectable in observations.
For extratropical cyclone wind speeds, AR6 concludes that this threshold has not yet been crossed, and does not expect it to be crossed any time soon (the strongest claim the IPCC makes is with medium confidence, i.e., 50-50 or “as likely as not”) even under the most extreme and implausible climate scenario available for projections.
In plain language: even if ETCs are becoming more intense, the IPCC AR6 concludes the noise of natural variability will obscure that signal throughout this century. Logically, that means that the IPCC expects any such signal to be small in the context of variability, and not detectible in 2026.
To complete this discussion, I’ll review what would be needed for a robust detection claim:
The detected signal must be distinguishable from internal variability. The satellite-era trend in ETC intensity is small relative to year-to-year variability, even over that 46-year period — Hence the low statistical significance.3 Large-scale climate modes operating on decadal timescales — such as the North Atlantic Oscillation, Atlantic Multidecadal Oscillation, and Pacific Decadal Oscillation — produce changes in extratropical storm activity that are distinct from long-term forcing. The 46-year satellite record is short compared to these modes, making it difficult to distinguish a forced trend from internal variability.
Any detected signal must be robust across methods and datasets. Chen et al.’s supplementary material shows that the result is sensitive to start date (e.g., near-null from 1950, as shown above), to statistical method (e.g., the sensitivity analysis in the Chen et al. supplementary material indicates that Mann-Kendall significance concentrates in the 62nd–85th percentile, not the extreme tail), and to storm radius choice.4 The paper uses no independent reanalysis — JRA-55, MERRA-2, or the 20th Century Reanalysis — to assess the robustness of the findings, which are based solely on ERA5.
For attribution claims, any detected signal must be consistent with model-based attribution. The paper offers a hypothesized physical mechanism for intensifying nor’easters (warming Atlantic sea surface temperatures feeding nor’easter intensification) but provides no model-based attribution analysis. The data presented and statistical analysis are not suggestive that any such attribution analysis is even appropriate. Attribution claims of Chen et al. are entirely speculative.
Taken together, these factors would, in my view, lead to a low confidence finding by IPCC standards. That is very different from “our study demonstrates that this [trend in intensity] can now be seen in the observations.”
From Research to Spin
Chen et al. does not discuss that the results are sensitive to start-date choice, that the satellite-era robustness check concentrates significance in the middle of the distribution rather than the extreme tail, or that the analysis leaves natural decadal variability and ERA5’s temporal inhomogeneities unaddressed.
Following publication, Mann presents the marginal (at best) findings as a demonstration of established fact, invokes a wind-speed-cubed adjustment to the small findings to generate impressive-sounding numbers related to real-world damage, and omits the contradictory evidence included in the paper’s supplementary material.
Other than that, how was the play Mrs. Lincoln?
The over-hyping of results and shedding of uncertainty and complexity is a pattern we often see in high-profile climate research and chronicled in detail over the years here at THB. Loose standards of scientific quality may help to generate breathless headlines but does not serve improved scientific understandings or public confidence in climate science.
Postscript: Methods and Replication Files
For readers who want to go deeper, below is the technical summary underlying the discussion above. My analysis draws on the paper’s published figures, the supplementary material, and independent analysis of the ERA5 validation literature. I use Claude for the data extraction and coding. An Excel file with data and Python file with code can be found below.
Table 1: Trend slopes and nominal p-values by analysis window
The table below shows the estimated trend in nor’easter peak wind speed (in meters per second per decade) at five points in the intensity distribution (quantiles), across five different choices of analysis start date. Results marked [SI] come directly from the authors’ own supplementary figures; results marked [est] are estimated by scaling statistical power from the full-record result and are less reliable.
Table 2: Effective p-values after accounting for ERA5 systematic bias (at the 95th percentile)
Nominal p-values assume the data are unbiased. ERA5’s improving observational coverage over time introduces a systematic bias that can masquerade as a real trend — particularly in the pre-satellite period. The table below adjusts for this, drawing on published ERA5 validation studies (Soci et al. 2024; Bell et al. 2021; Lodise et al. 2024).
A note on methods
The trend slopes in Table 1 were derived by digitizing the quantile regression trend lines from the paper’s Figure 4A and fitting linear regressions to subsets of each line corresponding to the analysis windows shown. The p-value estimates for windows not directly reported by the authors were scaled from the published full-record p-values using the ratio of statistical power (which scales with the square root of n(n²−1)/12 for rank-based tests). The ERA5 systematic bias ranges in Table 2 are conservative estimates based on the published validation literature cited above; they represent plausible bounds rather than precise measurements. The satellite-era and 1950-start p-values in Table 1 are taken directly from the authors’ supplementary Figures S2 and S3 respectively and do not rely on scaling.
Further Research and Publication Invitation
I do not intend to carry this analysis forward to peer-reviewed publication, though I do think it is well on its way in that direction. If any atmospheric scientist (at any level) is interested in carrying this analysis forward, I invite you to do so. I ask only that (a) you let me know, and (b) as research ethics require, you include me as a co-author — no ghost authorship here.
The authors, all from the University of Pennsylvania, are: Kevin Chen, Xueke Li, Mackenzie M. Weaver, Shannon A. Christiansen, Annabelle L. Horton, and Michael E. Mann.
The paper claims throughout that its data spans 2025. This is obviously an error or typo as the data presented go through 2024 (and the paper was submitted in April 2025, obviously well before 2025 data would have been available). This post accurately describes the time period covered in the analysis.
Technical point, which is largely irrelevant given the other issues: Chen et al. do not correct for serial autocorrelation in the storm record, which would reduce the effective sample size and push p-values upward. A more sophisticated analyses would consider such details.
The primary analysis of Chen et al. uses a 750-km effective radius to define the wind field around each storm, and the supplementary material also explores results at 500 km and 1,000 km. The authors acknowledge that results “vary somewhat” with this alternative methodological choice, but do not discuss the details of the considerable variations. The paper’s abstract and Mann’s blog post also make strong claims about precipitation trends, but these receive far less analytical scrutiny than the wind speed results and are not the focus of thr paper or this post.


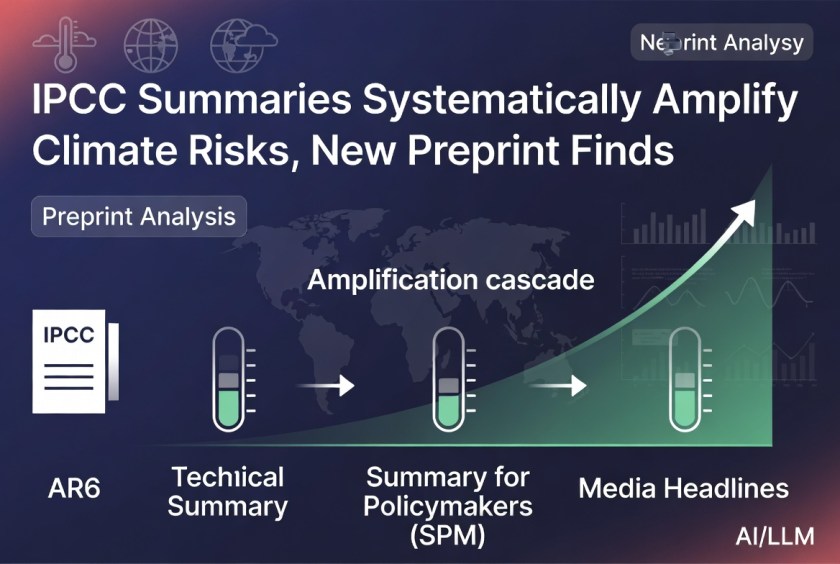


You must be logged in to post a comment.