Global warming, climate change, all these things are just a dream come true for politicians. I deal with evidence and not with frightening computer models because the seeker after truth does not put his faith in any consensus. The road to the truth is long and hard, but this is the road we must follow. People who describe the unprecedented comfort and ease of modern life as a climate disaster, in my opinion have no idea what a real problem is.
The Media does not neutrally transmit IPCC findings. It applies its own filters, consistently tilting toward greater drama and urgency.
Media framing of the IPCC tends to amplify urgency and severity, often emphasizing worst-case or dramatic elements while simplifying or compressing uncertainty language.
The Media does not neutrally transmit IPCC findings. It applies its own filters, consistently tilting toward greater drama and urgency.
This is a predictable outcome of journalistic incentives rather than a conspiracy, but it underscores the value of going to primary sources (full reports, Technical Summaries) for balanced understanding. Independent AI-driven analyses like Galiani et al. offer promising tools for quantifying these distortions going forward.
Media framing of the IPCC tends to amplify urgency and severity, often emphasizing worst-case or dramatic elements while simplifying or compressing uncertainty language.
This aligns with the Galiani et al. preprint discussed in Roger Pielke Jr.’s Substack, which found a consistent severity shift (+5% to +9% on their scale) and uncertainty compression as IPCC content moves into newspaper coverage from major US/UK outlets.
Pielke’s June 8, 2026 Substack piece presents the Galiani et al. preprint as potentially groundbreaking empirical evidence of systematic amplification bias in the IPCC’s communication pipeline—specifically from Technical Summary (TS) to Summary for Policymakers (SPM), and then to media. This isn’t a broad attack on climate science fundamentals but a focused critique of how information is framed, simplified, and escalated as it moves toward policy and public consumption.
A new study finds the IPCC Summary for Policymakers has systematically amplified climate science beyond what the underlying report actually says
A potentially very significant new preprint by Galiani et al. documents how the IPCC (Intergovernmental Panel on Climate Change) and the media introduce bias into assessment and reporting on climate change — A bias toward more extreme claims. The Honest Broker has the story.
The paper is a preprint and its data files are not yet available, so the findings should be considered preliminary.
Specifically, the paper claims that the IPCC Summary for Policymakers (SPM) is biased toward making claims more extreme than the underlying science represented elsewhere in the IPCC reports. This assertion has often been made by critics of the IPCC, but this is the first analysis that I am aware of that seeks to systematically evaluate the claim with data.
Today’s post shares my interpretation of the new analysis.
What Galiani et al. Did
Scientific findings of the IPCC — especially those projecting climate futures — can be thought of as the result of a linear process, shown in the figure below. The process begins with the selection and prioritization of scenarios to be used in projective climate research. Researchers then apply those scenarios in further modeling, ultimately publishing results in the peer reviewed literature.
Then the IPCC, which is organized into more or less independent chapter teams, assesses the published literature producing a chapter (which goes through multiple drafts and comment stages). The IPCC Chapters are the basis for the IPCC Technical Summary and Synthesis Report, which then feed into a Summary for Policymakers (SPM). The SPM is typically what drives media coverage and policy.2
The figure above also shows with the red dashed-line the focus of Galiani et al. which represents a subset of this communiation chain. The paper focuses on three dimensions of potential bias: severity shift, uncertainty compression, and scenario salience.
Severity shift measures whether emphasis is given to the more extreme end of a source document’s reported quantitative range. The paper scores severity shift on a five-point ordinal scale: −2, −1, 0, +1, +2. Percentages in aggregate results — such as +13% — are averages across many scored pairs. Table 1 illustrates each level with a sea level rise example.
Uncertainty compression measures whether summaries strip out the IPCC’s formal probabilistic vocabulary — such as, virtually certain (99–100%), very likely (>90%), likely (>66%).
Scenario salience measures selective citation of individual scenario results.
The range of outcomes for any variable across scenarios — such as 0.28 m to 1.01 m of sea level rise by 2100 in AR6, or 1.4°C to 4.4°C of warming — is not a probabilistic distribution of real-world outcomes. The exercise reveals a design flaw in the IPCC — while some specialists may understand that projected ranges across scenarios for any variable are neither forecasts nor a probabilistic range, most others will not.
What Galiani et al. Found
Galiani et al. scored ~114,000 matched claim pairs drawn from all six IPCC Assessment Reports (1990–2023) and 116,000 newspaper articles from ten major US and UK outlets, using three independent large language models — GPT-5-mini, Claude Haiku 4.5, and Gemini 2.5 Flash — to evaluate each pair on the three dimensions: severity shift, uncertainty compression, and scenario salience. The headline result is unambiguous: at every measured stage, in every Assessment Report, claims shift systematically toward the more severe end of the scientific ranges presented by the IPCC in its Technical Summary.
The dominant effect is severity shift — the tendency to emphasize the upper end of reported quantitative ranges while backgrounding or ignoring the lower end. At the TS-to-SPM stage, severity shift ranges from +4% to +13% of the maximum possible upward distortion under their unitless ordinal scale (across the six Assessment Reports, peaking in AR4 (2007). Media coverage adds a further +5% to +9% bias on top of what the SPM already contains.
Uncertainty compression — the stripping of calibrated IPCC confidence qualifiers — is a secondary but consistent effect. Scenario salience is the smallest channel, which the authors interpret as evidence the cascade does not depend on scenario cherry-picking. However, the analysis fails to recognize that the largest scenario bias effect is already baked into the severity shift.
The figure below from the paper shows that the “amplification cascade” is documented across all IPCC assessment cycles, with the most recent three assessments showing greater bias in the SPMs towards amplifying scientific claims than the first three IPCC assessments.
Three further findings stand out.
First, in the AR6 cycle, left-leaning and right-leaning media outlets show virtually identical amplification patterns, after a divergence over the three previous cycles.
Second, the media results are robust across five alternative sample restrictions including removing The Guardian (most amplification), removing the Wall Street Journal (most de-amplification), and equalizing outlet weights — none of which changes the direction or qualitative magnitude of the findings.Interestingly, the media outlet judged to have played things the most straight? Fox News!
Third, the pattern reproduces independently across all three LLMs, with Gemini scoring systematically lower than GPT and Claude but all three showing the same directional cascade.
The fact that the media has a bias toward amplifying climate science will come as a surprise to absolutely nobody. However, the finding that the IPCC SPMs also reflect that same bias is a very significant finding.
Why Galiani et al. Matters
Galiani et al. offer the first evidence that the IPCC process amplifies climate science in the direction of more extreme conclusions, beyond those reported in the Technical Summaries, and by extension, beyond that found in the peer revewed literature. Because Galiani et al. look at only a subset of the climate science communication chain, their results should be interpreted as just a floor of possible amplification bias.
As I’ve documented here at THB at length, the over-reliance on extreme climate scenarios in research and policy represents an enormous source of bias, beyond that documented in this new preprint.
Scientists are claiming CSIRO job cuts will impede climate research. But the CSIRO has testified to the Senate there will be no impact on “the scale of research” into Climate Change.
Scientists are claiming CSIRO job cuts will impede climate research. But the CSIRO has testified to the Senate there will be no impact on “the scale of research” into Climate Change.
Scientists call for urgent funding as hundreds of CSIRO job cuts loom
In short:
Further detailsabout the up to 350 jobs losses expected at the CSIRO are likely to be announced this week.
A CSIRO scientist fears the cuts will harm Australia’s ability to adapt and respond to climate change, but the science agency says that’s not the case.
What’s next?
A union branch representing CSIRO scientists is calling for urgent funding to stop the job losses.
…
The Environment Research Unit is expected to be hit hardest with 130—150 positions, or up to 21 per cent of its workforce, flagged for cuts.
But the CSIRO has told a Senate inquiry the changes “will not impact the scale of research that the CSIRO undertakes in relation to climate change”.
…
The CSIRO staff association told a Senate inquiry it believed “fundamental research lacking industry partners” was vulnerable to cuts, even if it was essential to the public.
“Examples included research related to air quality and smoke detection, the integration of long-term field modelling with complex vadose modelling, biotechnology and climate modelling research,” it said.
Interesting that climate modelling “fundamentally” lacks in industry partners. You would have thought green industry champions like Twiggy Forest would have provided a bit of support.
I had to look up “vadose modelling”, apparently it relates to the speed at which pollutants enter the water table. Water table pollution and salt contamination is a big deal for Aussie farmers, so I’m surprised agricultural associations aren’t providing some support.
There were hints elsewhere in the article that some scientists thought the environmental science department was pushing funding into questionable activities, but that might be the usual academic back stabbing.
I find it fascinating both Australia and Canada are cutting environmental science funding at the same time.
In the Canada article above I hypothesised that Canadian cuts were because of government revenue shortfalls, and that may play a part, but why would both Australia and Canada announce the same cuts in the same short space of time? Why cut real world observations while allegedly maintaining funding for climate modelling? If anyone has more insight into what is happening, please leave a comment.
The 6th Assessment Report of the Intergovernmental Panel on Climate Change (IPCC AR6) concluded “It is very likely that well-mixed GHGs [greenhouse gases] were the main driver of tropospheric warming since 1979” (IPCC, 2021; p.5).
The 6th Assessment Report of the Intergovernmental Panel on Climate Change (IPCC AR6) concluded “It is very likely that well-mixed GHGs [greenhouse gases] were the main driver of tropospheric warming since 1979” (IPCC, 2021; p.5). This statement implies that all known climate forcings have properly been evaluated using the available data, and GHGs have been found to exert a disproportionally large radiative effect on the Global Surface Air Temperature (GSAT) over the past 45 years. However, a close examination of Chapter 7 of the Working Group I (WG1) Contribution to the IPCC AR6 (Forster et al. 2021), which discusses the Earth’s energy budget, climate feedbacks and climate sensitivity, reveals that the observed decrease of Earth’s albedo and the corresponding increase of absorbed shortwave radiation by the Planet for the past 20 years have not been taken into account as contributors to the recent warming. Section 7.2.2 of Chapter 7 entitled “Changes in Earth’s Energy Budget” acknowledges that there have been multidecadal periods of significant decreasing and increasing trends in surface solar radiation (SSR) called “global dimming” (i.e. from 1950s to 1980s) and “global brightening” (after 1980s), respectively. The report states: “There is high confidence that these [SSR] trends are widespread, and not localized phenomena or measurement artefacts.” Indeed, the existence of such dimming and brightening multi-decadal periods has been acknowledged by science for more than 10 years (Stanhill et al. 2014; Yuan et al. 2021), but the IPCC AR6 provides no global estimate of the observed positive trend in SSR since 1980s and its impact on GSAT. Instead, the Report simply states “The origin of these trends is not fully understood”.
With respect to the top-of-the-atmosphere (TOA) solar fluxes, Section 7.2.2 of the IPCC AR WG1 offers no analysis of the substantial decrease in Earth’s shortwave reflectance since 2000 observed by the NASA’s Clouds and the Earth’s Radiant Energy System (CERES) project (Loeb et al. 2018, 2019, 2020 and 2021) and also reported by other research teams (e.g. Dübal & Vahrenholt 2021; Stephens et al. 2022). The Report does not discuss the observed 2.0 W m-2 increase in solar-energy uptake by the Planet from 2000 to 2020 nor its contribution to the recent warming. What is even more puzzling, Subsection 7.2.2.1 of the IPCC AR6 WG1 Contribution features graphs in their Fig. 7.3 (on p. 936) showing an increasing reflected solar flux and decreasing outgoing thermal flux since 2000 that are supposedly based on CERES data. However, these trends are opposite of what CERES has actually measured and directly contradict results reported by prior studies. This article presents findings from our investigation of Fig. 7.3 in the IPCC AR6.
2.Figure 7.3 in the IPCC AR6 WG1 Contribution
Page 936 of the IPCC Climate Change 2021: The Physical Science Basis (IPCC, 2021) contains the following figure:
Panel (a) of Fig. 7.3 shows anomalies of the reflected solar flux, panel (b) depicts anomalies of the emitted (outgoing) thermal (longwave) flux, and panel (c) displays net-flux anomalies calculated as a difference between absorbed solar shortwave (SW) and outgoing longwave (LW) anomalies. Since reflection is opposite of absorption, the absorbed SW anomalies are obtained by simply multiplying the reflected solar anomalies by -1. Figure 7.3 also portrays simulation results from 7 climate models that were forced by observed sea-surface temperatures (SST) and sea-ice boundary conditions. Note that the CERES data are depicted as thick black lines while the multi-model means are shown as thick red lines.
The problem with IPCC’s Fig. 7.3 is that the plots of reflected solar and outgoing thermal radiation show opposite temporal trends compared to those found in the actual CERES observations. Figures 1 and 2 below illustrate this fact. At the same time, the net flux (a.k.a. the Earth’s Energy Imbalance or EEI) in the IPCC Figure has a correct trend (Fig. 3).
Figure 1. Trends of Earth’s reflected solar radiation in the CERES dataset (upper panel) and the IPCC AR6 WG1 Fig. 7.3(a) (lower panel). Note that the 13- vs. 12-month running means do not affect the flux trends.
Figure 2. Trends of Earth’s outgoing thermal radiation in the CERES dataset (upper panel) and the IPCC AR6 WG1 Fig. 7.3(b) (lower panel). Note that the 13- vs. 12-month running means do not affect the flux trends.
Figure 3. Trends of Earth’s net radiative flux (energy imbalance) in the CERES dataset (upper panel) and the IPCC AR6 WG1 Fig. 7.3(c) (lower panel). Note that the net-flux trend has not been altered in the IPCC’s Fig. 7.3.
We discovered this data-trend issue while working on a paper evaluating the contribution of Earth’s albedo decrease since 2000 to recent warming using the CERES dataset.
Upon a close examination, it became clear to us that the trend inversion of reflected solar and emitted thermal flux anomalies appeared to have been achieved by multiplying the original data series by -1. The text of the IPCC AR6 referring to Fig. 7.3 does not mention anything about altering the trends of key global energy-budget parameters, nor does it provide a clear explanation of the reason behind it. However, the caption of IPCC’s Fig. 7.3 contains the following peculiar sentence “All flux anomalies are defined as positive downwards, consistent with the sign convention used throughout this chapter.” This statement is perplexing, because flux anomalies are independent of the flux direction. Anomalies are simply departures of timeseries data from an arbitrary chosen reference value. In the case of the CERES dataset, flux anomalies are calculated with respect to the mean value of the deseasonalized timeseries over the entire period of observation. Hence, it is the choice of a reference value that solely determines, whether an anomaly is positive or negative irrespective of the flux direction. In other words, the sign of an anomaly is not subject to the definition of a positive flux direction as suggested by the caption of Fig. 7.3. Furthermore, calculating the anomalies of an environmental parameter (such as global temperature, ocean heat content, planetary radiative flux etc.) does not change the temporal trend of the original data set. This is basic knowledge in the field of climate science. In this regard, the statement in the caption of Fig. 7.3 that relates anomalies to a flux direction is physically meaningless and confusing.
Another problem with the IPCC’s Fig. 7.3 is that the net-flux anomalies shown in panel (c), whose trend has not been altered, cannot be calculated from the timeseries shown in panels (a) and (b) as expected. Since the net-flux anomaly is a difference between anomalies of the absorbed solar and emitted thermal fluxes, the graphs in panel (c) are physically and numerically incompatible with the those plotted in panels (a) and (b).
3.Correspondence with IPCC Authors about Fig. 7.3.
In an effort to clarify the above situation, we reached out to the Coordinating Lead Authors of Chapter 7 in the IPCC AR6 WG1 Contribution, Prof. Piers Forster at the University of Leeds (UK) and Prof. Trude Storelvmo at the University of Oslo (Norway). We asked them, who the authors of Section 7.2.2 in Chapter 7 were, where Fig. 7.3 appears. Prof. Forster promptly replied informing us that Section 7.2.2 was written and edited by Dr. Matthew Parmer at the University of Bristoll and UK’s Met Office (UK) and Dr. Chris Smith at the University of Leeds (UK). Dr. Palmer was the lead author of that Section. Prof. Forster also provided us with a link to the IPCC AR6 WG1 repository at GitHub.com, where all data files and Python processing scripts reside used to generate the figures appearing in the WG1 Report.
We searched the GitHub repository and found three text files containing the source data for Fig. 7.3 as well as a Python plotting script used to generate the actual figure panels. There was a TXT file for every panel of Fig. 7.3 providing both CERES observations and climate-model projections covering the period July 2000 – June 2017. Upon inspecting the data files and the Python script, we discovered that, indeed, the deseasonalized monthly anomalies of reflected solar and emitted thermal fluxes have been multiplied by -1 resulting in inversion of the original trends, and that this data manipulation occurred in the Python script generating the panels of Fig. 7.3. The text files contained unaltered data that exhibited correct trends. Figure 4 depicts the anomalies of reflected solar and outgoing thermal fluxes from CERES observations and climate-model simulations as found in the text data files on GitHub. Figure 5 shows a portion of the Python script, where the signs of shortwave (SW) and longwave (LW) anomalies (code parameters SW_dict and LW_dict) are inverted during the plotting process by placing a minus sign in front of the corresponding data arrays. The Python script inverted the trends of both the CERES data and climate-model projections.
Figure 4. Plots of TOA reflected solar and outgoing thermal flux anomalies found in text data files at the IPCC GitHub repository used to generate Fig. 7.3 in the IPCC AR6 WG1. These data show correct trends.
Figure 5. Portion of the Python script used by the IPCC authors of Section 7.2.2 to plot the TOA anomalies of reflected shortwave (SW), emitted longwave (LW) and net fluxes from both CERES observations and climate model projections. Note the minus sign in front of the arrays containing SW and LW flux data.
It is worth noting that, although the climate models correctly reproduced the overall pattern of observed changes in planetary SW and LW fluxes, the measured trends of these variables are much steeper compared to the modeled ones. Most importantly, the climate models significantly underestimated the rate of decrease of Earth’s albedo and the associated increase of absorbed solar radiation by the Planet since 2000. The rate of planetary cooling (i.e. emitted thermal flux) was also significantly lower in the model simulations compared to observations. An important detail in this comparison is that all models have been forced with observed sea-surface temperatures (SST) and sea-ice boundary conditions. Had the models been only guided by their internal physical processes without periodic nudging to observations, the above model-data comparison would likely have been much worse.
On July 8, 2024, we sent an email message to Dr. Palmer and Dr. Smith informing them about the findings from our search of the GitHub data repository and asking them to explain the reason for the trend inversion of the SW and LW flux anomalies in Fig. 7.3. We also sought their advice about whether we should use the timeseries shown in Fig. 7.3 or the data found in the source text files, if we decide to create customized graphs of TOA fluxes for a review paper we’ve been working on.
We received a reply from Dr. Palmer on July 10, 2024, where he acknowledged that the reflected solar and outgoing thermal flux anomalies had intentionally been multiplied by -1. However, his explanation for this data manipulation was simply an expansion of the justification stated in the caption of Fig. 7.3 that invokes flux direction. Specifically, Dr. Palmer wrote:
“… reflected SW and outgoing LW are both defined as positive in the upward/outward direction. Therefore, for those timeseries we multiply by -1 so that they are expressed in a way that is consistent with the rest of the chapter. This means, for example, that a decrease in reflected SW means a relative GAIN of energy in the Earth system. Similarly, an increase in outgoing LW means a relative LOSS of energy in the Earth system. Note that in the figure we label these as “global solar flux anomaly” and “global thermal flux anomaly” rather than “reflected SW flux” and “outgoing LW flux”.”
As discussed above, this explanation makes no physical sense, because anomalies are always defined with respect to a chosen reference value and, therefore, have nothing to do with flux direction. Also, expressing a timeseries in terms of anomalies is not supposed to change the temporal trend of the original data. Dr. Palmer correctly pointed out that multiplying anomalies of the reflected solar flux by -1 produces a timeseries of a relative energy gain by the system. This new timeseries is called absorbed solar flux, because reflection is opposite of (and complementary to) absorption. Hence, panel (a) of the IPCC Fig. 7.3 essentially shows anomalies of the absorbed solar flux by Earth. The problem is that the caption of Fig. 7.3 labels this panel as “reflected solar”, which is misleading. By mislabeling the solar flux in the figure caption while recognizing that Fig. 7.3 (a) depicts a relative gain of solar energy by the Earth system, Dr. Palmer effectively obscured a key natural driver of climate related to the Sun.
On the other hand, multiplying the outgoing thermal flux anomalies by -1 produces nothing meaningful, because (unlike the solar flux) Earth’s LW radiation is always directed outward and does not have a complementary flux directed inward. By showing a decreasing thermal emission from Earth over time as done in Fig. 7.3 (b), the authors of Section 7.2.2 (Dr. Palmer and Dr. Smith) de facto suggest the presence of “heat trapping” in the climate system by increasing concentrations of atmospheric greenhouse gases. However, the 2nd Law of Thermodynamics makes it impossible for an open system with a rising surface temperature such as Earth to have a decreasing outgoing thermal emission. In other words, by inverting the trend of the TOA outgoing LW flux, the IPCC authors misrepresented the physical reality!
Interestingly, Dr. Palmer advised us to use the data in the text files found in the GitHub repository in case we wanted to create customized plots of CERES and modeled radiative fluxes. We interpreted this as an acknowledgement that the correct data were contained in the text files rather than Fig. 7.3.
In our reply to Dr. Palmer, we listed a series of specific concerns that the trend inversion of reflected solar and outgoing thermal fluxes made in Fig. 7.3 was methodologically inappropriate, because it fundamentally changes the observed behavior of the climate system over the past 20 years and creates a false impression about climate drivers in the minds of researchers and politicians reading the IPCC Report. Dr. Palmer did not address our concerns and instead directed us toward an official IPCC webpage, where we could raise our issues. Since Dr. Palmer did not recognize the misrepresentation of satellite data in Fig. 7.3, it is possible that he was genuinely confused about flux anomalies and how they are calculated judging by the following odd statement he made in one of his replies: “I don’t think there is any fundamental issue here – just different choices about the sign convention used”.
The truth is that the flux-trend inversions in Fig. 7.3 have enormous implications for both IPCC’s main conclusions and the climate theory; hence, they must be exposed and explained to the Public.
4. Implications of the Data Manipulation in the IPCC Fig. 7.3
Figure 7.3 in the IPCC AR6 WG1 essentially shows an increasing planetary albedo (panel a) and a decreasing infrared cooling to Space (panel b) for the past 2 decades, which is diametrically opposite of satellite observations. While the text of the IPCC WG1 Chapter 7 does not discuss any long-term trends of the TOA reflected solar and emitted thermal fluxes in the 21st-Century, Fig. 7.3 subconsciously suggests that the solar forcing played no role in recent warming and the rising concentrations of atmospheric greenhouse gases due to human industrial activity had increased the retention of heat in the climate system by impeding the outgoing LW radiation. These implications of Fig. 7.3 resulting from the data manipulation align perfectly well with the radiative greenhouse theory of climate change, but contradict directly the physical reality as measured by the CERES Project.
By inverting the trend of the reflected solar flux, the IPCC authors effectively eliminated the need to analyze the cloud-controlled solar forcing and its contribution to recent tropospheric warming while reaffirming at the same time the a-priori assumed pivotal role of greenhouse gases in driving the global surface temperature since 2000. The trend inversion of the outgoing thermal flux further solidifies the false impression that the Earth had warmed in response to “heat trapping” by increasing atmospheric trace gases.
Had the IPCC AR6 WG1 acknowledged the ~2.0 W m-2 increase of solar radiation absorption by the Planet between 2000 and 2020 as measured along the 13-month running mean curve of CERES anomalies (Fig. 6), the following conclusions/claims found in the Report’s “Summary for Policy Makers” would have been impossible to defend “It is unequivocal that human influence has warmed the atmosphere, ocean and land” and “It is very likely that well-mixed GHGs were the main driver of tropospheric warming since 1979” (IPCC, 2021; p.4-5). This is because a solar forcing of 2.0 W m-2 is more than sufficient to explain the entire observed warming for the past 2 decades, thus eliminating the need to invoke any model-generated (i.e. theoretical) radiative forcing by greenhouse gases.
Figure 6. Monthly radiative anomalies of the Earth’s absorbed solar flux estimated from the CERES EBAF 4.2 dataset by multiplying the reported reflected all-sky shortwave anomalies by -1 (in accordance with the fact that absorption is diametrically opposite of reflection).
For example, using the lowest value of IPCC’s transient climate sensitivity estimated from data on total anthropogenic forcing and temperature increase presented in Sections 7.3.5.2 and 7.3.5.3 of the IPCC AR6 WG1 Chapter 7 (Forster et al. 2021), i.e. 0.47 K/(W m-2), the warming caused by solar forcing alone for the period 2000 – 2020 should have been 2.0*0.47 = 0.94 K. The observed global surface warming over this time interval (calculated as an average temperature rise from 6 datasets) is 0.62 K along the curve of 13-month running means (Fig. 7). Similar results are obtained, if one uses the linear trends depicted in Figures 6 and 7 instead. Assuming the above IPCC climate sensitivity, the mean decadal increase of Earth’s sunlight absorption measured by CERES, i.e. 0.797 (W m-2)/decade (Fig. 6), corresponds to a global surface warming of 0.797*0.47 = 0.37 K/decade, while the actual observed warming is only 0.23 K/decade (Fig. 7). Thus, the observed solar forcing, which is mostly induced by natural cloud-albedo variations (Loeb et al. 2019), leaves no room for any action by greenhouse-gas radiative forcing or amplifying (positive) feedbacks claimed by the IPCC AR6. In addition, according to our analysis, the IPCC’s lowest climate-sensitivity estimate of 0.47 K/(W m-2) is still an overestimation of the Earth’s actual climate sensitivity, 0.29 K/(W m-2) inferred from observed data and a new physical model discussed elsewhere (Nikolov & Zeller, manuscript under review).
Figure 7. Monthly anomalies of the global surface air temperature calculated by averaging data from 6 datasets (HadCRUT5, GISTEMP4, NOAA GlobalTemp, BEST, RSS and NOAA STAR) and a 13-month running mean used to smooth the interannual variability.
In other words, if the measured increase of Earth’s sunlight absorption by CERES in the 21st Century was acknowledged in the IPCC AR6, it would have invalidated the Report’s central assertion that human carbon emissions were the main driver of climate in recent decades. It is conceivable then that radiative flux anomalies in Fig. 7.3 were manipulated and discussions about long-term CERES trends in Section 7.2.2 were intentionally omitted, precisely because the actual CERES data present a significant empirical challenge (obstacle) to the UN’s political Agenda (established by Resolution A/RES/43/53 of the UN General Assembly in 1988) to promote Anthropogenic Climate Change.
5.Conclusion
Considering the above facts and the enormous global socioeconomic impact of the IPCC’s conclusions and recommendations, we believe that it will be in the World’s best interest to launch an independent, critical reevaluation of fundamental premises in the climate theory from the standpoint of modern observations, and establish a new, objective peer-review system that ensures a complete and unbiased representation of all available data in the IPCC Reports. These efforts should be accompanied by a decisive depoliticization of climate science through the passing of appropriate legislation in the form of International Law that restores the financial independence of academic research, criminalizes political interference in scientific inquiry, and incentivizes the adoption of novel approaches to solving climate physics problems.
A new study comprehensively eviscerates a 57-year-old modeling paper upon which nearly the entirety of the IPCC’s CO2-drives-climate paradigm is based.
Carbon cycle with CO2 dioxide gas exchange process scheme outline concept. Photosynthesis, respiration and transport or factory emissions as biochemical system labeled explanation vector illustration.
A new study comprehensively eviscerates a 57-year-old modeling paper upon which nearly the entirety of the IPCC’s CO2-drives-climate paradigm is based.
Dr. Roy Clark has published a new 73-page study that rips apart the Manabe and Wetherald (1967) paper (MW67) that effectively hatched the IPCC-popularized concepts of CO2 climate sensitivity, radiative forcing, and positive/negative feedbacks so as to portray humans as predominantly responsible for climate changes.
The invalid, error-ridden conceptualization of a Earth land and ocean surface warmed by CO2 radiative forcing is one-dimensional and Flat Earth and assumes constant equilibrium, or perpetually steady states (that do not exist in the real world).
Even the most basic of assumptions in MW67 – that CO2 warms the Earth and ocean as its concentration is increased – is “largely a mathematical artifact produced by using a highly simplified one-dimensional radiative convective computer model.” CO2 climate sensitivity is but a calculation built on simplification errors.
The MW67 model (and the Hansen et al., 1981 paper that expanded it to its present-day form) neglects a host of real-world phenomena.
For example, evaporation (for the ocean) is ignored. Wind (which modulates evaporation) and waves are ignored. The ocean is assumed to be a flat, one-dimensional object that is predominantly heated by downward infrared radiation.
The effects of molecular collisions and turbulence in the troposphere are ignored. Diurnal temperature is ignored. Humidity is assumed to be perpetually constant rather than varying with the solar heating of the surface.
“The effects of advection, evaporation, subsurface thermal storage and ocean transport were ignored” in MW67.
The steady state assumption (that was first featured in 1896 by Arrhenius) is not real, as there is “no steady state air column in the real atmosphere and both turbulent and moist convection and subsurface thermal storage have to be included in the time dependent surface energy transfer analysis.”
The radiative “perturbation” from a CO2 increase from 280 to 560 ppm could only produce a 0.08 K temperature change over the course of a day using the MW67 radiative transfer model calculations. This variation is too small to detect, and it cannot accumulate over days or seasons.
Simply put, MW67 effectively constructs a set of assumptions about what may only occur in an imaginary-world. And this is the Nobel Prize-winning paper that underpins the modern-day version of climate science.
The famous ‘Fermi Paradox’ asks why, if life really is every bit as prevalent in the cosmos as some astrobiologists claim, with their equally famous ‘Drake Equation’ (which purports to show extraterrestrial life should be teeming just about everywhere in the universe), then where is it all?
The famous ‘Fermi Paradox’ asks why, if life really is every bit as prevalent in the cosmos as some astrobiologists claim, with their equally famous ‘Drake Equation’ (which purports to show extraterrestrial life should be teeming just about everywhere in the universe), then where is it all?
One possible answer might be that, once all intelligent civilisations reach a certain point of advancement, they stumble across the so-called ‘Great Filter’, a developmental obstacle which simply can never be overcome, no matter what planet you are living on, which ultimately destroys the whole species in an irreversible Mass Extinction Event. This Great Filter was once often imagined to be nuclear war – now, it is increasingly deemed to be climate change, a phenomenon no cutting-edge industrial civilisation can supposedly ever escape from unscathed, on Earth or off it.
One leading advocate of this kind of doomsday thinking today is Adam Frank, a U.S. astrophysicist whose 2018 book Light of the Stars: Alien Worlds and the Fate of the Earth and many co-authored academic papers have attempted to delineate a so-called “Astrobiology of the Anthropocene”. The ‘Anthropocene’ is the proposed (and recently rejected) term many scientists want to give to the current geological era on Earth, which they say has been irrevocably impacted and influenced by mankind and his technology, namely nuclear bombs and fossil fuels.
The Misanthropocene Era
As the distinctly Malthusian Frank said in a promotional 2018 interview with Scientific American: “My argument is that Anthropocenes may be generic from an astrobiological perspective: what we’re experiencing now may be the sort of transition that everybody goes through, throughout the Universe.”
If Anthropocenes (or Alienthropocenes) are indeed “generic”, then doesn’t that mean they can potentially be modelled? Possibly so. According to Professor Frank (not to be confused with The Simpsons’Professor Frink), “a civilisation, to some degree, is just a mechanism for transforming energy on a planetary surface”, a statement so utterly reductive in its nature it really ought to be the governing motto of the UN or EU these days.
Being something of a UFO buff myself, I have long been of the personal opinion that any actual aliens mankind should ever encounter will most likely turn out to be totally, well, alien in their nature, so much so we might not even be able to recognise them as being actual animate life-forms at all, a bit like most normal people feel when looking at Rachel Reeves. Professor Frank, though, disagrees, being apparently so in thrall to the currently dominant technocratic myth of Homo Statisticus (have you ever met anyone with 2.4 actual children?) that he feels it plausible to extend its basic pattern out across the entire Universe:
Well, just as we understand planetary climates pretty well, we can use the basic, fundamental tenets of life to guide us, too. Organisms are born, some of them reproduce, and they die. Living things consume energy and they excrete waste. That should be true even if they’re made of silicon or whatever. The next step is to incorporate principles of population biology, in which the idea of ‘carrying capacity’ — the number of organisms that can be sustainably supported by the local environment — is very important. This approach can also be mathematically applied to the state of a planet. So in our modelling work we’ve got an equation for how the planet is changing and an equation for how the population is changing. What ties them together is the predictable result that as environmental conditions on a planet get worse, the total carrying capacity goes down. A civilisation with a population of n will use the resources of its planet to increase n, but at the same time, by using those resources, it tends to degrade the planet’s environment.
But what if some aliens are incorporeal in nature, being made of gases, for instance? What if they therefore don’t actually need to eat or excrete at all? What if some of them are made from – or perhaps breathe – CO2? Or what if they are extremophiles (i.e., lovers of extreme climates) and therefore very high temperatures are actually good for some ETs’ health, not bad for it? Wouldn’t climate change akin to the kind Frank currently warns is taking place here on Earth make them thrive? Plus, what atmospheric gases will there even be to be boosted or dissipated by hypothetical industrial activity on other planets in the first place? Global warming may not even be chemically possible on Planet Fictional at all. These objections are all pretty obvious, and I do hope Professor Frank addresses them in his actual book (which I haven’t read), because if he hasn’t, it may be in danger of being interpreted by the ungenerous-minded as a work of mere sci-fi with numbers in it.
From Drake Equation to Fake Equation?
Speaking of numbers, as Frank and his co-researchers claim to have produced climate-models for generic other planets which do not even actually exist, where have they got the necessary data to fill them up with? It must be pretty detailed data because, look, Frank has somehow managed to create modelling graphs for the four presumed most likely scenarios for any planet’s long-term sustainability or civilisational collapse path, once intelligent life eventually appears on it:
Black line: made-up trajectory of made-up planet’s made-up population Red line: co-evolving made-up trajectory of made-up planet’s made-up environmental state (a proxy for its made-up temperature, says Professor Frank)
The first model-graph, labelled ‘Die-Off’, is the one which currently appears to apply to doomed old Planet Earth, at least in the view of Frank. According to Commander Data, talking in another 2018 promotional interview with LiveScience:
In this scenario, the civilisation’s population skyrockets over a short period of time, and as the aliens guzzle energy and belch out greenhouse gases, the planet’s temperature spikes, too. (In this study, temperature was used to represent human-made impacts on the planet’s habitability via greenhouse gas pollution.) The population peaks, then suddenly plummets as rising temperatures make survival harder and harder. The population eventually levels off, but with a fraction of the people who were around before. Imagine if seven out of 10 people you knew died quickly. It’s not clear a complex technological civilisation could survive that kind of change.
It probably could if they were all just civil servants.
Chatting SHIT?
Elsewhere, I have developed an innovative but speculative data-based concept of my own that I sincerely hope one day takes off. It is known by the acronym SHIT – or Statistics Having Imaginary Truth, and I coined it to denote the way most economists appear to just make up their forecasts and predictions out of thin air, producing ‘authoritative’ figures from nowhere like fiscal rabbits from a monetary hat. I write this present piece in the days immediately following Jeremy Hunt’s latest budget, by the way.
Although I tend to accept Earth is getting somewhat warmer these days (albeit nowhere near enough to destroy all human life upon it, or whatever Al Gore is currently standing naked in the street and yelling out loud to gullible passersby), I am nonetheless becoming increasingly inclined to consider long-term climate forecasts for our planet as increasingly becoming a complete and utter shower of SHIT likewise. If so, then how much more SHITtier must data-based climate models for other planets – planets which, I here repeat once again, and in italics for extra emphasis this time, do not even exist – be?
A further question must also be asked: where precisely did Frank get the data for the models and graphs reproduced in his 2018 book and articles from, exactly? According to what he said in his interviews, it was from prior studies made of Easter Island/Rapa Nui, the now-lifeless barren ocean island where, once upon a time, or so the standard promulgated narrative goes, foolish humans lived sustainably and well until, in a short-sighted fit of greed, they stupidly chopped down all the place’s trees, causing a drought and then being left with neither wood for fuel nor tasty arboreal produce to eat any more, thus dying off en masse. But was this really true?
Easter Egg-stinction Event
According to Professor Frank and his colleagues:
Easter Island presents a particularly useful example for our own purposes since it is often taken as a lesson for global sustainability. Many studies indicate that Easter Island’s inhabitants depleted their resources, leading to starvation and termination of the island’s civilisation.
Except that, “many studies” of another kind say this isn’t what actually happened there at all; in the opinion of some revisionist modern scholars, the standard story of Easter Island’s downfall and depopulation is actually a modern-day green myth designed to promulgate a cautionary warning about what will happen to modern-day industrialised Western civilisations if, like the imprudent old Easter Islanders, we too are rash enough to use up all our resources, destroy our local environment or help bring about acts of needless climate change.
The key 2021 paper purporting to demonstrate that this now famous old popular narrative is indeed just a myth contains much data and many graphs of a technical nature which, as far as this mere layman knows, may one day turn out to be just so much SHIT too. However, if the Easter Island Extinction narrative really was just an overblown environmentalist fable created to groom Greta Thunberg into existence, it would appear that the primary data Professor Frank says he and his colleagues based his models of shared off-Earth exoplanetary collapse on in his 2018 book were pure SHIT themselves, were they not?
There Is No Planet B
If Frank’s book was just marketed as a fun hypothetical thought-exercise, then I would find it wholly unobjectionable – it’s good for scientists to be free-thinkers. But he appears to have been promoting it as a spur to persuading politicians to implement actual real-world ‘climate-friendly’ policy objectives, and then being treated seriously in this aim by the mainstream scientific press. Therefore, you do have to ask: are such pop-science studies as Frank’s 2018 book, being aimed primarily at a lay-audience who probably know no better, really intended to function more as green-friendly political agitprop than as genuine science as such?
To end his LiveScience interview, Professor Frank asks his readers a question, the answer to which is clearly supposed to be obvious:
Across cosmic space and time, you’re going to have winners — who managed to see what was going on [i.e., a self-inflicted climate crisis] and figure out a path through it — and losers, who just couldn’t get their act together and their civilisation fell by the wayside. The question is, which category do we want to be in?
The winners! The winners! I want to be on the side of the winners! Except that, if the West does indeed compliantly tear up its whole current dirty – yet conveniently cheap, reliable and efficient – energy infrastructure to save going the way of the supposed Easter Island idiots, who will the actual winners on our planet be? The Chinese, Russians and others, who will quite happily go on burning coal and oil while we shiver in abject poverty and they quite happily extend their autocratic tentacles across the globe, enabled to dominate us militarily, economically and industrially by piles and piles of dubious pseudo-scientific SHIT being promulgated by a caste of weird, West-ruling cultists who honestly expect to be taken seriously when they go around shouting mad things like “Climate change killed off all the imaginary aliens, so junk your gas-fires now or DIE IMMEDIATELY!!” to ostensibly reliable, august and disinfo-slaying outlets like Scientific American and LiveScience.
Perhaps a sinister race of non-human alien beings do indeed walk among us after all – they’re called the governing class.
A recent article at The Hill claims that climate change is reversing the multi-decade trend of improving air quality in the United States, due to increased PM2.5 from wildfires and ozone from heatwaves, making it unsafe for children to play outside. This is false, air quality is improving, and the suggestion that kids should avoid outdoor play is hazardous to their health.
Silhouette, group of happy children playing on meadow, sunset, summertime
A recent article at The Hill claims that climate change is reversing the multi-decade trend of improving air quality in the United States, due to increased PM2.5 from wildfires and ozone from heatwaves, making it unsafe for children to play outside. This is false, air quality is improving, and the suggestion that kids should avoid outdoor play is hazardous to their health.
According to The Hill, the study’s authors project that “by midcentury, the increased levels of microscopic soot particles (PM10 and PM2.5) and ozone molecules entering Americans’ lungs will be back to the levels they were at in 2004–before a decades-long federal campaign to clean up the air.”
This is an odd claim, lacking any basis in data. In fact, since the Clean Air Act was enacted in 1963, and the U.S. Environmental Protection Agency outlined its first official standards for particulate matter and ozone in 1971, measured pollutants, including PM10, PM2.5, and ground level ozone have all declined dramatically.
First Street researchers and The Hill claim PM2.5 is being driven up by increased wildfires, but the fact is, wildfires aren’t getting worse due to climate change.
Currently available data from the National Interagency Fire Center show that while there was an increase in total acres burned between 1983 and the early 2000s, it has since leveled off, and the last two years have had some of the lowest wildfire incidences in the United States in recent years. Older data, much of which was expunged from the NIFC website in 2020, show that wildfires were much worse in the early 20th century than they are today. This trend does not track with the theory that wildfires are driven by fossil fuel use, and global warming. (See figure below)
The increase post-1983 is due almost entirely to a change in forestry practices and management, rather than the modest warming of the past few decades, as described in manyClimate Realism posts.
Additionally, satellites have been keeping track of wildfires for decades now, and that data clearly show that not only are wildfires not becoming more common or intense, they have declined since the early 2000s.
Since there are fewer wildfires, there is less smoke from wildfires, which means wildfires can’t be causing an increase in bad air days necessitating keeping kids indoors for their health. Environmental Protection Agency (EPA) data confirm this fact. The EPA reports that during the recent period of modest warming, since 1990 PM10 declined by 32 percent. In 2000, the EPA shifted its attention to also monitoring and regulating the emission of smaller particulate matter particles, PM2.5. Since then, PM2.5 has fallen by 37 percent.
With regards to ozone pollution, First Street argues that rising temperatures will increase ground level ozone, especially in major cities. The reality is that the best available temperature data does not show any increase in high temperature anomalies. (See figure below)
Also, the EPA’s air quality index data is available to the public, so we can look at what the air quality trends are for almost any major city. Taking New York City, since it is the largest city in America, we can see that air quality with regards to particulate matter seems to be getting much better in recent years, with only a few bad days last year (2023) due to that summer’s Canadian wildfires, many of which were started by arsonists. (See figure below)
The EPA’s air quality data show that overall, as the Earth has modestly warmed, ground-level ozone has declined 21 percent, since 1990. Once again, if ozone is declining, climate change can’t be making the air less healthy for children.
It is widely believed that many of today’s youths spend too much time indoors, wedded to their computers, video gaming systems, cell phones, and other devices. On this point an MIT study found:
Compared to the 1970s, children now spend 50% less time in unstructured outdoor activities. Children ages 10 to 16 now spend, on average, only 12.6 minutes per day in vigorous physical activity. Yet they spend an average of 10.4 waking hours each day relatively motionless.
Simultaneous to the decline in outdoor play, has been an increase in childhood obesity and associated diseases like diabetes. As a result, advocating keeping kids indoors while air quality is improving endangers their health, rather than protecting them from harm. This is especially true when one realizes that the U.S. EPA has found that indoor air contains two to five times more pollutants than outdoor air on average.
Outdoor air has not become more dangerous for children, but avoiding outdoor play and activities is a proven health hazard. The Hill should cautiously examine studies from organizations like the First Street Foundation with a skeptical eye, and check the hard data and context, before unnecessarily alarming its readers, and encouraging them to take actions that could result in poorer health for themselves and their kids. Climate change attribution is a hammer wielded by climate alarmists with each and every “non-optimal” weather condition or human health threat being nails they can drive their narrative and agenda home with, regardless of what the facts say.
Arctic sea ice continued its stonking recovery last month, recording its 24th highest level in the 45-year modern satellite record. As reported previously in the Daily Sceptic, the ice climbed to a 21-year high on January 8th. Good news, of course, for ice fans and polar bears, but frankly a bit of a disaster if you are forecasting future summer swimming galas at the North Pole to promote a collectivist Net Zero agenda.
Arctic sea ice continued its stonking recovery last month, recording its 24th highest level in the 45-year modern satellite record. As reported previously in the Daily Sceptic, the ice climbed to a 21-year high on January 8th. Good news, of course, for ice fans and polar bears, but frankly a bit of a disaster if you are forecasting future summer swimming galas at the North Pole to promote a collectivist Net Zero agenda. Live by the sword, die by the sword – if you cherry-pick the scientific record to state the climate is collapsing, it might be thought you have some explaining to do when the trend reverts to the norm. Just ask coral alarmists about two years of record growth on the Great Barrier Reef. Sadly, explanations there are none, just a deafening, stunned silence.
Arctic sea ice has long been a poster scare for climate Armageddon. But science tells us that it is cyclical and is heavily influenced by ocean currents and atmospheric heat exchanges. It would appear that these chaotic changes are beyond the ability of any computer to process, although a large, well-funded model industry begs to differ. The recovery in Arctic sea ice has been steady if slow and this has enabled the alarums to hang on in the mainstream headlines. Of course it could go into reverse, nobody really knows, least of all Sir David Attenborough who told BBC viewers in 2022 that the summer ice could all be gone by 2035. He relied, needless to say, on a computer model.
Most mainstream climate journalists just print what they are told without looking too closely at the source of the information. The U.S.-based National Snow and Ice Data Centre (NSIDC) is a source of interpretation for trends in polar ice, but care needs to be taken when reading its often gloomy monthly summaries. According to the NSIDC, January sea ice growth was “lower than average” throughout most of the month. It headlined its report: ‘Nothing swift about January sea ice.’ Other interpretations are available. Consider the graph below tracking the ice extent for January over the satellite record.
Statisticians can argue over when the sea ice started to recover but there has not been much decline going back to around 2007. In this case January shows a similar trend to that seen in September, the month with the lowest sea ice extent. A moving average line from around the middle of the last decade would show an obvious increase. But the NSIDC reproduces this graph for every individual month and year with a downward linear trend from 1979, a noted high point for recent sea ice. The graph is widely used on social media to counter any suggestion that the ice is recovering.
Note also that the NSIDC claims the January growth extent was “below average”. Well it depends on what average you are using. The NSIDC uses a comparative average from 1981-2010, despite a more recent decade of data being available. It is not hard to see why it prefers 1981-2010 since it includes the higher levels of the 1980s and excludes the lower levels of the 2010s. Taking a 1991-2020 average would likely lead to many more ‘above average’ observations. Data before 1979 is not as accurate, but levels going back to the 1950s suggest much lower sea ice extents. Perish the thought that comparisons should be made with these data or observations made about an obvious cyclical trend seen here and in the historical record going back to the early 1800s.
The NSIDC can spin its figures as much as it likes knowing that in the era of ‘settled’ climate science it is unlikely to be widely challenged. On a more serious note, this unwillingness to question perceived authority and engage in the scientific process gave us Michael E. Mann’s infamous 1998 ‘hockey stick’ graph. This purported to show declining temperatures for 1,000 years followed by a sharp recent uptick caused by human-caused burning of hydrocarbons. The unquestioning acceptance in mainstream media, science and politics can be said to have removed the concept of natural climate variability for a generation and put many Western countries on the road to Net Zero insanity. Now the hockey stick is centre stage in a Washington D.C. libel trial brought by Mann complaining that the journalist Mark Steyn branded his work a fraud. By some accounts, the hockey stick does not seem to be having a great time in the dock.
Professor Abraham Wyner is a distinguished statistician at Mann’s own University of Pennsylvania. Asked on the court stand whether Mann’s hockey stick used manipulative techniques, he replied “yes”. He suggested it was possible that if you knew where you wanted to get to, you can lead yourself into a conclusion different from someone who walked down a different set of paths.
In earlier court documents, Mann claimed wrongly that he was a Nobel laureate, a fact noted during the trial. His hockey stick abolished the Medieval Warming Period, while subsequent leaked Climategate emails referred to “Mike Nature Trick”. This was a practice of using the most convenient proxy or temperature measurements to fit the desired narrative.
In the course of his testimony, Dr. Wyner made comments that strike at the heart of so much that is wrong with the ‘settled’ science pronouncements that seemingly cannot be disputed or even discussed.
And so what happens is, and what is happening today in statistical analysis… we’re in a crisis. A crisis of trust and replication because so many results that were thought to be true turned out not to be true and correct have now gone back and looked at or attempted to be replicated and they didn’t work. Lots of things we thought were true turned out not to be true. It’s a crisis. A problem [my colleague] has identified is due to really bad statistical sets of methods that allow you to get away with choices that would produce a very different result if you did it differently.
What the last two decades or so have shown us is that activists will use any weather outlier or natural disaster to claim the climate is collapsing, or the Earth is “boiling” in the odd universe occupied by UN Secretary-General Antonio Guterres. Statistics are bent to fit the desired narrative whether it be natural waxing and waning of ice levels or typhoon jets landing near a measuring device showing a 60-second 40.3°C temperature blip ‘record’ at RAF Coningsby. Net Zero is starting to unravel thread by thread, and it is time the spotlight was amped up to maximum to shine a light on all the dodgy science used to promote this horrendous reset of human society.
Chris Morrison is the Daily Sceptic’sEnvironment Editor.
The alternative climate reality that the U.K. Met Office seeks to occupy has moved a step nearer with news that a group of its top scientists has proposed adopting a radical new method of calculating climate change. The scientific method of calculating temperature trends over at least 30 years should be ditched, and replaced with 10 years of actual data merged with model projections for the next decade.
The alternative climate reality that the U.K. Met Office seeks to occupy has moved a step nearer with news that a group of its top scientists has proposed adopting a radical new method of calculating climate change. The scientific method of calculating temperature trends over at least 30 years should be ditched, and replaced with 10 years of actual data merged with model projections for the next decade. The Met Office undoubtedly hopes that it can point to the passing of the 1.5°C ‘guard-rail’ in short order. This is junk science-on-stilts, and is undoubtedly driven by the desire to push the Net Zero collectivist agenda.
In a paper led by Professor Richard Betts, the Head of Climate Impacts at the Met Office, it is noted that the target of 1.5°C warming from pre-industrial levels is written into the 2016 Paris climate agreement and breaching it “will trigger questions on what needs to be done to meet the agreement’s goal”. Under current science-based understandings, the breaching of 1.5°C during anomalous warm spells of a month or two, as happened in 2016, 2017, 2019, 2020 and 2023, does not count. Even going above 1.5°C for a year in the next five years would not count. A new trend indicator is obviously needed. The Met Office proposes adding just 10 years’ past data to forecasts from a climate model programmed to produce temperature rises of up to 3.2°C during the next 80 years. By declaring an average 20-year temperature based around the current year, this ‘blend’ will provide ”an instantaneous indicator of current warming”.
It will do no such thing. In the supplementary notes to the paper, the authors disclose that they have used a computer model ‘pathway’, RCP4.5, that allows for a possible rise in temperatures of up to 3.2°C within 80 years. Given that global warming has barely risen by much more than 0.2°C over the last 25 years, this is a ludicrous stretch of the imagination. Declaring the threshold of 1.5°C, a political target set for politicians, has been passed based on these figures and using this highly politicised method would indicate that reality is rapidly departing from the Met Office station.
Using anomalous spikes in global temperature, invariably caused in the short-term by natural variations such as El Niño, is endemic throughout mainstream climate activism. ‘Joining the dots’ of individual bad weather events is now the go-to method to provoke alarm. So easily promoted and popular is the scare that an entire pseudoscience field has grown up using computer models to claim that individual weather events can be attributed to the actions of humans. ‘Weather’ and ‘climate’ have been deliberately confused. Climate trends have been shortened, and the weather somehow extended to suggest a group of individual events indicates a much longer term pattern. Meanwhile, the use of a 30-year trend dates back to the start of reliable temperature records from 1900, and was set almost 100 years ago by the International Meteorological Organisation. It is an arbitrary set period, but gives an accurate temperature trend record, smoothing out the inevitable, but distorting, anomalies.
By its latest actions, the Met Office demonstrates that the old-fashioned scientific way lacks suitability when Net Zero political work needs to be done. Trends can only be detected over time, leading to unwelcome delays in being able to point to an exact period when any threshold has been passed. Whilst accepting that an individual year of 1.5°C will not breach the Paris agreement so-called guard-rail, the Met Office claims that its instant indicator will “provide clarity” and will “reduce delays that would result from waiting until the end of the 20-year period”. The Met Office looks forward to the day when its new climate trend indicator comes with an IPCC ‘confidence’ or ‘high likelihood’ statement such as, “it is likely that the current global warming level has now reached (or exceeded) 1.5°C”. In subsequent years, this might become, “it is very likely that the current global warming level exceeded 1.5°C in year X”.
Why is this latest proposal from the state-funded Met Office junk science-on-stilts? A variety of reasons include that climate models have barely an accurate temperature forecast between them, despite 40 years of trying. Inputting opinions that the temperature of the Earth might rise by over 3°C in less than 80 years is hardly likely to improve their accuracy. There are also legitimate questions to be asked about the global temperature datasets that record past temperatures. Well-documented poor placing of measuring devices, unadjusted urban heat effects and frequent retrospective warming uplifts to the overall records do not inspire the greatest of confidence. At its HadCRUT5 global database, the Met Office has added around 30% extra warming over the last few years.
Chris Morrison is the Daily Sceptic’s Environment Editor.
I see that my favorite serially failed climate doomcaster, Dr. James Hansen, is at it again. Accompanied by his usual Greek chorus of co-sycophants, he’s written a new paper entitled Global warming in the pipeline, by James E Hansen, Makiko Sato, Leon Simons, Larissa S Nazarenko, Isabelle Sangha, Pushker Kharecha, James C Zachos, Karina von Schuckmann, Norman G Loeb, Matthew B Osman, Qinjian Jin, George Tselioudis, Eunbi Jeong, Andrew Lacis, Reto Ruedy, Gary Russell, Junji Cao, and Jing Li.
“We would be damned fools and bad scientists if we didn’t expect an acceleration of global warming,” Hansen said. “We are beginning to suffer the effect of our Faustian bargain. That is why the rate of global warming is accelerating.”
And of course, the press release contains the requisite global warming scare photo complete with a bleached skull in the lower right …
In the underlying paper, Hansen et al. ad infinitum warn us very seriously of a “predicted post-2010 accelerated warming rate”. And how do they know these things?
Models. Yeah, big surprise, I know.
Hmmm, sez I … so I figured I should take a look at the changes in the rate of temperature increase over the last 170 years. To do that, I started by looking at the Berkeley Earth temperature dataset. Then I thought “Well, somebody’s sure to claim I should have used the HadCRUT dataset”, so I threw that in for good measure. Here are the 50-year trailing accelerations for those two surface air temperature datasets. By “50-year trailing accelerations”, I mean the calculated acceleration (or deceleration) for the 50 years preceding a given date.
Figure 1. 50-year trailing acceleration, Berkeley Earth and HadCRUT global mean temperature datasets.
As you can see, at different times, there has been both acceleration and deceleration in the rate of temperature change over the last 170 years.
Of particular interest, and in total contradiction to James Hansen’s claim of a “predicted post-2010 accelerated warming rate”, since about 1990 or so the 50-year trailing acceleration has been decreasing. The rate of warming was actually decelerating starting, ironically, around 2010. And at present, acceleration over the final half-century of the record is approximately zero.
Go figure.
Mentions in their paper:
OBSERVATIONS: 11
MODELS: 148
In the midst of all of this, what’s actually going on with the temperature? Here are six different datasets.
Figure 2. CEEMD smooths, global mean temperature anomalies from six datasets. Anomalies are taken around the starting point in each smoothed dataset. Note that JMA only goes to Dec 2022, so it misses the final uptick.
There are some curiosities in Figure 2.
All six show that temperatures have been decreasing since the peak of the 2018 El Nino event. While such decreases are not uncommon in the record (see post-1998 El Nino in Fig. 2 above), it sure ain’t acceleration.
GISS, HadCRUT5, and Berkeley Earth are almost indistinguishable. HadCRUT5, plotted first, hardly peeks out from behind the other two.
Over the first twenty years up to the low temperatures around the year 2000, all six datasets are in agreement. After that, RSS goes high and JMA and UAH go low. What changed?
Finally, saying that there is some kind of “acceleration” post-2010 as Hansen et all of them claim is a scientific joke. The time period is far too short and the temperature variations are far too complex to say anything about possible acceleration.
Rain predicted tonight, wonderful rain in our dry part of the planet. My very best wishes to all, life is short, enjoy. It does no good to complain about the coming storm, so we might as well learn to dance in the rain …
w.
PS—When you comment, quote the exact words you are discussing. I can defend my words. I can’t defend your interpretation of my words. Thanks.
A new paper published at the end of October waxes dramatically over the dreaded consequences of model projections of the dreaded climate change and sea turtle reproduction.
Sea turtles are vulnerable to climate change since their reproductive output is influenced by incubating temperatures, with warmer temperatures causing lower hatching success and increased feminization of embryos. Their ability to cope with projected increases in ambient temperatures will depend on their capacity to adapt to shifts in climatic regimes. Here, we assessed the extent to which phenological shifts could mitigate impacts from increases in ambient temperatures (from 1.5 to 3°C in air temperatures and from 1.4 to 2.3°C in sea surface temperatures by 2100 at our sites) on four species of sea turtles, under a “middle of the road” scenario (SSP2-4.5). Sand temperatures at sea turtle nesting sites are projected to increase from 0.58 to 4.17°C by 2100 and expected shifts in nesting of 26–43 days earlier will not be sufficient to maintain current incubation temperatures at 7 (29%) of our sites, hatching success rates at 10 (42%) of our sites, with current trends in hatchling sex ratio being able to be maintained at half of the sites. We also calculated the phenological shifts that would be required (both backward for an earlier shift in nesting and forward for a later shift) to keep up with present-day incubation temperatures, hatching success rates, and sex ratios. The required shifts backward in nesting for incubation temperatures ranged from −20 to −191 days, whereas the required shifts forward ranged from +54 to +180 days. However, for half of the sites, no matter the shift the median incubation temperature will always be warmer than the 75th percentile of current ranges. Given that phenological shifts will not be able to ameliorate predicted changes in temperature, hatching success and sex ratio at most sites, turtles may need to use other adaptive responses and/or there is the need to enhance sea turtle resilience to climate warming.
1 INTRODUCTION
The world’s climate is changing at an unprecedented rate (Loarie et al., 2009). As a response, species, from polar terrestrial to tropical marine environments, have started to alter their phenology (e.g., timings of cyclical or seasonal biological events), shift their geographic distribution, and modify their trophic interactions (Dalleau et al., 2012; Parmesan & Yohe, 2003; Walther et al., 2002). Species’ responses to climate change can occur through at least three contrasting but non-exclusive mechanisms: (1) range shifts, (2) phenotypic plasticity, and (3) microevolution via natural selection (Fuentes et al., 2020; Hulin et al., 2009; Waldvogel et al., 2020).
Range shifts might be observed by sea turtles responding to changes in climate by shifting their range to more climatically suitable areas (Abella Perez et al., 2016; Mainwaring et al., 2017). It is crucial that these areas provide the environment necessary for colonization and are conducive to egg incubation (Fuentes et al., 2020; Pike, 2013). However, it has been indicated that areas with climatically suitable environments might be impacted by other stressors (e.g., sea level rise, coastal development), which might hinder the potential adaptive capacity of sea turtles (Fuentes et al., 2020). Phenotypic plasticity allows individuals to cope with environmental changes and relates to the ability of individuals to respond by modifying their behavior, morphology, or physiology in response to an altered environment (Hughes, 2000; Hulin et al., 2009; Waldvogel et al., 2020). Microevolution refers to adaptation occurring because of genetic change in response to natural selection (Lane et al., 2018). Phenotypic plasticity provides the potential for organisms to respond rapidly and effectively to environmental changes and thereby cope with short-term environmental change (Charmantier et al., 2008; Przybylo et al., 2000; Réale et al., 2003). However, phenotypic plasticity alone may not be sufficient to offset against projected impacts from climate change (Gienapp et al., 2008; Schwanz & Janzen, 2008). Microevolution, on the other hand, is thought essential for the persistence of populations faced with long-term directional changes in the environment. However, the ability of microevolutionary responses to counteract the impacts of climate change is unknown, because rates of climate change could outpace potential responses (Hulin et al., 2009; Morgan et al., 2020; Visser, 2008) although see Tedeschi et al. (2015).
It is unclear whether potential adaptive responses by turtles will be sufficient to counteract projected impacts from climate change (Monsinjon, Lopez-Mendilaharsu, et al., 2019; Moran & Alexander, 2014; Morjan, 2003). For example, sea turtles have persisted through large changes in climate during the millions of years that they have existed, demonstrating a biological capacity to adapt (Maurer et al., 2021; Mitchell & Janzen, 2010; Rage, 1998). Nevertheless, there is growing concern over the potential impacts that projected temperature increases might have on sea turtles (Patrício et al., 2021). Temperature plays a central role in sea turtle embryonic development, hatching success, hatchling sex ratios (Hays et al., 2017; Standora & Spotila, 1985), hatchling morphology, energy stores, and locomotor performance (Booth, 2017). Sea turtle eggs only successfully incubate within a narrow thermal range (25 and ~35°C), with incubation above the thermal threshold resulting in hatchlings with higher morphological abnormalities and lower hatching success (Howard et al., 2014; Miller, 1985). Furthermore, sea turtles have temperature-dependent sex determination, a process by which the incubation temperature determines the sex of hatchlings (Mrosovsky, 1980). The pivotal temperature (PT ~28.9–30.2°C for the species studied here, Figure S1), where a 1:1 sex ratio is produced, is centered within a transitional range of temperatures (~1.6–5°C, Figure S1), that generally produces mixed sex ratios. Values above the PT will produce mainly female hatchlings while values below produce mainly males (Mrosovsky, 1980).
Thus, projected increases in temperature may cause feminization of sea turtle populations and decrease reproductive success (Patrício et al., 2021). Many studies have suggested that sea turtles may adapt to increases in temperature by altering their nesting behavior, through changes in their nesting distribution, and nest-site choice (Kamel & Mrosovsky, 2006; Morjan, 2003), and by shifting nesting to cooler months (Almpanidou et al., 2018; Dalleau et al., 2012; Pike et al., 2006; Weishampel et al., 2004). Earlier nesting has already occurred in some turtle populations as a response to climatic warming (e.g., Pike et al., 2006; Weishampel et al., 2004). However, it is unclear whether phenological and behavioral shifts can sufficiently buffer the effects of rising temperatures (Almpanidou et al., 2018; Laloë & Hays, 2023; Monsinjon, Lopez-Mendilaharsu, et al., 2019). Although two other studies (Almpanidou et al., 2018; Laloë & Hays, 2023) have explored whether earlier shifts in phenology can preserve the present-day thermal niche of sea turtle nesting environment in a changing climate, only one other study (Monsinjon, Lopez-Mendilaharsu, et al., 2019) explores the implications of phenological responses to sea turtle reproductive output (hatching success and primary sex ratio), of which they focused on loggerhead turtles (Caretta caretta). Given that different sea turtle species have different spatial–temporal nesting patterns, we expand from this study focused on loggerhead turtles to assess the extent to which phenological shifts by four different species of sea turtles could mitigate increases in temperature at different sea turtle nesting sites globally to maintain the reproductive output of affected populations. Furthermore, to build on previous work, we explore whether nesting populations could benefit from both an earlier and a later phenological shift. To do so, we calculated the shift (backward and forward, respectively) that would be required for incubation temperature, hatching success, and sex ratio to stay similar to current ranges. In doing so we are the first study to date to investigate the implications of a later nesting by sea turtles.https://onlinelibrary.wiley.com/doi/10.1111/gcb.16991
I know that the study is making predictions or projections decades out, but other activist scientists, a caterwauling media, and compliant politicians all tell us, screw the models, we are currently in the throes of a CLIMATE CRISIS already!!!! Everything is suffering!
LMC has currently documented 21,020 nests: 215 from leatherbacks, 14,469 from loggerheads, and 6,336 from green turtles. All of these species are of sea turtles are threatened or endangered.
Last year, the total number of sea turtle nests was an impressive 18,132, but that number has just been blown out of the water with tons of nesting nights still to go in the 2024 season, according to the vice president of research at Loggerhead Marine Life Center, Dr. Justin Perrault.
“We have officially broken the nest record. As of today, we have 21,666 sea turtle nests,” he said.
FORT LAUDERDALE, Fla. – Biologists were taken by surprise by a record number of leatherback turtle nests found along some South Florida beaches this year.
The 79 nests laid by endangered turtles along beaches in Broward County this year is nearly double the previous record, the South Florida Sun Sentinel reported. The previous record was 46 in 2012, and the record low for leatherback nests was 12 in 2017.South Florida beaches see record year for sea turtle nests
Hawk’s Bill Turtle, Fort Lauderdale, Florida, by Charles RotterGreen Sea Turtle, Lauderdale By The Sea, Florida, by Charles Rotter
Sea turtles in Florida are handling the climate crisis quite well.


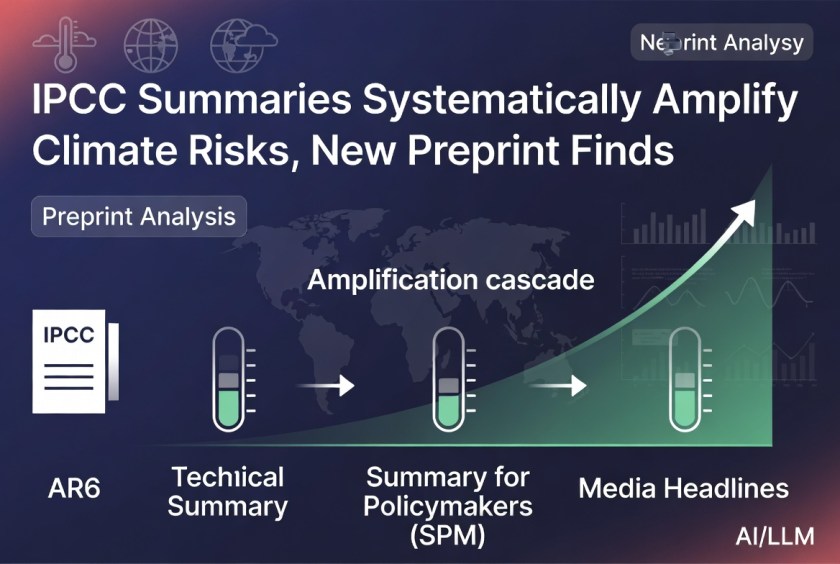





You must be logged in to post a comment.