Hail No! NBC, Climate Change Isnโ€™t Making Hail More Damaging

In the NBC News video report titled โ€œHow climate change could make hail storms even more destructive,โ€ viewers are warned that stronger storm updrafts caused by climate change might supercharge hailstones, making them up to 75 percent larger. This claim is false and misleading, lacking any evidentiary support. Scientific dataโ€”including that from the Intergovernmental Panel of Climate Change (IPCC)โ€™s Sixth Assessment Reportโ€”shows no observable increase in hail intensity due to climate change.

From ClimateRealism

By Anthony Watts

In the NBC News video report titled โ€œHow climate change could make hail storms even more destructive,โ€ viewers are warned that stronger storm updrafts caused by climate change might supercharge hailstones, making them up to 75 percent larger. This claim is false and misleading, lacking any evidentiary support. Scientific dataโ€”including that from the Intergovernmental Panel of Climate Change (IPCC)โ€™s Sixth Assessment Reportโ€”shows no observable increase in hail intensity due to climate change. In fact, IPCC AR6 Chapter 12 concludes that there are no significant trends or projections of increased hail frequency or severity due to a warming climate.

Real-world data and atmospheric physics donโ€™t align with NBCโ€™s hype. Hail formation requires a very specific cocktail of atmospheric conditions, including strong updrafts and a freezing layer deep enough to support hail growth. Warmer temperatures tend to reduce the vertical depth of this freezing level, making it more difficultโ€”not easierโ€”for large hailstones to form and survive to ground level.

The most telling and absurd quote in the entire segment is this one: โ€œTheir latest research shows that climate change will make updrafts even stronger, which could make the biggest most destructive hail up to 75 percent largerโ€ฆโ€. That statistic, plucked from speculative modeling and not grounded in observed trends, is presented as if it is established fact. Worse, itโ€™s paired with ominous warnings about damage to crops and rising insurance claims, all without context or acknowledgment that hailstorms have long been a fact of life in agricultural regions.

Attributing hail damage trends to climate change is scientifically dubious and intellectually dishonest. Hail damage costs have increased over time primarily due to increased development and property values in hail-prone areasโ€”not because hailstorms are getting worse. This mirrors the same pattern seen with hurricanes, tornadoes, and floods: more assets in harmโ€™s way, not more severe weather, results in greater damage and higher costs.

A thorough analysis by Climate Realism debunks the claim that hailstorms are intensifying. In fact, the data from the National Oceanic and Atmospheric Administration (NOAA) shows a slight decrease in reported significant hail events over recent decades. According to a 2019 peer reviewed study โ€œThe characteristics of United States hail reports: 1955-2014โ€ says:

Hail days, in contrast to hail reports, show no national trend over the last 25 y. Regional and local influences on hail reporting are identified stemming from verification procedures and contributions from local officials. The change in the definition of severe hail size from 0.75 in (1.9 cm) to 1.00 in (2.5 cm) in 2010 has a particularly clear signature in the report statistics. The contribution of storm chasers and source of report factors beyond population to the hail dataset is also explored, and the difficulty in removing these changes discussed. The overall findings highlight the limitations and non-meteorological features present in hail observations.

Even the American Meteorological Society (AMS) in its journals has noted the difficulty of linking hail trends to climate change due to the limited reliability of long-term hail observations noting, โ€œEstimating localโ€‘scale hail frequency โ€ฆ or assessing longโ€‘term trends in light of climate change are challenging tasks, particularly because direct, homogeneous, longโ€‘term hail observations are mostly missing.โ€

Hail is notoriously hard to measure consistently over time. Its occurrence is often underreported in sparsely populated areas, and radar-based detection has only become reliable in recent decades. Thus, claims of increasing trends require more scrutiny than NBC or ICECHIP provides.

The IPCCโ€™s Sixth Assessment Report clearly addresses hail concerns inย Chapter 12,ย stating:ย โ€œThere is low confidence in observed trends in hail and low confidence in the attribution of these trends to human influence.โ€ย It continues:ย โ€œFuture changes in hail are uncertain, and there is low confidence in model projections.โ€

Table 12.12 |ย onย Page 90ย โ€“ Chapter 12 of the UN IPCC Sixth Assessment Report. Emergence ofย Climate Impact Driversย (CIDs) in time periods, as assessed in this section.ย The color corresponds to the confidence of the region with the highest confidence: white colors indicate where evidence of a climate change signal is lacking or the signal is not present, leading to overall low confidence of an emerging signal.ย See the key at the bottom for the meaning of all colors. Note the section on Hail highlighted in yellow.

Massive hailstorms have occurred throughout history, long before anyone blamed climate change. The 1888 Moradabad hailstorm in India killed 246 people. The U.S. has recorded hailstones the size of volleyballs since the 1960s; no COโ‚‚ fingerprint required. Looking at a deeper historical perspective quickly dismantles the โ€œclimate is causing it allโ€ narrative pushed by NBC.

The real motivation behind NBCโ€™s video seems to be continuing funding for a particular group of scientists, those participating in ICECHIP (Investigation of Convective Hail in the Plains), a project โ€œmade possible through the support of the U.S. National Science Foundation (NSF),โ€ not an accurate assessment of hail threats. Nowhere on the siteโ€™s mission statement does ICECHIP mention climate change as a research objective. Their stated goal is to better understand the internal dynamics of hailstormsโ€”not to link those storms to global warming aka climate change.

So, when NBC laments potential cuts to NSF funding, and suggests that the Trump administration threatens Americaโ€™s ability to forecast weather hazards, it is not hard to see whatโ€™s really going on: special interests using climate change as a fear-inducing narrative to protect their federal funding.

Further, if weโ€™re going to talk about research integrity, letโ€™s ask why a group like ICECHIP would publicly tie its work to climate change only after securing federal funding. Their project materials donโ€™t reference it, their mission statement doesnโ€™t highlight it, and their methods are entirely focused on hail microphysics and not long-term climate attribution.

This is not to say that understanding hail formation isnโ€™t important. It is. Improved hail forecasting can reduce economic losses and improve public safety. But turning every scientific endeavor into a climate crusade only erodes public trust in science. When every research grant proposal must include a climate angle, it encourages groupthink, skewing scientific priorities away from discovery and toward narrative compliance.

The United States has always experienced hail. It is an inherent feature of mid-latitude convective storms, particularly in spring and early summer. Suggesting with little or no evidence that recent hailstorms are somehow novel or worsening because of rising COโ‚‚ is just propaganda.

NBCโ€™s segment fails to question any of the claims made by the ICECHIP. NBC doesnโ€™t reference the IPCC, it doesnโ€™t compare historical hail trends, it fails examine the extent to which urban expansion in hail prone areas result in rising insurance payouts and rates, and it doesnโ€™t even even distinguish between modeled projections and observed data.

Indeed, NBCโ€™s hailstorm climate segment is a masterclass in misleading science communication, conflating speculation with certainty, omitting key data and historical context, and promoting a self-serving narrative designed to secure federal funding for a particular group of researchers. In this story, NBC acts like an advocacy organization rather than an objective news outlet.

Bidenโ€™s Green Dream of EV Postal Truck Fleet Is a $10 Billion Failure

When kicking off the boondoggle โ€œGreen New Dealโ€ project, one Biden climate advisor described it as โ€œthe Biden climate strategy on wheels.โ€ True, that.

From Watts Up With That?

Legal Insurrection

When kicking off the boondoggle โ€œGreen New Dealโ€ project, one Biden climate advisor described it as โ€œthe Biden climate strategy on wheels.โ€ True, that.

Posted by Leslie Eastman 

Using the 2022 โ€œInflation Reduction Actโ€ as cover for the progressive โ€œGreen New Deal,โ€ the Biden administration funded a plan that aimed to eliminate gasoline-powered delivery trucks and deploy tens of thousands of battery-electric mail trucks by 2028.

And, like so many initiatives linked to Biden, it ended in complete failure. Republicans in Congress are working to claw-back the remaining monies.

The nearly $10 billion project โ€” which called for more than 35,000 battery-powered US Postal Service (USPS) vehicles to be completed by September 2028 โ€” was funded in part by $3 billion in funding from former President Joe Bidenโ€™s 2022 Inflation Reduction Act.

As of this month, the project is well behind schedule despite taxpayers forking over $1.7 billion โ€” prompting Capitol Hill Republicans to try to rescind the remaining nearly $1.3 billion earmarked from the IRA.

โ€œBidenโ€™s multi-billion-dollar EV fleet for the USPS is lost in the mail and more than $1 billion is postmarked to order more,โ€ Sen. Joni Ernst (R-Iowa) told The Post.

โ€œI am working to cancel the order and return the money to the sender, the American people. The rescissions package is a great start, but Congress must keep its foot on the pedal and make DOGE a lifestyle by stamping out waste like this on a regular basis.โ€

When kicking off the project that was supposed to generate a fleet of over 60,000 electric delivery trucks, one Biden climate advisor described it as โ€œthe Biden climate strategy on wheels.โ€

The post office said it is spending nearly $10 billion to electrify its aging fleet, including installing modern charging infrastructure at hundreds of postal facilities nationwide and purchasing at least 66,000 electric delivery trucks in the next five years. The spending includes $3 billion in funding approved under a landmark climate and health policy adopted by Congress last year.

The White House hailed the announcement as a way to sustain reliable mail service to Americans while modernizing the fleet, reducing operating costs and clearing the air in neighborhoods across the country.

โ€œThis is the Biden climate strategy on wheels and the U.S. Postal Service delivering for the American people,โ€ said White House climate adviser Ali Zaidi.

Truer words were never spoken by a Biden official.

Biden administration’s legacy: pic.twitter.com/6gHPKUgK33โ€” Leslie Eastman โ˜ฅ (@Mutnodjmet) July 18, 2025

The only thing that worked well in Bidenโ€™s Oval Office was the auto-pen.

The hypocrisy of Labourโ€™s attacks on Reformโ€™s net zero plansโ€“Ross Clark

The net zero lobby just gets sillier and sillier.ย Accordingย to energy minister Michael Shanks, Reformโ€™s policy of abandoning net zero targets is an โ€˜anti-growth ideologyโ€™ which would cost nearly a million jobs. Coming in a week when the Office of National Statistics (ONS) reported that the number of payrolled employees across the UKย fellย by 135,000 during Labourโ€™s first year in power โ€“ with 25,000 lost in May alone (the month after the higher rates of employersโ€™ national Insurance came into effect) โ€“ you might think that government ministers would want to avoid talking about job losses just at the moment, but no matter.

From NOT A LOT OF PEOPLE KNOW THAT

By Paul Homewood

A good piece by Ross Clark in the Spectator:

The net zero lobby just gets sillier and sillier. According to energy minister Michael Shanks, Reformโ€™s policy of abandoning net zero targets is an โ€˜anti-growth ideologyโ€™ which would cost nearly a million jobs. Coming in a week when the Office of National Statistics (ONS) reported that the number of payrolled employees across the UK fell by 135,000 during Labourโ€™s first year in power โ€“ with 25,000 lost in May alone (the month after the higher rates of employersโ€™ national Insurance came into effect) โ€“ you might think that government ministers would want to avoid talking about job losses just at the moment, but no matter.

Shanksโ€™ โ€˜evidenceโ€™ for his claim is a report by the CBI and the Energy and Climate Intelligence Unit (ECIU) claiming that the โ€˜net zero sectorโ€™ provides jobs for 951,000 people in Britain โ€“ 273,000 directly and 679,000 in the supply chain. It consists of 22,800 companies, who employees are apparently 38 per cent more productive than UK employees as a whole.

That, of course, all sounds fantastic. But the problem comes, as with so many of these things, when you start to look up the methodology. Who are these 22,800 companies who are counted as part of the net zero economy and whose existence is supposedly threatened by Reformโ€™s climate policy? I did ask the ECIU when it published its report back in February for a list of these companies but was told I couldnโ€™t have it โ€“ as it is โ€˜proprietary dataโ€™ provided by an organisation called the Data City. Just try using that argument when trying to get a paper in scientific journal.

But it did provide the following definitions. The count includes โ€˜organisations dedicated to energy management and energy infrastructure developmentโ€™, โ€˜companies focusing on landfill managementโ€™, โ€˜companies providing services and technology for the mitigation of pollutionโ€™, โ€˜companies dedicated to solid waste removal, management and processingโ€™, โ€˜companies focusing on the technology and development of electric vehiclesโ€™ and โ€˜companies providing services for increased energy efficiency in buildings. The first category could well include everyone who works for the National Grid, the second and fourth every waste management company in Britain, the fifth anyone who works for, say, Nissan, and the sixth any company that manufactures loft insulation or any builder who fits it.

Full story here.

As Ross Clark points out, the CBI analysis was a deliberate attempt to deflect attention away from the utter failure to produce all the green jobs we have been promised over the years:

โ€œThe 951,000 net zero jobs claim seems to me little more than crude propaganda to cover up the fact that Britain has failed miserably to capture more than a token share of global jobs in renewable energy. According to the International Renewable Energy Agency, Britain has a total of 57,000 in renewable energy โ€“ 0.3 per cent of 16.2 million jobs worldwide.โ€

BP Replaces Pro-Net Zero Chairman Amid Return to Oil and Gas

BP has replaced its pro-Net Zero chairman as it faces pressure from shareholders to switch its focusย away from renewables after its disastrous 2020 commitment to cut hydrocarbon output by 40%.

From The Daily Sceptic

Byย Will Jones

BP has replaced its pro-Net Zero chairman as it faces pressure from shareholders to switch its focus away from renewables after its disastrous 2020 commitment to cut hydrocarbon output by 40%. The Telegraph has the story.

Albert Manifold, who was chief executive of the building materials company CRH for a decade, will take over from Helge Lund, who announced his departure three months ago.

Mr Manifold will take charge in October at a crucial time for the FTSE 100 oil giant, which is struggling with a debt mountain, poor share performance and a reputation tarnished by its disastrous 2020 commitment to cut fossil fuel output by 40%.

Mr Lund had strongly backed the drive towards renewables led by disgraced former chief executive Bernard Looney, who abruptly resigned in September 2023 after failing to disclose relationships with employees.

Mr Lund has been under increasing pressure over that debacle, announcing plans to step down in April but remaining in place pending the appointment.

Dame Amanda Blanc, an independent director at BP, said incoming chairman Mr Manifold had shown as โ€œimpressive track record of shareholder value creation at CRHโ€.

She said: โ€œAlbert has a relentless focus on performance which is well suited to BPโ€™s needs now and into the future. He transformed and refocused CRH into a global leader by building on its rich heritage to deliver superior growth, cash generation and returns.โ€

Mr Manifold said the job would give him the โ€œthe opportunity to help the company reach its full potentialโ€. Mr Manifold is currently a Non-Executive Director at chemicals producer LyondellBasell Industries and at consultant Mercury Engineering.

Worth reading in full.

No More Easy Ride for Wind and Solar (OBBB guidance, risks ahead)

New wind and solar projects are expected to decline sharply over the next two years as the One Big Beautiful Billโ€™s strict tax credit rules, supply chain restrictions, and aggressive enforcement drive up costs and risk. With subsidies set to expire after 2027 for new projects, the decades-long era of easy tax-driven renewable development is coming to an end.

From Master Resource

Byย Lisa Linowes

New wind and solar projects are expected to decline sharply over the next two years as the One Big Beautiful Billโ€™s strict tax credit rules, supply chain restrictions, and aggressive enforcement drive up costs and risk. With subsidies set to expire after 2027 for new projects, the decades-long era of easy tax-driven renewable development is coming to an end.

โ€œUnder the new law, eligibility for the Production Tax Credit (PTC) and Investment Tax Credit (ITC) has become far more complex and legally uncertain. Thatโ€™s by design. The One Big Beautiful Bill Act prioritizes strengthening Americaโ€™s energy system with reliable, dispatchable powerโ€”not tax-driven projects that weaken the gridโ€™s resilience.โ€

The One Big Beautiful Bill Act (OBBB) marks a major shift in U.S. energy policyโ€”one that places American taxpayers and national interests squarely at the center of federal energy incentives. For too long, generous tax credits for wind, solar, and battery projects disproportionately benefited developers and tax equity investors, often with little scrutiny over whether those projects served meaningful economic or national objectives.

Under the new law, eligibility for the Production Tax Credit (PTC) and Investment Tax Credit (ITC) has become far more complex and legally uncertain. Thatโ€™s by design. The OBBB prioritizes strengthening Americaโ€™s energy system with reliable, dispatchable powerโ€”not tax-driven projects that weaken the gridโ€™s resilience.

For tax equity investorsโ€”whose participation depends on predictable tax credit monetizationโ€”this new environment is especially risky. Without assurance that a project will ultimately qualify, many may refuse to invest. Legal opinions that once provided comfort may now come with significant qualifications, leaving developers and investors navigating far more uncertain terrain.

At the heart of this shift are three critical risks: stricter scrutiny of what qualifies as โ€œbeginning construction,โ€ tough new supply chain rules aimed at eliminating dependence on Foreign Entities of Concern (FEOCs), and an aggressive enforcement mandate delivered by executive order.

The sections below explain how these reforms work together to protect taxpayers, reduce federal exposure to questionable projects, and ensure that any future renewable development serves Americaโ€™s long-term economic and national security prioritiesโ€”not just the financial interests of developers and investors.

Preventing Construction Timeline Gaming

One of the most immediate risks centers on howโ€”and whenโ€”a renewable energy project is deemed to have โ€œbegun construction.โ€ The OBBB codifies the IRSโ€™s longstanding testsโ€”the Physical Work Test and the 5 percent Safe Harborโ€”as they existed on January 1, 2025. But codification should not be mistaken for certainty. Key terms like โ€œphysical work of a significant natureโ€ remain undefined in both statute and guidance, giving Treasury ongoing discretion to interpret or narrow their application.

Timing is critical. Projects that begin construction between July 4, 2025, and July 4, 2026, have a four-year window to complete construction and be placed in service while still qualifying for credits. Any project that starts on or after July 5, 2026, faces a hard deadlineโ€”completion by the end of 2027โ€”or it forfeits eligibility for the PTC and ITC. This compressed timeline is likely to sharply reduce new project starts after July 4, 2026. (See Table)

This looming deadline creates predictable pressure on developers to lock-in their construction start dates during the 12-month window following enactment. However, developers and investors must understand the limits of the safe harbor protections. The four-year safe harbor only applies to the continuity requirementโ€”that is, assuming construction genuinely began, the IRS will not second-guess whether the project progressed continuously if it meets the deadline.

But the IRS still retains full authority to examine whether construction genuinely โ€œbeganโ€ in the first place. If the facts suggest that a developerโ€™s claimed start of construction was superficial, premature, or staged merely to preserve tax credit eligibility, the IRS may disallow credits retroactivelyโ€”regardless of whether the four-year window was met.

Developers and tax equity investors must be prepared to substantiate not only that they met the timeline but that they genuinely satisfied the start-of-construction standard with credible, documented evidence of real construction activity. Anything less leaves the projectโ€”and the tax creditsโ€”exposed to challenge.

Reckoning for Foreign Supply Chains

The second major compliance challenge comes from the OBBBโ€™s new restrictions on the use of materials and components sourced from Foreign Entities of Concern. For years, renewable developers relied on opaque global supply chainsโ€”especially in Chinaโ€”for solar panels, wind turbine parts, and battery components. These foreign sources often have ties to forced labor, military-linked entities, or regimes hostile to U.S. interests.

Wind and solar projects that start construction in 2026 and expect PTC or ITC support must meet a strict Material Assistance Cost Ratio (MACR) threshold: at least 40% of direct material costs must come from non-prohibited sources. For projects starting construction in 2027 the ratio increases to 45%.[1] Failing to meet the threshold disqualifies the project from federal tax credits.

This compliance burden will drive many developers to accelerate their construction start dates into 2025, before the FEOC restrictions kick in. The OBBBโ€™s statutory anti-circumvention language grants Treasury sweeping authority to conduct audits and deny credits subject to lookback periods up to six years even if construction tests appear satisfiedโ€”based on โ€œfacts and circumstances.โ€ Activities that once sufficed, such as stockpiling equipment or off-site prep work, may no longer be viewed as legitimate. Developers who start construction in 2026 must secure sworn certification from every supplierโ€”under penalty of perjuryโ€”that no component or subcomponent was produced by, on behalf of, or controlled by a prohibited foreign entity.

DatePolicy/Restriction TriggeredImpact
Before 2025;
January 1 2025 -July 3, 2025
Prior to OBBB EnactmentNot impacted by OBBB
July 4, 2025OBBB Enactment DateDevelopers will likely rush to โ€œbegin constructionโ€ to qualify under existing tax credit rules before new restrictions hit.
July 4, 2025 โ€“ July 4, 202612-Month โ€œBegin Constructionโ€ WindowProjects started in this window get a 4-year completion window and avoid post-2026 restrictions, but risk heightened scrutiny over whether construction genuinely began.
January 1, 2026FEOC Restrictions BeginProjects must begin complying with Foreign Entity of Concern (FEOC) sourcing rules โ€” starting with a 40% U.S. or allied-sourced material threshold for wind/solar projects.
July 5, 2026Post-Window Construction RestrictionProjects started on or after this date must be placed in service by the end of 2027 โ€” eliminating long construction timelines and likely curtailing new starts.
Six-Year Clawback WindowIRS Enforcement PeriodThe IRS can audit and claw back tax credits up to 6 years on FEOC sourcing violations, heightening long-term compliance risks.

Executive Order: A Broader Mandate for Strict Enforcement

On July 7, 2025, President Trump issued an Executive Order (E.O.) amplifying the OBBBโ€™s enforcement agenda. The E.O. directs the Treasury Department to take โ€œall action as the Secretary deems necessaryโ€ to prevent manipulation of both the FEOC compliance requirements and the construction start testsโ€”even in cases where the statute itself is silent.

The E.O. reinforces the OBBBโ€™s core objectives but does not expand Treasuryโ€™s legal authority beyond what the statute provides. Instead, the EO signals the administrationโ€™s clear intent to enforce the law aggressively, particularly regarding โ€œbegin constructionโ€ compliance and foreign supply chain restrictions. While the EO cannot create new penalties or rewrite statutory definitions, its real impact lies in shaping agency behaviorโ€”prioritizing strict audits, tougher guidance, and heightened regulatory oversight. In this sense, the E.O. magnifies the compliance risk developers and investors face under the OBBB, even though it does not alter the legal framework itself.

The E.O.โ€™s mandate ensures that even technically compliant projects may face rigorous scrutinyโ€”and potential retroactive challengeโ€”if the government questions the substance of their construction start or supplier certifications.

Conclusion: The Reckoning Has Arrived

The OBBB and its companion Executive Order create a regulatory environment defined by aggressive oversight, stricter compliance demands, and real financial consequences. The dual burden of proving construction compliance and navigating complex foreign supply chain restrictionsโ€”often years after tax credits are claimedโ€”will transform clean energy finance into a riskier, more disciplined endeavor.

For investors, the stakes are higher than ever. Without solid legal opinions, verifiable supplier chains, and consistent enforcement policies, many may choose to exit the market. For those who stay, the cost of risk will riseโ€”along with the overall cost of renewable energy deployment.

And thatโ€™s exactly the point. For years, critics warned that renewable subsidies enriched private developers while delivering uncertain public value. The OBBB responds to those concerns by closing loopholes, demanding verifiable construction, and limiting reliance on hostile foreign suppliers. We can expect the result to be fewer speculative projects, more disciplined accounting, and a market correction long overdue. For Americans seeking reliable, affordable, and sovereign energyโ€”this is the reckoning theyโ€™ve been waiting for.

โ€” โ€” โ€” โ€” โ€” โ€”

Lisa Linowes is an energy policy analyst and executive director of WindAction Group, where she monitors utility-scale renewable energy development and the public policies that shape its deployment.


[1] For energy storage projects, the MACR threshold begins at 55% in 2026 and rises by 5 percentage points annually, reaching 75% for projects beginning after 2029.

Great British Energy solar panels were made inย China

That latest Miliband lie did not take long to unravel then!

From NOT A LOT OF PEOPLE KNOW THAT

By Paul Homewood

That latest Miliband lie did not take long to unravel then!

The first schools in England to install what the government described as “Great British Energy solar panels” bought them from Chinese firms, the BBC has learned.

The first 11 schools involved in the GB Energy scheme bought solar panels from Aiko and Longi, two Chinese firms.

The government said the scheme was “the first major project for Great British Energy โ€“ a company owned by the British people, for the British people”.

Labour MP Sarah Champion said GB Energy should be buying solar panels from companies in the UK rather than China, where there have been allegations of forced labour in supply chains.

“Iโ€™m really excited about the principle of GB Energy,” she told BBC News.

“But itโ€™s taxpayersโ€™ money and we should not be supporting slave labour with that money. And wherever possible, we should be supporting good working practices and buy British if we can.”

She added: “That means that yes, unfortunately, in the short term, solar panels are probably going to be slightly more expensive.

“There are solar panels made around the world in Taiwan, Canada, even in the UK.”

Longi and Aiko both told the BBC they forbid forced labour in their production and supply chains.

China is the worldโ€™s leading producer of solar panels and the suppliers in the Xinjiang region have been linked to the alleged exploitation of Uyghur Muslims.

Earlier this year, the law was changed to ban GB Energy from investing in renewables if there is evidence of modern slavery in their production.

China has dominated the market and, according to the International Energy Agency, the countryโ€™s global share in all the manufacturing stages of solar panels exceeds 80%.

Champion, who is chair of the International Development Select Committee, said “abuse in renewable supply chains is insidious and hard to root out”.

But she urged ministers to exclude known human-rights offenders from winning public contracts.

A GB Energy spokesperson said all of the solar contracts issued under the schools initiative complied with the UKโ€™s modern slavery rules.

https://www.bbc.co.uk/news/articles/c1lj21pjn72o

Ed Miliband promised no solar panels from Chinese slave labour. Just because China says these ones did not use slave labour does not actually mean they are telling the truth.

But of course, Miliband knew that all along, did not he?

The โ€˜Fruitfulโ€™ Results of Increasing CO2

Among the climatically correct, nothing is more scandalous than describing carbon dioxide (CO2) emissions as beneficial. You can be blacklisted from public forums, professional networking sites, and even be removed from your tenured university position as an accomplished scientist.

From Watts Up With That?

By Vijay Jayaraj

Among the climatically correct, nothing is more scandalous than describing carbon dioxide (CO2) emissions as beneficial. You can be blacklisted from public forums, professional networking sites, and even be removed from your tenured university position as an accomplished scientist.

Nonetheless, the truth is this: CO2 is fundamental to the photosynthetic process by which plants make food for themselves โ€“ and ultimately for us. Furthermore, the increase in atmospheric CO2 from industrial activity in the past century has helped vegetation over most of the planet to flourish. Also benefiting plants has been the relative warmth of recent decades.

Among the beneficiaries are fruit plants, whose sensitivity to cold is well established. In April 2007, an unseasonable freeze caused considerable low-temperature injury to small fruit plants, including grapes, strawberries, blueberries and blackberries, in 21 U.S. states. The financial repercussions for the agricultural sector were substantial. In North Carolina alone, farming losses were estimated to be $112 million, including $86 million in damages to fruit crops.

During the Little Ice Age (1300โ€“1850), many of the fruit crops faced significant challenges from low temperatures, shorter growing seasons and extreme weather events like frosts, heavy rains and drought.

In Iceland and high alpine areas, agriculture nearly collapsed. In Chinaโ€™s Jiangxi Province, centuries-old orange cultivation was abandoned due to cold. In temperate zones, apple and pear trees struggled with erratic temperatures causing irregular blooming and lower yields.

Fast forward 175 years or so, and we have fruit crops thriving globally, thanks to elevated CO2 levels, relative warmth and a series of innovations in plant biotechnology. Regardless of whether certain politicians or news media believe it or not, plants love the warmer temperatures and increasing carbon dioxide of our season of plenty.

Rising temperatures extend growing seasons by delaying fall frosts and advancing spring thaws, allowing more plantings and reducing late-spring frost risks for orchard growers. The U.S. growing season has lengthened by over two weeks since the early 20th century.

This commentary was first published by AmericanGreatness on July 21, 2025.

Vijay Jayaraj is a Science and Research Associate at the COโ‚‚ Coalition, Fairfax, Virginia. He holds an M.S. in environmental sciences from the University of East Anglia and a postgraduate degree in energy management from Robert Gordon University, both in the U.K., and a bachelorโ€™s in engineering from Anna University, India.

Vauxhall owner slumps to ยฃ2bn loss after botched bet on hydrogen

Stellantis blames restructuring costs and US tariffs for slip into red

Stellantis blames restructuring costs and US tariffs for slip into red

The owner of Vauxhall has slumped to a โ‚ฌ2.3bn (ยฃ2bn) loss after cancelling an expensive bet on hydrogen-powered vehicles and electric cars. The Telegraph has the story.

Stellantis, which also owns Fiat and Peugeot, said scrapping plans for a fleet of hydrogen-powered vans as well as soaring restructuring costs and the impact of Donald Trumpโ€™s trade war would push it into the red for the first half of 2025.

In results on Monday, it reported a โ‚ฌ3.3bn hit to costs because of the cancelled hydrogen plan as well as plans to divert spending from electric to hybrid vehicles. The move comes after Mr Trump removed emissions-linked penalties for carmakers across the US.

Stellantis had planned to launch a range of hydrogen vans this year under its Pro One division, which were poised to be built in France and Poland.

However, the plans were ditched after being deemed too โ€œnicheโ€ and expensive. The companyโ€™s European operating chief, Jean-Philippe Imparato, said last week the hydrogen market had โ€œno prospects of mid-term economic stabilityโ€.

The company is also reviewing its position in Symbio, a hydrogen fuel cell company in which it owns a 33pc stake.

Stellantis is chaired by John Elkann, the grandson of Fiat scion Gianni Agnelli. The loss marks the first move by new chief executive Antonio Filosa, who Mr Elkann chose to replace former boss Carlos Tavares earlier this year.

Read the full story here.

Claim: Climate Crisis Food Price Inflation Delivered Victory to President Trump

Nothing to do with Biden and Kamalaโ€ฆ

From Watts Up With That?

Essay byย Eric Worrall

Nothing to do with Biden and Kamalaโ€ฆ

Rising food prices driven by climate crisis threaten worldโ€™s poorest, report finds

High cost of staples due to extreme weather could lead to more malnutrition, political upheaval and social unrest

Sarah Butler
Mon 21 Jul 2025 09.01 AEST

โ€ฆ

New research links last yearโ€™s surges in the price of potatoes in the UK, cabbages in South Korea, onions in India, and cocoa in Ghana to weather extremes that โ€œexceeded all historical precedent prior to 2020โ€.

โ€ฆ

It found food price spikes can have a wider economic impact, making it harder for economies to keep down overall inflation and so, for example, bring interest rates down. A hot dry spring in the UK this year, for example, partly drove unexpectedly high UK inflation figures published last week, dampening expectations for further interest rate cuts this summer.

The report also suggests โ€œhigh rates of inflation can directly alter election outcomes in modern democraciesโ€.

Maximilian Kotz, a Marie Curie postdoctoral research fellow at Barcelona Supercomputing Center and the lead author of the report, said: โ€œIt is clear the cost of living played a role in last yearโ€™s election in the US.โ€

He added: โ€œThese effects are going to continue to become worse in the future. Until we get to net zero emissions extreme weather will only get worse, but itโ€™s already damaging crops and pushing up the price of food all over the world.

โ€œPeople are noticing, with rising food prices No 2 on the list of climate impacts they see in their lives, second only to extreme heat itself.

โ€ฆRead more:ย 

https://www.theguardian.com/business/2025/jul/21/rising-food-prices-driven-by-climate-crisis-threaten-worlds-poorest-report-finds

The study referenced by the article (I think);

Climate extremes, food price spikes, and their wider societal risks

Maximilian Kotz, Markus Donat, Tom Lancaster, Miles Parker, Pete Smith, Anna Taylor Smith and Sylvia H Vetter

Accepted Manuscript online 13 June 2025 โ€ข ยฉ 2025 The Author(s). Published by IOP Publishing Ltd

Article information

Abstract

2024 was the hottest year on record, with global temperatures exceeding 1.5ยฐC above preindustrial climate conditions for the first time and records broken across large parts of Earthโ€™s surface. Among the widespread impacts of exceptional heat, rising food prices are beginning to play a prominent role in public perception, now the second most frequently cited impact of climate change experienced globally, following only extreme heat itself. Recent econometric analysis confirms that abnormally high temperatures directly cause higher food prices, as impacts on agricultural production translate into supply shortages and food price inflation. These analyses track changes in overall price aggregates which are typically slow-moving, but specific food goods can also experience much stronger short-term spikes in response to extreme heat. In this perspective, we document numerous examples from recent years in which food prices of specific goods spiked in response to climate extremes. By evaluating the extremity of the associated climate conditions, we thereby build a global and climatological context for this phenomenon. We further review the knock-on societal risks which these effects may bring with the ongoing intensification of extremes under climate change. These range from increasing economic inequality and the burden on health systems, as well as destabilising monetary and political systems. We discuss challenges and priorities for research and policy to address these risks.

Read more:ย https://iopscience.iop.org/article/10.1088/1748-9326/ade45f/meta

The main study highlights the risk for low-income households.

A catalyst for wider societal risks

โ€ฆ

Importantly, these climate-driven food price spikes can aggravate risks across a range of sectors of society. First, rising food prices have direct implications for food security, particularly for low-income households. This can result in a) households spending the same but buying less (either going hungry or depending on sources of charity); b) spending the same but buying cheaper options (typically cutting out nutritious foods like fruits and vegetables which are more expensive sources of calories) c) spending an even higher proportion of their income on food (with knock on effects on other areas of essential expenditure). These effects can be strongly regressive given the substantial disparities in the share of income spent on food by low- and high-income households. For example, in the USA the lowest income quintile spends approximately 33% of income on food compared to 8% in the highest income quintile. The fact that larger price increases occur in hotter and typically poorer countries will further amplify these effects

โ€ฆ

Fourth, food price inflation associated with climate-extremes may come to bear increasing political relevance. Anecdotal evidence from across history often cites food price increases as a precursor to political unrest and social upheaval (from the French and Russian revolutions of the 18th and 20th centuries, to the 2008/09 food crisis and 2011 Arab Spring). Such links are substantiated further by evidence showing a robust relationship between food prices and social unrest at monthly time-scales. Moreover, high rates of inflation can directly alter election outcomes in modern democracies. For example, high inflation reduced support for incumbent Democrats in the 2024 US election, and boosted support for extremist, anti-system and populist parties in elections held in advanced economies since 1948. These effects can be particularly strong when inflation affects real wages, as is the case with food prices.

โ€ฆRead more: Same link as above

The suggestion climate change is a major driver of food inflation is absurd, given the impactย climate policiesย in the USA and elsewhere have on farm input and food distribution prices. For example, California, arguably the most extreme green state in the union, farmers and truckers pay more for diesel that pretty much anywhere else in the USA. Such prices are a consequence of Californiaโ€™s regulatory hostility towards fossil fuel.

EIA diesel prices. Sourceย EIA.gov

These higher input prices, driven by state regulations, also appear to be impacting food prices in California, along with all the other environmental regulations California inflicts on farmers. California with its benign climate and fertile farmlands should have the cheapest food prices in the union, but that isnโ€™t the case.

Grocery Basket Prices by State. Sourceย World Population Review, Fair Use, Low Resolution Image to Identify the Subject.

Obviously diesel prices arenโ€™t the only factor, Californiaโ€™s overregulation of industry and radical minimum wage policies also play a part. But diesel prices are important to farming and shipping of produce.

California governor Gavin Newsom appears to have belatedly realised his administration could be the next victim of climate policy inflation voter backlash, if California does not change course.

And of course there is the fact that overall global farm yields are rising, a direct contradiction of Kotzโ€™s claims that global warming is harming food production. Farming has always been susceptible to weather. Temporary shortages caused by individual weather events are blips which have no long term impact on rising global agricultural productivity.

Extended crop yield meta-analysis data do not support upward SCC revision

Scientific Reports volume 15, Article number: 5575 (2025) Cite this article

Abstract

The Biden Administration raised its Social Cost of Carbon (SCC) estimate about fivefold based in part on global crop yield decline projections estimated on a meta-analysis data base first published in 2014. The data set contains 1722 records, but half were missing at least one variable (usually the change in CO2) so only 862 were available for multivariate regression modeling. By re-examining the underlying sources, I was able to recover 360 records and increase the sample size to 1222. Reanalysis on the larger data set yields very different results. While the original smaller data set implies yield declines of all crop types even at low levels of warming, on the full data set global average yield changes are zero or positive even out to 5ย ยฐC warming.

Read more:ย https://www.nature.com/articles/s41598-025-90254-2

But letโ€™s say Iโ€™m wrong. Lets play a thought experiment โ€“ what if climate driven food price inflation is a major factor?

Kotz admits that in a climate ravaged world, the most important factor in whether people get to eat regularly is personal wealth. Instead of gambling your nationโ€™s future on an elusive global climate agreement, the safest solution to such a threat is to implement aggressive pro-growth policies, to lift as many of your own people as possible out of poverty.

There has never been and will never be a meaningful global climate agreement, so it is futile to hope the future will be any different. No nation would choose mass starvation over cheating on any future climate agreement.

Past agreements, implemented at great cost to those nations which took them seriously, had no impact on the global rise of global CO2. There is no reason to believe future agreements will be any different.

Original sourceย NOAA, annotated to show significant geopolitical climate events.

Lifting your own people out of poverty regardless of CO2 emissions would shield your own people from any climate disruption. And of course, if all nations followed the same strategy, and focussed on economic growth and boosting agricultural productive capacity rather than smashing their economies with carbon quotas, there would be more than enough global wealth to take care of any remaining poor people. Everyone would have enough to eat.

This is only a thought experiment. The claim we face an agricultural climate crisis is absurd, there is no evidence global warming and CO2 has had any negative impact on agriculture. Even NASA has repeatedly admitted the world is visibly greening.

My point is, Kotzโ€™s claims fail on multiple levels. Not only is his claim that climate change is damaging agriculture not supported by the evidence, Kotzโ€™s suggested remedy of attempting to achieve Net Zero also does not make sense. And while food price inflation did cause a drop in support for Democrats, that food price inflation was because of Democrat policies, not because of climate change.

The only safe solution, as always, is to maximise economic growth, to maximise our capacity to deal with whatever the future throws at us.

SH and Tropics Lead UAH Cooling Juneย 2025

The post below updates the UAH record of air temperatures over land and ocean. Each month and year exposes again the growing disconnect between the real world and the Zero Carbon zealots.ย  It is as though the anti-hydrocarbon band wagon hopes to drown out the data contradicting their justification for the Great Energy Transition.ย  Yes, there was warming from an El Nino buildup coincidental with North Atlantic warming, but no basis to blame it on CO2.

From Science Matters

Byย Ron Clutz

The post below updates the UAH record of air temperatures over land and ocean. Each month and year exposes again the growing disconnect between the real world and the Zero Carbon zealots.  It is as though the anti-hydrocarbon band wagon hopes to drown out the data contradicting their justification for the Great Energy Transition.  Yes, there was warming from an El Nino buildup coincidental with North Atlantic warming, but no basis to blame it on CO2.

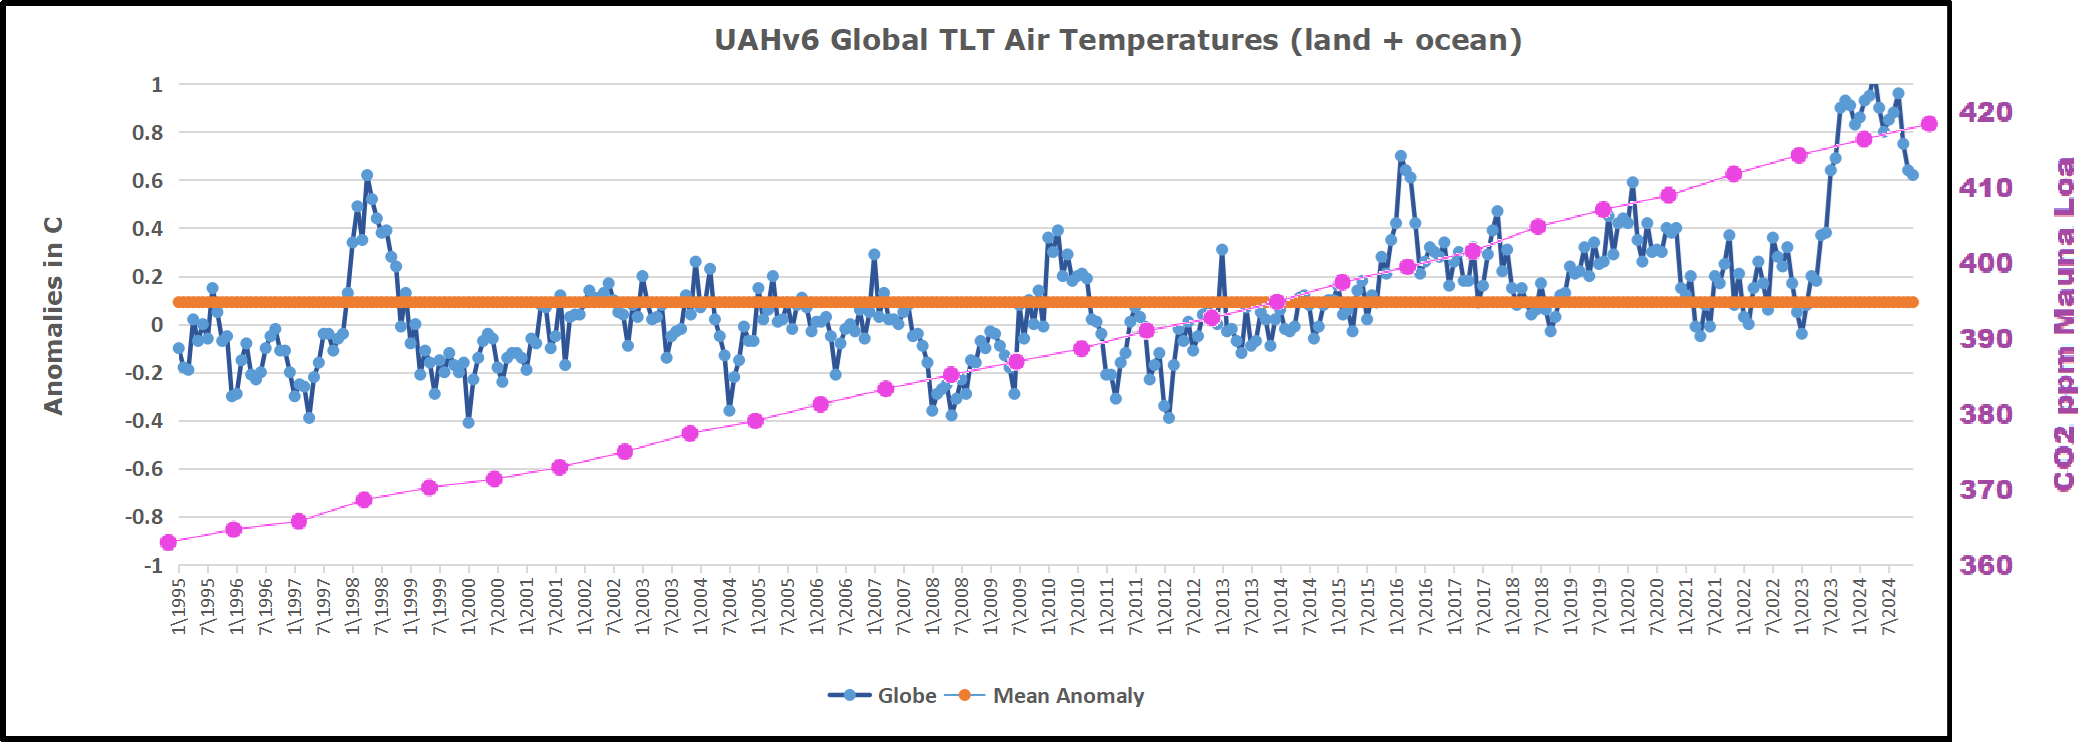
As an overview consider how recent rapid cooling  completely overcame the warming from the last 3 El Ninos (1998, 2010 and 2016).  The UAH record shows that the effects of the last one were gone as of April 2021, again in November 2021, and in February and June 2022  At year end 2022 and continuing into 2023 global temp anomaly matched or went lower than average since 1995, an ENSO neutral year. (UAH baseline is now 1991-2020). Then there was an usual El Nino warming spike of uncertain cause, unrelated to steadily rising CO2 and now dropping steadily.

For reference I added an overlay of CO2 annual concentrations as measured at Mauna Loa.  While temperatures fluctuated up and down ending flat, CO2 went up steadily by ~60 ppm, a 15% increase.

Furthermore, going back to previous warmings prior to the satellite record shows that the entire rise of 0.8C since 1947 is due to oceanic, not human activity.

gmt-warming-events

The animation is an update of a previous analysis from Dr. Murry Salby.  These graphs use Hadcrut4 and include the 2016 El Nino warming event.  The exhibit shows since 1947 GMT warmed by 0.8 C, from 13.9 to 14.7, as estimated by Hadcrut4.  This resulted from three natural warming events involving ocean cycles. The most recent rise 2013-16 lifted temperatures by 0.2C.  Previously the 1997-98 El Nino produced a plateau increase of 0.4C.  Before that, a rise from 1977-81 added 0.2C to start the warming since 1947.

Importantly, the theory of human-caused global warming asserts that increasing CO2 in the atmosphere changes the baseline and causes systemic warming in our climate.  On the contrary, all of the warming since 1947 was episodic, coming from three brief events associated with oceanic cycles. And in 2024 we saw an amazing episode with a temperature spike driven by ocean air warming in all regions, along with rising NH land temperatures, now dropping below its peak.

Chris Schoeneveld has produced a similar graph to the animation above, with a temperature series combining HadCRUT4 and UAH6. H/T WUWT

See Also Worst Threat: Greenhouse Gas or Quiet Sun?

June 2025 SH and Tropics Lead UAH Temps Lower

With apologies to Paul Revere, this post is on the lookout for cooler weather with an eye on both the Land and the Sea.  While you heard a lot about 2020-21 temperatures matching 2016 as the highest ever, that spin ignores how fast the cooling set in.  The UAH data analyzed below shows that warming from the last El Nino had fully dissipated with chilly temperatures in all regions. After a warming blip in 2022, land and ocean temps dropped again with 2023 starting below the mean since 1995.  Spring and Summer 2023 saw a series of warmings, continuing into 2024 peaking in April, then cooling off to the present.

UAH has updated their TLT (temperatures in lower troposphere) dataset for June 2025. Due to one satellite drifting more than can be corrected, the dataset has been recalibrated and retitled as version 6.1 Graphs here contain this updated 6.1 data.ย  Posts on their reading of ocean air temps this month are behind the update from HadSST4.ย  I posted recently on SSTsย June 2025 Ocean SSTs: NH Warms, SH Cools. These posts have a separate graph of land air temps because the comparisons and contrasts are interesting as we contemplate possible cooling in coming months and years.

Sometimes air temps over land diverge from ocean air changes. In July 2024 all oceans were unchanged except for Tropical warming, while all land regions rose slightly. In August we saw a warming leap in SH land, slight Land cooling elsewhere, a dip in Tropical Ocean temp and slightly elsewhere.  September showed a dramatic drop in SH land, overcome by a greater NH land increase. 2025 has shown a sharp contrast between land and sea, first with ocean air temps falling in January recovering in February.  Then land air temps, especially NH, dropped in February and recovered in March. Now in June SH land dropped markedly and NH land down slightly, while ocean air temps rose slightly in NH, offset by cooling in SH and Tropics.

Note:  UAH has shifted their baseline from 1981-2010 to 1991-2020 beginning with January 2021.   v6.1 data was recalibrated also starting with 2021. In the charts below, the trends and fluctuations remain the same but the anomaly values changed with the baseline reference shift.

Presently sea surface temperatures (SST) are the best available indicator of heat content gained or lost from earthโ€™s climate system.  Enthalpy is the thermodynamic term for total heat content in a system, and humidity differences in air parcels affect enthalpy.  Measuring water temperature directly avoids distorted impressions from air measurements.  In addition, ocean covers 71% of the planet surface and thus dominates surface temperature estimates.  Eventually we will likely have reliable means of recording water temperatures at depth.

Recently, Dr. Ole Humlum reported from his research that air temperatures lag 2-3 months behind changes in SST.  Thus cooling oceans portend cooling land air temperatures to follow.  He also observed that changes in CO2 atmospheric concentrations lag behind SST by 11-12 months.  This latter point is addressed in a previous post Who to Blame for Rising CO2?

After a change in priorities, updates are now exclusive to HadSST4.  For comparison we can also look at lower troposphere temperatures (TLT) from UAHv6.1 which are now posted for June 2025.  The temperature record is derived from microwave sounding units (MSU) on board satellites like the one pictured above. Recently there was a change in UAH processing of satellite drift corrections, including dropping one platform which can no longer be corrected. The graphs below are taken from the revised and current dataset.

The UAH dataset includes temperature results for air above the oceans and thus should be most comparable to the SSTs. There is the additional feature that ocean air temps avoid Urban Heat Islands (UHI).ย  The graph below shows monthly anomalies for ocean air temps since January 2015.

In 2021-22, SH and NH showed spikes up and down while the Tropics cooled dramatically, with some ups and downs, but hitting a new low in January 2023. At that point all regions were more or less in negative territory.

After sharp cooling everywhere in January 2023, there was a remarkable spiking of Tropical Ocean temps from -0.5C up to + 1.2C in January 2024.ย  The rise was matched by other regions in 2024, such that the Global anomaly peaked at 0.86C in April. Since then, all regions have cooled down sharply to a low of 0.27C in January.ย  In February 2025, SH rose from 0.1C to 0.4C pulling the Global Ocean air anomaly up to 0.47C, where it stayed in March and April. In May drops in NH and Tropics pulled the air temps over oceans down despite an uptick in SH. At 0.43C, ocean air temps were similar to May 2020, albeit with higher SH anomalies. Now in June Global Ocean air anomaly is little changed despite a slight rise in NH.

Land Air Temperatures Tracking in Seesaw Pattern

We sometimes overlook that in climate temperature records, while the oceans are measured directly with SSTs, land temps are measured only indirectly.  The land temperature records at surface stations sample air temps at 2 meters above ground.  UAH gives tlt anomalies for air over land separately from ocean air temps.  The graph updated for June is below.

Here we have fresh evidence of the greater volatility of the Land temperatures, along with extraordinary departures by SH land.  The seesaw pattern in Land temps is similar to ocean temps 2021-22, except that SH is the outlier, hitting bottom in January 2023. Then exceptionally SH goes from -0.6C up to 1.4C in September 2023 and 1.8C in  August 2024, with a large drop in between.  In November, SH and the Tropics pulled the Global Land anomaly further down despite a bump in NH land temps. February showed a sharp drop in NH land air temps from 1.07C down to 0.56C, pulling the Global land anomaly downward from 0.9C to 0.6C. In March that drop reversed with both NH and Global land back to January values, holding there in April.  In May sharp drops in NH and Tropics land air temps pulled the Global land air temps back down close to February value. In June the Global land air drop was significant, down from 0.67C to 0.55C despite a small rise in the Tropics.

The Bigger Picture UAH Global Since 1980

The chart shows monthly Global Land and Ocean anomalies starting 01/1980 to present.  The average monthly anomaly is -0.03, for this period of more than four decades.  The graph shows the 1998 El Nino after which the mean resumed, and again after the smaller 2010 event. The 2016 El Nino matched 1998 peak and in addition NH after effects lasted longer, followed by the NH warming 2019-20.   An upward bump in 2021 was reversed with temps having returned close to the mean as of 2/2022.  March and April brought warmer Global temps, later reversed

With the sharp drops in Nov., Dec. and January 2023 temps, there was no increase over 1980. Then in 2023 the buildup to the October/November peak exceeded the sharp April peak of the El Nino 1998 event. It also surpassed the February peak in 2016. In 2024 March and April took the Global anomaly to a new peak of 0.94C.  The cool down started with May dropping to 0.9C, and in June a further decline to 0.8C.  October went down to 0.7C,  November and December dropped to 0.6C. February went down to 0.5C, then back up to 0.6C in March and April driven by the bounce in NH land air temps, followed by Mayโ€™s return to 0.5C, and June slightly lower at 0.48C.

The graph reminds of another chart showing the abrupt ejection of humid air from Hunga Tonga eruption.

Note on Ocean Cooling Not Yet Fully Appearing in UAH Dataset

The above chart shows sea surface temperature anomalies (SSTA)ย in the North Atlantic 0 to 60N.ย  The index is derived from ERSSTv.5 by subtracting the global anomalies from the North Atlantic anomalies, the differences as shown in the chart. The baseline of 0.0C is the average for the years 1951 to 1980.ย  The mean anomaly since 1980 is in purple at 0.33C and persisted throughout up to 2018. The orange line is the average anomaly in the last six years, 2019 to 04/2025 inclusive, at 0.84C. The remarkable spikes in 2023 and 2024 drove that rise to exceed 1.4C, which has been cut in half over the last 10 months.ย  As Dr. Humlum observed, such oceanic changes usually portend air temperature changes later on.

TLTs include mixing above the oceans and probably some influence from nearby more volatile land temps.ย  Clearly NH and Global land temps have been dropping in a seesaw pattern, nearly 1C lower than the 2016 peak.ย  Since the ocean has 1000 times the heat capacity as the atmosphere, that cooling is a significant driving force.ย  TLT measures started the recent cooling later than SSTs from HadSST4 but are now showing the same pattern. Despite the three El Ninos, their warming had not persisted prior to 2023, and without them it would probably have cooled since 1995.ย  Of course, the future has not yet been written.