Global warming, climate change, all these things are just a dream come true for politicians. I deal with evidence and not with frightening computer models because the seeker after truth does not put his faith in any consensus. The road to the truth is long and hard, but this is the road we must follow. People who describe the unprecedented comfort and ease of modern life as a climate disaster, in my opinion have no idea what a real problem is.
Ed Miliband has unveiled plans to make it easier for homeowners to install wind turbines in their gardens as part of a mass expansion of green power.
The Energy Secretary has announced a consultation on relaxing planning rules governing the construction of turbines on residential and commercial properties.
The aim is to make it easier for farmers, people living in semi-detached houses and business owners to install the machines on their land.
How much more damage will this moron do to the country before he is finally got rid of?
In 2024, the United States consumed about 94 quadrillion British thermal units (quads) of energy, a 1% increase from 2023, according to our Monthly Energy Review. Fossil fuels—petroleum, natural gas, and coal—accounted for 82% of total U.S. energy consumption in 2024. Non fossil fuel energy—from renewables and nuclear energy—accounted for the other 18%. Petroleum remained the most-consumed fuel in the United States, as it has been for the past 75 years, and nuclear energy consumption exceeded coal consumption for the first time ever.
In 2024, the United States consumed about 94 quadrillion British thermal units (quads) of energy, a 1% increase from 2023, according to our Monthly Energy Review. Fossil fuels—petroleum, natural gas, and coal—accounted for 82% of total U.S. energy consumption in 2024. Non fossil fuel energy—from renewables and nuclear energy—accounted for the other 18%. Petroleum remained the most-consumed fuel in the United States, as it has been for the past 75 years, and nuclear energy consumption exceeded coal consumption for the first time ever.
When the Declaration of Independence was signed in 1776, wood, a renewable energy source, was the largest source of energy in the United States. Used for heating, cooking, and lighting, wood remained the largest U.S. energy source until the late 1800s, when coal consumption became more common. Wood energy is still consumed, mainly by industrial lumber and paper plants that burn excess wood waste to generate electricity.
Coal was the largest source of U.S. energy for about 65 years, from 1885 until 1950. Early uses of coal included many purposes that are no longer common, such as in stoves for home heating and in engines for trains and ships. Since the 1960s, nearly all coal consumed in the United States has been for electricity generation.
Petroleum has been the most-consumed source of energy in the United States since 1950. Petroleum products such as motor gasoline, diesel, jet fuel, and propane are commonly used across all sectors of the U.S. economy, from transportation to industrial chemicals and plastics.
Natural gas is the second-largest source of U.S. energy consumption, as it has been most years since it surpassed coal in 1958. Natural gas was once considered a waste byproduct of crude oil production but now has become a common energy source for heating and electricity generation.
Early use of water to power grist, lumber, and other milling operations is not well quantified and not included in our data, but such mills were common throughout early U.S. history. The first industrial use of hydropower to generate electricity in the United States was to power lamps at a chair factory in Grand Rapids, Michigan, in 1880. The world’s first hydroelectric power plant to sell electricity to the public opened on the Fox River near Appleton, Wisconsin, in 1882.
Other forms of renewable energy did not become significant contributors to U.S. energy production until more recently. In 2016, biofuels—including the fuel ethanol mixed in motor gasoline—became the most-consumed U.S. renewable energy source.
Electricity generation from some zero-carbon sources, such as wind and solar, has increased rapidly in recent years, while generation from others, such as hydropower and nuclear, has remained relatively flat. In 2022, U.S. energy consumption from renewable sources surpassed nuclear energy for the first time since 1984, and in 2023, renewables surpassed coal for the first time since around the early 1880s. The United States now consumes more energy from wind and solar sources individually than from hydropower.
To compare different forms of energy, we convert to common units of heat, called British thermal units. Appendix A of our Monthly Energy Review has the conversion factors that we use for each energy source, and Appendix E explains how we convert noncombustible renewable energy sources.
We never transitioned from wood to coal. In 2024, we consumed as much energy from wood as we did in ~1900.
We simply add new energy sources on top of legacy sources.
The notion that we are transitioning from fossil fuels to renewables is patently absurd.
Guess what? We really did have an energy transition. From 1860 to 1920, we literally did transition from renewables to fossil fuels.
I stand corrected. If I have to explain sarcasm, there’s no point in being sarcastic.
Happy Fourth of July! Happy 249th birthday to the USA!
In Congress, July 4, 1776
The unanimous Declaration of the thirteen united States of America, When in the Course of human events, it becomes necessary for one people to dissolve the political bands which have connected them with another, and to assume among the powers of the earth, the separate and equal station to which the Laws of Nature and of Nature’s God entitle them, a decent respect to the opinions of mankind requires that they should declare the causes which impel them to the separation.
We hold these truths to be self-evident, that all men are created equal, that they are endowed by their Creator with certain unalienable Rights, that among these are Life, Liberty and the pursuit of Happiness.-
It’s about time the legacy media criticised the Met Office!
Matt Ridley in the Telegraph:
I gather it’s been hot down south. My sympathies. As Londoners were sweltering, we had a chilly breeze off the North Sea in Northumberland. The UK Met Office says it is “virtually certain” that June (the hottest in England since 1884, second hottest in the UK) was made hotter by human activity.
Duh! Even if temperatures were not affected by greenhouse gases, which they are, the 34.7C (94.5F) recorded in St James’s Park on Tuesday might have something to do with that weather station being a low-reliability “class 5” site with an error rating of “up to 5C”. It’s next to a very busy tarmac path. Plus, it is in the middle of a city and therefore subject to a more general “urban heat island” effect. Research by Arup reckons London’s heat island is worth 4.5C extra warmth on average. So yes, the heat is indeed partly man-made – but not necessarily in the way the Met Office means.
Besides, it’s not exactly unusual to have hot days in summer: it reached 36.7C (98.1F) in Northamptonshire in 1911.
The Met Office exists to forecast the weather. But increasingly it seems bored by the day job so it likes to lecture us about climate change. And here it seems to have been embarrassingly duped by activists. Go on its climate pages and you find a forecast for the year 2070, that summers will be between one and six degrees warmer and “up to” 60 per cent drier, depending on the region. A lot of wriggle room in those caveats, note.
Then it admits: “We base these changes on the RCP8.5 high emissions scenario.” Aha! Unbelievably, shockingly, this national forecasting body has chosen as its base case for the future of weather a debunked, highly implausible set of assumptions about the world economy that was never intended to be used this way.
A report titled “African Energy Leadership: The Case for 100% Renewable Energy” was published last week, claiming that “Africa could save between $3 trillion and $5 trillion by transitioning to a fully renewable energy system by 2050.” This shift, it asserted, would also create up to 5.4 million new energy sector jobs, significantly more than the 3.2 million jobs projected “under current fossil fuel trajectories.” This report by the environmental NGO (ENGO) Power Shift Africa in collaboration with the University of Technology Sydney’s Institute for Sustainable Futures (UTS-ISF) was launched at the Bonn Climate Conference (SB62).
A report titled “African Energy Leadership: The Case for 100% Renewable Energy” was published last week, claiming that “Africa could save between $3 trillion and $5 trillion by transitioning to a fully renewable energy system by 2050.” This shift, it asserted, would also create up to 5.4 million new energy sector jobs, significantly more than the 3.2 million jobs projected “under current fossil fuel trajectories.” This report by the environmental NGO (ENGO) Power Shift Africa in collaboration with the University of Technology Sydney’s Institute for Sustainable Futures (UTS-ISF) was launched at the Bonn Climate Conference (SB62).
In recent years, the concept of “leapfrogging” over fossil‑fuel development to craft a 100 % renewable energy system in Africa has gained traction: bypass oil, gas and coal, build “clean” solar and wind farms instead, and align with the Paris Agreement’s 1.5 °C global warming target. Proponents point to “dramatic cost reductions” in solar and wind, enormous “theoretical potential” and massive economic benefits with “millions of new green jobs”.
Tilak’s Substack is a reader-supported publication. To receive new posts and support my work, consider becoming a free or paid subscriber.
And yet for all these glossy numbers, the physics, economics, and on‑the‑ground realities tell a far more sobering story. The leapfrog narrative is less a roadmap to prosperity than a vapid fig‑leaf for Western moral satisfaction, an exercise in a hypocritical carbon colonialism.
Leapfrogging is an Empty Notion
The concept of Africa leapfrogging to a 100% renewable energy system, bypassing conventional fossil fuels, defies the fundamental constraints of physics and economics. This has been incisively outlined by Mark P. Mills in his paper on “magical thinking” among promoters of renewable energy. Mills argues that renewables like solar and wind, despite cost declines, are inherently limited by their low energy density and intermittency, requiring vast land areas and expensive storage solutions to achieve reliability—challenges magnified in Africa’s context, where industrial-scale energy demand is critical for modern economic growth.
Solar and wind’s capacity factors (20–30% in optimal conditions) cannot match the consistent, high-density output of fossil fuels, which are essential for powering heavy industry, urban infrastructure, hospitals, water treatment plants and the like. Economically, the massive capital required for grid upgrades, battery storage, and transmission interconnectors—estimated at $100 billion annually for universal energy access by 2030—far exceeds Africa’s current 2–3% share of global renewable investments. Expecting renewables alone to meet Africa’s energy needs ignores the physical reality of energy density and the economic impracticality of scaling intermittent sources without reliable backups. These facts render leapfrogging a fantastical notion detached from the continent’s developmental imperatives.
Environmental zealots in the West would deny Africa the very infrastructure that historically lifted their own societies out of poverty. For instance, a major pollution problem afflicting developing countries is the domestic combustion of solid (bio)fuels. According to the World Health Organization, 4.3 million deaths annually are directly attributable to indoor air pollution. If poor Africans remain stuck on traditional biomass cookstoves instead of gaining access to cheap propane gas or cheap and reliable grid electricity (fuelled by natural gas or coal), this annual toll will only rise. In rich countries, households moved from dung, wood and crop residue fires to coal, to oil, to gas and electricity—each step up the energy ladder improving well‑being.
Today, those building blocks are blocked or actively removed by the climate zealots working via ENGOs and captive institutions of the climate industrial complex like the World Bank and the IMF. Instead of reliable electric grids, Africa is offered solar cookstoves and humanitarian sentiment—an insult in the guise of charity. As Vaclav Smil has conclusively demonstrated, no country in the world has developed without the dense energy available from fossil fuels. Coal, oil and natural gas have powered urbanization, industrialization and agricultural productivity.
What Do African Leaders Want?
It is not possible to generalize across the vast continent, but some facts stand out. Africa is the world’s second largest and second-most populous continent (after Asia in both aspects). Unlike Asia, Africa remains largely mired in poverty and much of the population has limited access to energy. Africa’s 54 countries, 3 dependencies, and one disputed territory (Western Sahara) accounted for just over 18% of the world’s population in 2020 but its share of global primary energy consumption amounted to only 3.4% in 2022. Poverty and poor access to energy, one suspects, are not just coincidences but reflective of a more general malaise. But what are its governments doing about it?
The African Group of Negotiators on Climate Change was established as an alliance of African member states to represent the interests of the region in international climate change negotiations with “a common and unified voice”. In an interview in June 2022, the Chair of the African Group of Negotiators (AGN) on climate change, Mr. Ephraim Mwepya Shitima of Zambia, said that “COP27 should be about advancing implementation of the [UN IPCC’s] National Determined Contributions (NDCs), including adaptation and mitigation efforts and delivery of finance to enhance implementation.”
In short, Mr. Shitima seemed to represent Africa as a supplicant for climate finance:
Africa is poor and responsible for a relatively small share of global carbon dioxide emissions yet suffers from the effects of climate change. Surely the developed countries, who are responsible for most of the historical emissions, need to financially assist Africa in adapting to climate change in any equitable outcome. For its part, Africa will pursue a “low carbon” and “sustainable” development trajectory.
This position, however, is far from representing a common and unified voice for the continent. In the lead up to COP27 (held in Egypt in 2023), Amani Abou-Zeid, the African Union Commissioner for Infrastructure and Energy, said that African countries advocated for “a common energy position that sees fossil fuels as necessary to expanding economies and electricity access.” N. J. Ayuk, Executive Chairman at the African Energy Chamber, is even more forthright:
“Africans don’t hate Oil and Gas companies. We love Oil and today we love gas even more because we know gas will give us a chance to industrialize. No country has ever been developed by fancy wind and green hydrogen. Africans see Oil and Gas as a path to success and a solution to their problems. The demonization of oil and gas companies will not work.”
Younger, more dynamic African leaders such as Abou-Zeid, Ayuk and Jusper Machogu find it not only infeasible but immoral for their governments to leave their fossil fuels resources in the ground in return for “climate finance” from virtue-signaling Western governments and multilateral agencies such as the World Bank to invest on unreliable solar and wind. Africa needs all the coal, oil and gas it can exploit, to achieve rapid economic development for their aspiring populations. Asia, and now President Trump’s American “energy dominance”, are their models for fossil fuel-based economic development, not a hypocritical, deluded EU that has begun backpedalling from the costly “energy transition” that their own citizens are rebelling against.
Energy Secretary Chris Wright believes that fossil fuels are the solution to the widespread lack of energy access in Africa, dismissing the challenge posed by climate change and calling too much emphasis on addressing it “destructive.” Speaking to a roomful of African officials and business people at a Powering Africa summit in Washington earlier this year, Secretary Wright said Western countries such as the United States have for years been “shamelessly” telling Africa that coal is bad and not to develop it. He said:
“That’s just nonsense, 100 percent nonsense…Coal transformed our world and made it better, extended life expectancy and grew opportunities, and coal globally will be the largest source of electricity for decades to come. That’s not a policy, that’s not a desire, that’s just a reality.”
As the Net Zero and “energy transition” narratives get increasingly threadbare, global investments into fossil fuel projects are surging. Global banks significantly increased their financing for coal, oil and gas projects last year, according to a new report by climate advocacy groups including the Rainforest Action Network and the Sierra Club, marking a reversal at a time when lenders are backtracking on climate pledges. According to the recently published report, banks fossil fuel financing was 23% higher than the previous year.
A spate of oil and gas projects are now being financed in Niger, Senegal, Cote D’Ivoire, Uganda and Kenya. In March, under Secretary Wright’s watch, the US Export-Import Bank (Exim) approved a direct loan of up to $4.7 billion to support the world-class Mozambique LNG project in Cabo Delgado, marking a significant milestone in the project’s revival after years of uncertainty.
Enough with the Technobabble
What is it about Africa that attracts Western climate zealots to offer policy advice on energy and environment? Is it that the West suffers from a Rousseau-esque angst over modern life and hankers after a mythological state of nature in Africa? Does the myth of the noble savage compel Westerners who regret their modern industrial norms to practice carbon imperialism over the world’s least developed continent? The “do as I say, not as I did” syndrome which afflicts Western intelligentsia is applied with particular insistence to African policymakers, given that the major Asian developing countries depend less on international development aid and finance for their domestic investments.
Africa is not an anthropological museum for Western virtue, and the energy “leapfrogging” myth is a neo-colonial fable dressed in technobabble. Africa should climb the same energy ladder that raised the West out of an energy-starved perennial poverty of the pre-industrial era.
According to a new study, abrupt (±1-2°C per century) shifts in North Atlantic Sea surface temperature (SST) have occurred routinely over the last 9000 years. These decadal- to centennial-scale climate changes were “induced by Holocene summer insolation and atmosphere-ocean internal variability.”
According to a new study, abrupt (±1-2°C per century) shifts in North Atlantic Sea surface temperature (SST) have occurred routinely over the last 9000 years. These decadal- to centennial-scale climate changes were “induced by Holocene summer insolation and atmosphere-ocean internal variability.”
The average SST throughout the 8.2 ka fluctuation was 10.0°C. The average 4.2 ka SST was 8.1°C. And during the Little Ice Age (LIA, 1600-1900 CE) the North Atlantic SSTs averaged 7.5°C.
Since 1900, SSTs have been stable to declining, suggesting the modern period is the coldest of the Holocene.
The Institute for Policy Integrity at New York University School of Law recently published The Scale of Significance: Power Plants: The U.S. Power Sector’s Annual Climate Pollution Causes Thousands of Deaths and Massive Economic Damage”. The lede provoked an immediate negative reaction from this retired utility meteorologist.
The Institute for Policy Integrity at New York University School of Law recently publishedThe Scale of Significance: Power Plants: The U.S. Power Sector’s Annual Climate Pollution Causes Thousands of Deaths and Massive Economic Damage”. The lede provoked an immediate negative reaction from this retired utility meteorologist.
The Trump Administration is openly questioning the significance of U.S. contributions to climate change, playing down U.S. greenhouse gas emissions as contributing only “some mysterious amount above zero to climate change.” According to a leaked draft of a proposed regulatory repeal, Trump’s EPA will compare the U.S. power sector’s greenhouse gas emissions to worldwide totals and find, judged on that relative scale, the sector’s contribution to climate change is neither “significant” nor “meaningful.” That kind of skewed appraisal would produce the reductio ad absurdum under which no U.S. sector, sliced thinly enough, is ever a significant source of greenhouse gases—a clearly irrational outcome.
By any measure, emissions from major U.S. industries like the electric power sector contribute significantly to climate damages. The best available evidence shows that each year of greenhouse gas emissions from U.S. coal-fired and gas-fired power plants will contribute to climate damages responsible for thousands of U.S. deaths and hundreds of billions in economics harms.
The report was authored by Peter H. Howard and Jason A. Schwartz. The document states that “Peter Howard is the Economics Director at the Institute for Policy Integrity, where Jason A. Schwartz is the Legal Director.”
Arguments
The reductio ad absurdum remark refers to the relative scale of US power plant pollution. It is based on the following graph. While US power plant emissions are likely still significant, using cumulative emissions from 1990 to 2022 is enormously misleading. The start of that period was before the results of massive emission reduction programs kicked in. Since then, the Acid Rain Program reduced SO2 emissions 93%, numerous nitrogen oxide emission reduction programs to reduce ozone pollution cut emissions 86%, and the fracking revolution made natural gas cheaper than coal and oil which reduced CO2 emissions 15%. Using cumulative emissions ignores those reductions. Moreover, changes to the rules impacts future emissions so the use of 30-year-old data is misleading.
The authors also argue that power plant emissions must be reduced because:
One useful way to confirm that a sector’s contributions to climate change merit regulation is to evaluate whether the benefits of reducing that sector’s emissions justify the costs. From that perspective, the U.S. power sector unquestionably makes a meaningful contribution to climate change that is worth regulating. EPA’s 2024 carbon pollution standards for fossil-fuel-fired ower plants, for example, entailed less than a billion dollars in costs per year and in return achieved $14 billion per year in climate benefits (not to mention an additional $6.3 billion per year in health benefits from reduction of co-pollutants)
The estimates are from the Fact Sheet for the Carbon Pollution Standards for Fossil Fuel-Fired Power Plants Final Rule, Standards And Regulatory Impact Analysis. This nonsense does not deserve a detailed rebuttal. Climate benefits were calculated based on the Social Cost of Carbon (SCC). Value judgements by biased analysts over-estimate societal benefit claims in the EPA Final Rule. Furthermore, the Fact Sheet states: “The Regulatory Impact Assessment projects 1.38 billion metric tons total of CO2 avoided from 2028-2047 systemwide along with tens of thousands of tons of nitrogen oxides (NOx), sulfur dioxide (SO2), and fine particulate matter (PM2.5). The use of avoided emissions increases the total, but SCC benefits are based on annual emission reductions. That approach coupled with biased SCC results in massive numbers that are not realistic.
The report also argues that US action will prompt other countries to cut their emissions in response to our reductions: “Regardless, most claims about leakage overlook how countries may be just as—or even more likely to—reciprocally reduce their own emissions in response to U.S. emissions-cutting policies and goals. The report disparages the idea that foreign countries will increase their emissions in response and suggests that leakage is not an issue. In the real world when an industry that depends on electrical energy cannot afford to stay in business in the US because the alternative to fossil-fueled electric production are so much more expensive, their product will be produced elsewhere. It is very likely that the alternative location does not have the same pollution and efficiency standards so the emissions will go elsewhere and increase to boot. Claiming otherwise is magical thinking.
There are other easily debunked claims that I do not have the time to address. However, I cannot let the claim that “The U.S. power sector’s annual emissions will cause thousands of U.S.. mortalities” go without a response. If their claims have merit, then the change in any of the claimed morbidity and mortality health effects should have improved from 1990 to the present proportional to the observed emission reductions. I have never seen any analysis that made such a claim, so I say that their projections are hokum. If any reader has found such an analysis, please let us all know.
Conclusion
The report concludes that “By any measure, emissions from major U.S. industries, like the electric power sector contribute significantly to climate damages.” The measures described in the report are biased, based on selective choice of metrics, and ignore historical emissions improvements.
Roger Caiazza blogs on New York energy and environmental issues at Pragmatic Environmentalist of New York. This represents his opinion and not the opinion of any of his previous employers or any other company with which he has been associated.
Apparently, Britain is running out of space for offshore wind!
The Telegraph report:
Britain risks running out of space for offshore wind farms, the boss of GB Energy has warned, potentially damaging Ed Miliband’s renewables blitz.
Dan McGrail, interim chief executive of the taxpayer-backed quango set up by the Energy Secretary, said UK waters are becoming too crowded for traditional turbines built in shallower seas.
As a result, he said officials must spend billions of pounds on new floating wind farms if it is to have any hope of hitting net zero by 2050.
Unlike fixed-bottom turbines, which can only be deployed in water less than 60-70 metres deep, floating alternatives can be tethered to the bottom of the seabed by cables.
This makes them the only real option for Mr Miliband as he races to build up to 10,000 new wind turbines by 2050.
“We know by 2030 that pretty much every offshore wind farm in the UK is going to have to be in water which is deeper than 80 meters,” he said in an interview with Bloomberg.
“Now that’s quite a technical point, but basically what it means is that those wind farms are going to have to float, which is an area of investment that is, at the moment, quite challenging.
“There’s a significant amount of private sector capital deployed, but it’s slowing down in its progress, so we’re going to look to come in at that riskier stage of projects in their development phase.”
This is where GB Energy’s £8bn funding pot can help, he said.
“Prior to the major investment decisions, when we do expect private capital to come in, we may deploy some of our capital as a minority partner – in order to send a signal to the wider investment community that the Government believes in the trajectory of these technologies,” he said.
The AR6 strike price for the Green Volt floating wind farm due to open in 2029 is £201.97/MWh, compared to £84.97 for normal offshore wind.
Simply throwing taxpayer money at these projects won’t alter the fact that they are massively expensive. One way or another, the public will end up paying the bill.
Plans for 2050 suggest we might need as much as 86 GW of offshore capacity by then, meaning an extra 40 GW will need to be added after 2030.
Based on current costings, that could add as much as £20 billion a year to electricity bills.
In capital terms, some estimates suggest floating wind farms may cost double fixed bottom ones – £8 million/MW against £4 million/MW. That would mean an extra £160 billion.
Previously I have demonstrated that changes in atmospheric CO2 levels follow changes in Global Mean Temperatures (GMT) as shown by satellite measurements from University of Alabama at Huntsville (UAH). That background post is reprinted later below.
My curiosity was piqued by the remarkable GMT spike starting in January 2023 and rising to a peak in April 2024. GMT has declined steadily, and now 14 months later, the anomaly is 0.48C down from 0.94C. I also became aware that UAH has recalibrated their dataset due to a satellite drift that can no longer be corrected. The values since 2020 have shifted slightly in version 6.1, as shown in my recent report NH and Tropics Lead UAH Temps Lower May 2025. The data here comes from UAH record of temperatures measured in the lower troposphere (TLT).
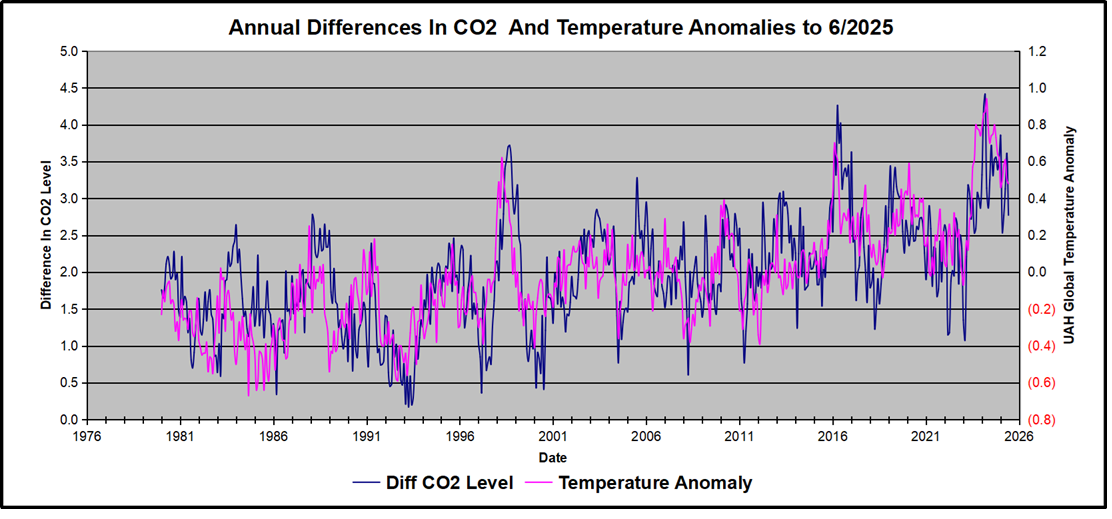
In this post, I test the premise that temperature changes are predictive of changes in atmospheric CO2 concentrations. The chart above shows the two monthly datasets: CO2 levels in blue reported at Mauna Loa, and Global temperature anomalies in purple reported by UAHv6.1, both through June 2025. Would such a sharp increase in temperature be reflected in rising CO2 levels, according to the successful mathematical forecasting model? Would CO2 levels decline as temperatures dropped following the peak?
The answer is yes: that temperature spike resulted in a corresponding CO2 spike as expected. And lower CO2 levels followed the temperature decline.
Above are UAH temperature anomalies compared to CO2 monthly changes year over year.
Changes in monthly CO2 synchronize with temperature fluctuations, which for UAH are anomalies referenced to the 1991-2020 period. CO2 differentials are calculated for the present month by subtracting the value for the same month in the previous year (for example February 2025 minus February 2024). Temp anomalies are calculated by comparing the present month with the baseline month. Note the recent CO2 upward spike and drop following the temperature spike and drop.
The final proof that CO2 follows temperature due to stimulation of natural CO2 reservoirs is demonstrated by the ability to calculate CO2 levels since 1979 with a simple mathematical formula:
For each subsequent year, the CO2 level for each month was generated
CO2 this month this year = a + b × Temp this month this year + CO2 this month last year
The values for a and b are constants applied to all monthly temps and are chosen to scale the forecasted CO2 level for comparison with the observed value. Here is the result of those calculations.
In the chart calculated CO2 levels correlate with observed CO2 levels at 0.9988 out of 1.0000. This mathematical generation of CO2 atmospheric levels is only possible if they are driven by temperature-dependent natural sources, and not by human emissions which are small in comparison, rise steadily and monotonically. For a more detailed look at the recent fluxes, here are the results since 2015, an ENSO neutral year.
For this recent period, the calculated CO2 values match well the annual highs, while some annual generated values of CO2 are slightly higher or lower than observed at other months of the year. Still the correlation for this period is 0.9939.
Key Point
Changes in CO2 follow changes in global temperatures on all time scales, from last month’s observations to ice core datasets spanning millennia. Since CO2 is the lagging variable, it cannot logically be the cause of temperature, the leading variable. It is folly to imagine that by reducing human emissions of CO2, we can change global temperatures, which are obviously driven by other factors.
Background Post Temperature Changes Cause CO2 Changes, Not the Reverse
This post is about proving that CO2 changes in response to temperature changes, not the other way around, as is often claimed. In order to do that we need two datasets: one for measurements of changes in atmospheric CO2 concentrations over time and one for estimates of Global Mean Temperature changes over time.
Climate science is unsettling because past data are not fixed, but change later on. I ran into this previously and now again in 2021 and 2022 when I set out to update an analysis done in 2014 by Jeremy Shiers (discussed in a previous post reprinted at the end). Jeremy provided a spreadsheet in his essay Murray Salby Showed CO2 Follows Temperature Now You Can Too posted in January 2014. I downloaded his spreadsheet intending to bring the analysis up to the present to see if the results hold up. The two sources of data were:
Uploading the CO2 dataset showed that many numbers had changed (why?).
The blue line shows annual observed differences in monthly values year over year, e.g. June 2020 minus June 2019 etc. The first 12 months (1979) provide the observed starting values from which differentials are calculated. The orange line shows those CO2 values changed slightly in the 2020 dataset vs. the 2014 dataset, on average +0.035 ppm. But there is no pattern or trend added, and deviations vary randomly between + and -. So last year I took the 2020 dataset to replace the older one for updating the analysis.
Now I find the NOAA dataset starting in 2021 has almost completely new values due to a method shift in February 2021, requiring a recalibration of all previous measurements. The new picture of ΔCO2 is graphed below.
The method shift is reported at a NOAA Global Monitoring Laboratory webpage, Carbon Dioxide (CO2) WMO Scale, with a justification for the difference between X2007 results and the new results from X2019 now in force. The orange line shows that the shift has resulted in higher values, especially early on and a general slightly increasing trend over time. However, these are small variations at the decimal level on values 340 and above. Further, the graph shows that yearly differentials month by month are virtually the same as before. Thus I redid the analysis with the new values.
Global Temperature Anomalies (ΔTemp)
The other time series was the record of global temperature anomalies according to RSS. The current RSS dataset is not at all the same as the past.
Here we see some seriously unsettling science at work. The purple line is RSS in 2014, and the blue is RSS as of 2020. Some further increases appear in the gold 2022 rss dataset. The red line shows alterations from the old to the new. There is a slight cooling of the data in the beginning years, then the three versions mostly match until 1997, when systematic warming enters the record. From 1997/5 to 2003/12 the average anomaly increases by 0.04C. After 2004/1 to 2012/8 the average increase is 0.15C. At the end from 2012/9 to 2013/12, the average anomaly was higher by 0.21. The 2022 version added slight warming over 2020 values.
RSS continues that accelerated warming to the present, but it cannot be trusted. And who knows what the numbers will be a few years down the line? As Dr. Ole Humlum said some years ago (regarding Gistemp): “It should however be noted, that a temperature record which keeps on changing the past hardly can qualify as being correct.”
Given the above manipulations, I went instead to the other satellite dataset UAH version 6. UAH has also made a shift by changing its baseline from 1981-2010 to 1991-2020. This resulted in systematically reducing the anomaly values, but did not alter the pattern of variation over time. For comparison, here are the two records with measurements through December 2023.
Comparing UAH temperature anomalies to NOAA CO2 changes.
Here are UAH temperature anomalies compared to CO2 monthly changes year over year.
Changes in monthly CO2 synchronize with temperature fluctuations, which for UAH are anomalies now referenced to the 1991-2020 period. As stated above, CO2 differentials are calculated for the present month by subtracting the value for the same month in the previous year (for example June 2022 minus June 2021). Temp anomalies are calculated by comparing the present month with the baseline month.
The final proof that CO2 follows temperature due to stimulation of natural CO2 reservoirs is demonstrated by the ability to calculate CO2 levels since 1979 with a simple mathematical formula:
For each subsequent year, the co2 level for each month was generated
CO2 this month this year = a + b × Temp this month this year + CO2 this month last year
Jeremy used Python to estimate a and b, but I used his spreadsheet to guess values that place for comparison the observed and calculated CO2 levels on top of each other.
In the chart calculated CO2 levels correlate with observed CO2 levels at 0.9986 out of 1.0000. This mathematical generation of CO2 atmospheric levels is only possible if they are driven by temperature-dependent natural sources, and not by human emissions which are small in comparison, rise steadily and monotonically.
Comment: UAH dataset reported a sharp warming spike starting mid year, with causes speculated but not proven. In any case, that surprising peak has not yet driven CO2 higher, though it might, but only if it persists despite the likely cooling already under way.
Previous Post: What Causes Rising Atmospheric CO2?
This post is prompted by a recent exchange with those reasserting the “consensus” view attributing all additional atmospheric CO2 to humans burning fossil fuels.
The IPCC doctrine which has long been promoted goes as follows. We have a number over here for monthly fossil fuel CO2 emissions, and a number over there for monthly atmospheric CO2. We don’t have good numbers for the rest of it-oceans, soils, biosphere–though rough estimates are orders of magnitude higher, dwarfing human CO2. So we ignore nature and assume it is always a sink, explaining the difference between the two numbers we do have. Easy peasy, science settled.
What about the fact that nature continues to absorb about half of human emissions, even while FF CO2 increased by 60% over the last 2 decades? What about the fact that in 2020 FF CO2 declined significantly with no discernable impact on rising atmospheric CO2?
These and other issues are raised by Murray Salby and others who conclude that it is not that simple, and the science is not settled. And so these dissenters must be cancelled lest the narrative be weakened.
The non-IPCC paradigm is that atmospheric CO2 levels are a function of two very different fluxes. FF CO2 changes rapidly and increases steadily, while Natural CO2 changes slowly over time, and fluctuates up and down from temperature changes. The implications are that human CO2 is a simple addition, while natural CO2 comes from the integral of previous fluctuations. Jeremy Shiers has a series of posts at his blog clarifying this paradigm. See Increasing CO2 Raises Global Temperature Or Does Increasing Temperature Raise CO2 Excerpts in italics with my bolds.
The following graph which shows the change in CO2 levels (rather than the levels directly) makes this much clearer.
Note the vertical scale refers to the first differential of the CO2 level not the level itself. The graph depicts that change rate in ppm per year.
There are big swings in the amount of CO2 emitted. Taking the mean as 1.6 ppmv/year (at a guess) there are +/- swings of around 1.2 nearly +/- 100%.
And, surprise surprise, the change in net emissions of CO2 is very strongly correlated with changes in global temperature.
This clearly indicates the net amount of CO2 emitted in any one year is directly linked to global mean temperature in that year.
For any given year the amount of CO2 in the atmosphere will be the sum of
all the net annual emissions of CO2
in all previous years.
For each year the net annual emission of CO2 is proportional to the annual global mean temperature.
This means the amount of CO2 in the atmosphere will be related to the sum of temperatures in previous years.
So CO2 levels are not directly related to the current temperature but the integral of temperature over previous years.
The following graph again shows observed levels of CO2 and global temperatures but also has calculated levels of CO2 based on sum of previous years temperatures (dotted blue line).
Summary:
The massive fluxes from natural sources dominate the flow of CO2 through the atmosphere. Human CO2 from burning fossil fuels is around 4% of the annual addition from all sources. Even if rising CO2 could cause rising temperatures (no evidence, only claims), reducing our emissions would have little impact.


You must be logged in to post a comment.