Global warming, climate change, all these things are just a dream come true for politicians. I deal with evidence and not with frightening computer models because the seeker after truth does not put his faith in any consensus. The road to the truth is long and hard, but this is the road we must follow. People who describe the unprecedented comfort and ease of modern life as a climate disaster, in my opinion have no idea what a real problem is.
First published JoNova; Even in green energy subsidised Britain, developing renewables does not make economic sense.
Why wind farm developers are pulling out at the last minute
Published: June 10, 2025 2.41am AEST Thomas York Postgraduate Researcher in Human Geography, University of Leicester
…
The government aims to generate at least 43GW of offshore wind power (current capacity is 14.7GW) and 95% of all energy from renewable sources by 2030.
These targets are now in jeopardy. The cancellation of Hornsea 4 follows a similar decision by Swedish developer Vattenfall, which stopped work on its 1.4GW Norfolk Boreas wind farm in 2023.
…
Building a wind turbine requires significant amounts of steel, copper and aluminium, all of which doubled or tripled in price between 2020 and 2023. Turbine manufacturers have raised prices in an effort to recover recent losses. This affects the profitability forecasts of wind energy developers like Ørsted and the viability of each of their projects.
…
Rising costs mean that even one of the world’s biggest wind farms, Dogger Bank in the North Sea, will not be profitable for its developer, Equinor. As a prospect for generating financial returns, renewable energy still cannot compete with oil and gas.
This is the key argument of economic geographer Brett Christophers in his recent book The Price is Wrong. Christophers argues that, if national governments continue to rely so heavily on private sector investment to build renewable energy, decarbonisation is unlikely to proceed as fast as it needs to. It is simply not profitable enough.
The call for government funding magic sauce to fix the economic failures of green energy is hilarious. Government funding can’t fix a failure of this magnitude.
And the problem Thomas York is discussing is just the cost of the renewable generators and grid connections. When you factor in the cost of the days or weeks of battery backup which would be required to absorb overcapacity on good days, and feed the grid during prolonged wind droughts, there aren’t enough government printing presses in the world to produce that kind of money.
Wind outages can last more than a week. Britain went nine days without wind power in 2018;
Wind outages can stretch across vast geographical areas, for example the entire continent of Australia was without wind last year – and not for the first time.
But arguably only one of the submitted plans – the UK’s – is compatible with the Paris Agreement.
…
Our report shows that human-caused global warming reached 1.36°C in 2024. This boosted average global temperatures (a combination of human-induced warming and natural variability in the climate system) to 1.52°C. In other words, the world has already reached the level where it has warmed so much that it cannot avoid significant impacts from climate change. There is no doubt we are in dangerous waters.
…
Just five of the G20 countries have submitted their 2035 plans: Canada, Brazil, Japan, the United States and the United Kingdom. But the G20 is responsible for around 80% of global emissions. This means that South Africa’s current G20 presidency can help to ensure that the world prioritises efforts to help developing countries finance their transition to a low-carbon economy.
Indicators of Global Climate Change 2024: annual update of key indicators of the state of the climate system and human influence
Piers M. Forster,Chris Smith,Tristram Walsh,William F. Lamb,Robin Lamboll,Christophe Cassou,Mathias Hauser,Zeke Hausfather,June-Yi Lee,Matthew D. Palmer,Karina von Schuckmann,Aimée B. A. Slangen,Sophie Szopa,Blair Trewin,Jeongeun Yun,Nathan P. Gillett,Stuart Jenkins,H. Damon Matthews,Krishnan Raghavan,Aurélien Ribes,Joeri Rogelj,Debbie Rosen,Xuebin Zhang,Myles Allen,Lara Aleluia Reis,Robbie M. Andrew,Richard A. Betts,Alex Borger,Jiddu A. Broersma,Samantha N. Burgess,Lijing Cheng,Pierre Friedlingstein,Catia M. Domingues,Marco Gambarini,Thomas Gasser,Johannes Gütschow,Masayoshi Ishii,Christopher Kadow,John Kennedy,Rachel E. Killick,Paul B. Krummel,Aurélien Liné,Didier P. Monselesan,Colin Morice,Jens Mühle,Vaishali Naik,Glen P. Peters,Anna Pirani,Julia Pongratz,Jan C. Minx,Matthew Rigby,Robert Rohde,Abhishek Savita,Sonia I. Seneviratne,Peter Thorne,Christopher Wells,Luke M. Western,Guido R. van der Werf,Susan E. Wijffels,Valérie Masson-Delmotte,and Panmao Zhai
Abstract
In a rapidly changing climate, evidence-based decision-making benefits from up-to-date and timely information. Here we compile monitoring datasets (published at https://doi.org/10.5281/zenodo.15639576; Smith et al., 2025a) to produce updated estimates for key indicators of the state of the climate system: net emissions of greenhouse gases and short-lived climate forcers, greenhouse gas concentrations, radiative forcing, the Earth’s energy imbalance, surface temperature changes, warming attributed to human activities, the remaining carbon budget, and estimates of global temperature extremes. This year, we additionally include indicators for sea-level rise and land precipitation change. We follow methods as closely as possible to those used in the IPCC Sixth Assessment Report (AR6) Working Group One report.
The indicators show that human activities are increasing the Earth’s energy imbalance and driving faster sea-level rise compared to the AR6 assessment. For the 2015–2024 decade average, observed warming relative to 1850–1900 was 1.24 [1.11 to 1.35] °C, of which 1.22 [1.0 to 1.5] °C was human-induced. The 2024-observed best estimate of global surface temperature (1.52 °C) is well above the best estimate of human-caused warming (1.36 °C). However, the 2024 observed warming can still be regarded as a typical year, considering the human-induced warming level and the state of internal variability associated with the phase of El Niño and Atlantic variability. Human-induced warming has been increasing at a rate that is unprecedented in the instrumental record, reaching 0.27 [0.2–0.4] °C per decade over 2015–2024. This high rate of warming is caused by a combination of greenhouse gas emissions being at an all-time high of 53.6±5.2 Gt CO2e yr−1 over the last decade (2014–2023), as well as reductions in the strength of aerosol cooling. Despite this, there is evidence that the rate of increase in CO2 emissions over the last decade has slowed compared to the 2000s, and depending on societal choices, a continued series of these annual updates over the critical 2020s decade could track decreases or increases in the rate of the climatic changes presented here.
You have to delve into the study to find the 3 years reference;
…
The values in Table 8 are all greater than zero, implying that we have not yet emitted the amount of CO2 that would commit us to these levels of warming. However, including the uncertainty in ZEC (as in Table S8), non-CO2 emission and forcing uncertainty, and underrepresented Earth system feedbacks results in negative RCB estimates for limiting warming to low temperature limits with high likelihood. A negative RCB for a specific temperature limit would mean that the world is already committed to this amount of warming and that net negative emissions would therefore be required to return to the temperature limit after a period of overshoot. The assumption behind such a calculation is that we can treat the warming impact of positive and negative net emissions as approximately symmetric. While the claim of symmetry is likely valid for small emissions values, some model studies have shown that it holds less well for reversal of larger emissions (Canadell et al., 2021; Zickfeld et al., 2021; Vakilifard et al., 2022; Pelz et al., 2025). As such, larger exceedances of the RCB for a particular temperature target would decrease the likelihood that the temperature target could still be achieved by an equivalent amount of net negative emissions.
Note that the 50 % RCB estimate of 130 Gt CO2 would be exhausted in a little more than 3 years if global CO2 emissions remain at 2024 levels (42 Gt CO2 yr−1; see Table 1). This is not expected to correspond exactly to the time that 1.5 °C global warming level is reached due to uncertainty associated with committed warming from past CO2 emissions (the ZEC) as well as ongoing warming and cooling contributions from non-CO2 emissions. For comparison, our estimate of 2024 anthropogenic warming (1.36 °C) and the recent rate of increase (0.27 °C per decade) would suggest that continued emissions at current levels would cause human-induced global warming to reach 1.5 °C in approximately 5 years.
This deadline will no doubt join all the other 3 years or 5 years or 10 years to save the world nonsense deadlines which have come and gone. Even if we wanted to there is no plausible path to meaningfully reducing emissions in such a short timeframe.
The world has already touched 1.5C global warming, and nothing bad happened. This appears to have prompted some rather panicked spin, at least in some quarters, to downgrade 1.5C to more of a guideline than a climate emergency.
The most interesting part of the article for me was the reference to the US nationally determined contributions plan for 2035, which was submitted in December 2024 by the Biden administration. The Biden plan committed the USA to a 61-65% reduction in emissions compared to 2005.
That submission was effectively rendered null and void by President Trump’s withdrawal from the Paris Agreement. Perhaps in the UN bubble world the authors of the quoted article inhabit, the USA is still a full Paris Agreement partner. Or maybe they think President Trump is an anomaly, a brief pushback by conservative reactionaries before the inevitable return of business as usual.
Recently Michael Connolly presented the evidence contradicting assumptions built into GCMs (Global Climate Models). This post consists of the exhibits he used, and additional Connolly comments in italics from a similar talk this month to Doctors for Disaster Preparedness.
Michael Connolly:
I’m an engineer and a scientist. As an engineer, I use computer models to design and make things. As a scientist, I look at the data to see if my computer models are correct. So, what we did at the center for environmental research and earth sciences (CERES) is that we looked at the data from 20 million radio balloons.
We then asked, can we look at this data and see how we can use it to check the computer models? And we found there’s two types of balloons. One: the average weather balloon does about a 100 measurements as it goes up to the stratosphere. But the ones which measure ozone do a measurement about once every second. So, you have maybe four or 5,000 measurements on each sample. But all of the climate models, and by the way, nobody in the climate model community bothered to check the data to see if their models were correct, which I find very bizarre. But what all of the model community do is they divide the earth into a number of little boxes. So, on a horizontal scale the boxes are about 1,000 mi long and on a vertical scale they’re about less than a mile in height.
They then make a number of assumptions about how the air behaves within each of these boxes. So their first assumption is that the air in each box is in a state which we call thermodynamic equilibrium. which I’ll explain in a few minutes. So they assume that on a horizontal scale the air in a box is in equilibrium over a distance of a 1,000 miles. But on a vertical scale only in equilibrium for slightly less than a mile.
And they also assume that the different boxes are not in thermodynamic equilibrium with each other. Because if it turns out that the boxes are in thermodynamic equilibrium with each other, all of the assumptions of the climate models collapse because Einstein and his co-authors over a 100 years ago showed that if a system was in thermodynamic equilibrium, if you put in a greenhouse gas into that system, it would absorb more energy. But if it’s in thermodynamic equilibrium, it emits more energy. So, increasing the level of greenhouse gases will increase the rate of absorption but also increase the rate of emission. So, there’s no net change due to the radiation. So, if it turns out that the assumption that the different boxes aren’t in thermodynamic equilibrium is false, then the whole theory of man-made global warming collapses.
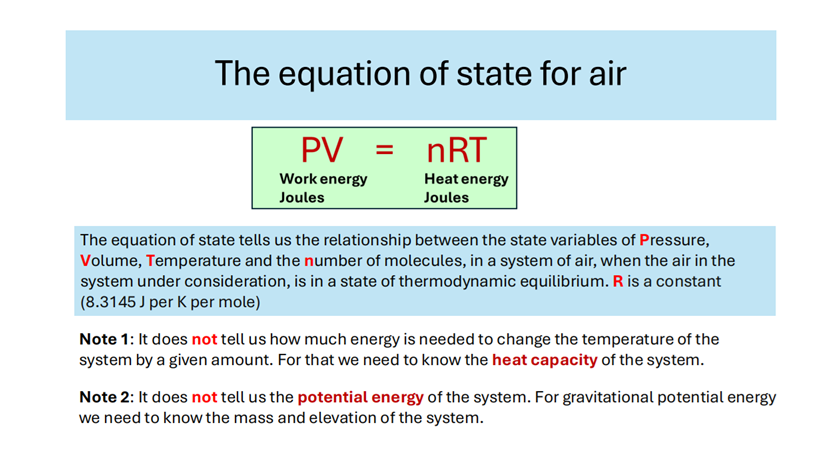
So how do we know if something is in thermodynamic equilibrium or not? Well, what you do is you take a system, and you do all the measurements of the different parameters involved and if you can describe the system in what’s called an equation of state with using these parameters, then we say the state is in thermodynamic equilibrium. So, in other words, obeying an equation of state is one side of the coin of being in thermodynamic equilibrium. They’re both different sides of the same coin.
So, for the air, the equation of state is this. It’s called the ideal gas law. And this is the equation that’s used by the climate modelers in treating the different boxes as being in thermodynamic equilibrium. You can see down there it tells you about the relationship between the different parameters, but it doesn’t tell you how much energy it would take to change the temperature of a system. For that you need to know the heat capacity of the system. And it doesn’t tell you anything about potential energy. In other words, if I take a cubic meter of air and lift it up and keep it at the same temperature and pressure, it would obey the same equation, but it would have gravitational potential energy because it takes energy to lift it up. That’s not reflected in the equation of state.
As a chemist I thought there was something dead obvious to do. The equation of state can be rewritten in a different form called the molar density form, and this form has been used by chemists for hundreds of years to determine the molecular weight of new gases. So, we asked what happens if we describe the atmosphere in terms of molar density form instead of the energy form? We were the first and still the only people to have done this.
When we did that we got a big surprise. We found that if you plot the molar density versus pressure you get these two straight lines. Now this means that the atmosphere in the troposphere, that’s the lower bit, is obeying an equation of state. So that means it’s in thermodynamic equilibrium. And when you get to the tropopause it turns into another straight line. Now this is quite common in studying materials. If you can describe it in terms of one equation of state and then it changes into another equation of state, we call it a change of phase. For example, you can describe water using the gaseous water using the gas laws, but then when it turns into liquid water, you have to use a different equation of state.
Now we studied all the different weather balloons from all around the world and we found that this phenomenon occurred in all of them. The only difference was that in the tropics the change of phase occurred at a higher altitude and in the Arctic and polar regions it occurred at a lower altitude. So, when we were here in Tucson 5 years ago, we made a video for the entire year of all of the radio balloon data for Tucson for 2018. And the reason for this video is that looking at a static graph like that, you don’t see any changes. Now, in the models that they’re using, the different boxes are isolated from each other, if you put energy into one of the boxes, it would kind of stay there. But if they’re in thermodynamic equilibrium, you put energy into one box, then all of the boxes will change because all of the energy will be distributed throughout the system. When you look at the video, the behavior of the boundary layer position moves up and down.
But also the temperature: if it moves to the right, the temperature is increasing. If it moves to the left, the temperature is decreasing. And what you will see once you watch the video, it’s all synchronized. In other words, if a change occurs, if the troposphere is warming up and the temperature is moving to the right, the tropopause moves down, the tropopause moves in the opposite direction. So in other words, when the troposphere heats up, the tropopause cools down. when the troposphere cools down the tropopause heats up and it does so in a synchronized way. So that synchronization shows that it’s thermodynamically connect connected. The idea that all of these boxes are not in thermodynamic equilibrium is contradicted by this data. [The referenced video starts at 10 minutes into the embedded presentation below.]
So that’s the first assumption. Now looking at the second assumption. Back in the day, 18th century or something, Hadley was looking to explain the trade winds. So he came up with this idea of what happens: The very hot temperatures landing on the equator heated up the atmosphere. here and this hot air then rose up. Then as it rose up it started to move towards the poles and as it moved towards the poles it cooled down and you got this circular phenomenon. They came up with three different types of circular cells: the Hadley cells; the Ferrel cells and the Polar cells. But all of these this theoretical stuff was based on ground measurements.
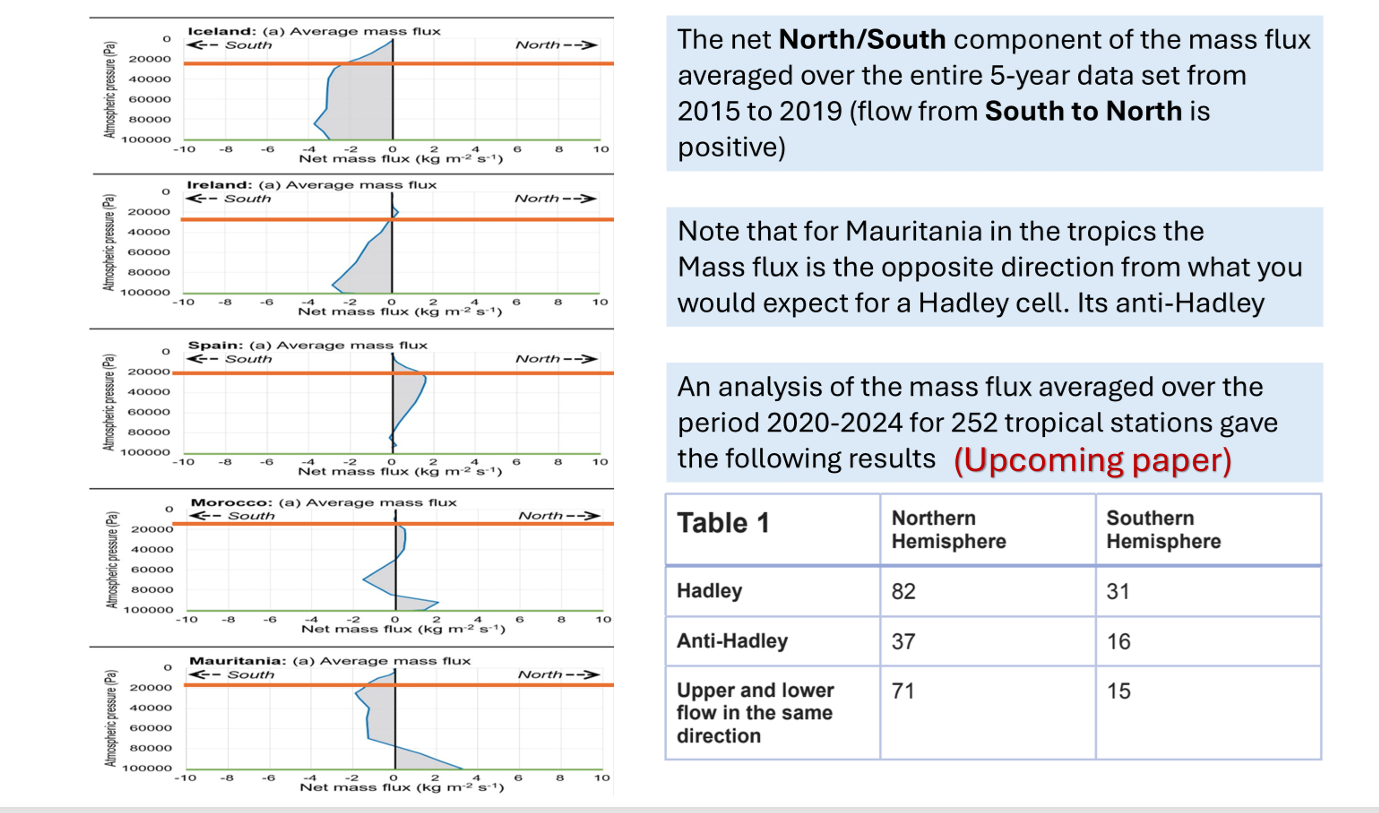
And again, uh nobody bothered to check whether this is true or not. So, I’ll just show how we checked it. But first of all, I just want to explain what’s meant by mass flux. So, if you take a square meter and you measure the air flowing through it and what weight of air that is the mass flux. So, in the weather balloons they give you the speed of the air and they give you the direction in which it’s going. So, you can use this to calculate the mass flux. So, we said fine. So can we use this to check the idea of the Hadley cells, and it turns out that you can. So, we did, and we published a paper two years ago.
We found first of all if you take a balloon and you launch it up through one of these cells then if Hadley is correct you would expect the hot air was rising here in the tropics and that drags in the air from the colder regions and then it hits the tropopause. Now, when Hadley came up with the idea, nobody knew the tropopause existed, and it’s only 30 years before I was born that it was actually discovered. So, that’s telling something about my age.
Anyway, if you send a balloon up through the atmosphere, you would expect the mass flux flow to flow in that direction down at the lower levels. And then as you go up at some stage it would shift over and start going in the opposite directions. So, since that was available that mass flux we could measure from the balloon data, we did that, and we got a surprise.
There was absolutely no circulation patterns at all. Instead what the atmosphere was doing. So if we point here you can see these ones are the lower ones. So you have the direction the north south direction of the mass flux. These are the ones at the lower half of the troposphere. These are the ones in the opposite half of the troposphere.
For a Hadley cell you would expect these ones to be flowing in the opposite direction to these ones. But instead, what we find is they all flow in the same direction. And in a very unusual pattern. What happens is here it’s flowing south then the atmosphere slows down over a couple of days goes back and forth and so on. So instead of this circular pattern what’s happening is the whole atmosphere is moving like a giant pendulum back and forth. So, we have the atmosphere going one way, then after a few days it turns around and comes back in the opposite direction. And this is for Iceland, but we found the exact same thing occurred for all the different stations.
So, in that published paper we took a station from each of the different five climate types and we found the exact same sort of thing happened. Now people said: okay so maybe it’s going back and forward on a daily basis but over a period of a year it might average out. So, we average the data over the five years for each of the stations.
And since we published that paper, we’ve analyzed over 250 of the weather stations in the tropics. And we found for these 82% of them are Hadley. 73 in the northern hemisphere. So, the majority are not Hadley cells. And in the southern hemisphere they’re equally balanced. But the problem with even the ones that were Hadley cells is you can see here the mass flux grow flowing in this direction the area under the curve is not the same as the one up above. And if it was a proper Hadley cell, they’d have to be the same. So, what we found is for none of them this worked out. So, they don’t exist, right?
The Aleutian Low – Beaufort Sea Anticyclone climate index or ALBSA is designed to compare the Aleutian Low Pressure and the Beaufort Sea High Pressure Centers. The intent is to relate air circulation patterns in the North Pacific and Arctic to climate and the timing of spring sea ice and snow melt.
The Aleutian Low – Beaufort Sea Anticyclone climate index or ALBSA is designed to compare the Aleutian Low Pressure and the Beaufort Sea High Pressure Centers. The intent is to relate air circulation patterns in the North Pacific and Arctic to climate and the timing of spring sea ice and snow melt.
Calculation method:
The ALBSA index is calculated using 4 points from the NCEP/NCAR Reanalysis Dataset: The following 850mb geopotential height points are used in the calculation:
N: 75° N, 170° W
S: 50° N, 170° W
E: 55° N, 150° W
W: 55° N, 200° W (160° E)
ALBSA = [E – W] – [N – S]
Use of the ALBSA index
Christopher Cox and his colleagues at NOAA developed ALBSA as an indicator of snowmelt timing in the Pacific Arctic on the North Slope of Alaska (Cox, et al., 2019). The timing is influenced by the marine air drawn (advected) to the Beaufort Sea Arctic region from the Aleutian low pressure region. When air is drawn from the Aleutians to the Beaufort Sea, it warms the area, and an early snow melt is observed on the North Slope of Alaska. The pattern illustrated in figure 1 is for 2002 when an early snowmelt was observed in May.
Figure 1. The air circulation pattern for May 2002, when the North Slope snow melted early. The four points used in the computation of the ALBSA index are identified, the data used for the calculation is from the NCEP-NCAR reanalysis dataset. The precise points used are identified in the text above. The contours are temperature (K) and the arrows are wind vectors at 850 mb (~1.5 km). The blue dot is Utqiaġvik and the red dot is Oliktok, both towns are in Alaska. The dashed brown line is the high-pressure ridge. Source: (Cox, et al., 2019).
Figure 1 illustrates the typical circulation pattern for years with early melting snow and ice. The air from the Aleutian low pressure region moves eastward and then trends northward through the Bering Strait to the Chukchi and Beaufort Seas. The average ALBSA 850 mb geopotential height (GPH) anomaly in May 2002 was about 69 meters and for the entire spring (March-June) it was 91.1 meters.
For comparison the same map is presented for 1988 as figure 2, when the snowmelt was late. In that year it did not start until June.
Figure 2. A map of the ALBSA Index in 1988, a late snowmelt year. Notice the circulation is not through the Bering Strait, but to Northern Canada. The blue arrow is the Beaufort Sea anticyclone (“BSA”), with easterly winds, it only appears in late years. These winds delay the melt. “AL” identifies the Aleutian Low Pressure region. Source: (Cox, et al., 2019).
The major characteristic of late years is the presence of the Beaufort Sea Anticyclone (BSA), this pushes cold Arctic air to the North Slope which delays melting. For the month of June, the ALBSA 850 mb geopotential height (GPH) anomaly was 7.9 meters and for the 1988 spring it was -90.3 meters. That is the North-South difference was much larger than the east-west difference in 850 mb geopotential height.
Like many other climate oscillations, the ALBSA index has been trending positive in recent decades. That means the Beaufort Sea Anticyclone has been weakening, causing a warmer North Slope. This is illustrated in figure 3.
Figure 3. Both the spring ALBSA (gray) and the 5-year smoothed spring ALBSA (orange) are plotted. The late snowmelt year 1988, and the early snowmelt year of 2002 are marked. In addition, the 1977 and 1997 PDO climate shifts from post 8 are marked.
As illustrated in figure 1, the 2002 spring had an early melt and no Beaufort Sea Anticyclone. In that year the May ALBSA anomaly was +68.9 m and the average spring ALBSA anomaly was +91.1 m, the melt occurred May 23. In 1988 the melt was very late, June 18, and the spring average ALBSA anomaly was -90.3 m. That spring had a strong Beaufort Sea anticyclone, which kept the North Slope of Alaska cold for a longer period.
The correlation between ALBSA and HadCRUT5 is poor, and the trends do not match. However, it does correlate decently with the NPI, which was discussed in post #8. NPI and ALBSA are compared in figure 4. They are not perfectly correlated but they both trend positively since the 1980s.
Figure 4. A comparison of the ALBSA spring 850-mb GPH anomaly, both one-year and five-year averages to the full-year and five year average NPI from post #8.
ALBSA correlates with snowmelt in Northern Alaska and the onset of sea ice melting in the adjacent seas. It also captures some of the variability in the NPI.
Discussion
The timing of snow and sea ice melting is important because the albedo of ice and snow is very high, whereas the albedo of meltwater is very low. This contrast makes a significant difference in the absorption of solar radiation and the resulting warming rate of the surface and lower troposphere as the sun re-enters the polar sky in the spring. Measurements of absorbed energy on the North Slope of Alaska have shown that early melts, for example May 13, 2016, can absorb 30% or more solar energy than late melts, for example June 18, 2017 (Cox C., et al., 2018). Further, as sea ice melts, it allows heat trapped under the ice to escape into the atmosphere.
AR6 does not mention ALBSA or the NPI or discuss if they are reproduced in the CMIP6 climate models. However, given that the models do not reproduce the NAO or AO (see post 9) or the Aleutian Low very well (AR6, page 1381) we assume that ALBSA is not reproduced well by the models. The PDO is discussed in AR6, and it is related to both the NPI and ALBSA. The PDO is very poorly reproduced in the CMIP6 climate models (AR6, page 427 & 503). AR6 often refers to the PDO as “PDV” and claims that since the CMIP6 models cannot duplicate it, it must be random internal variablity, even though the PDO oscillations are statistically significant (Mantua, et al., 1997) & (Ebbesmeyer, et al., 1990).
It is logical that ALBSA affects the pattern of Northern Hemisphere warming and cooling, but it does not correlate well with HadCRUT5. The next post will discuss the Oceanic Niño Index or ONI, which is used to define the El Niño and La Niña ENSO states.
Onshore renewable energy operator Dale Vince has collected over £145 million of state subsidies over the last 20 years, according to recent research compiled by David Turver from published accounts and government sources. But profits may be at risk, concludes Turver, with current subsidies running out and an aging wind fleet declining in performance. The subsidies of course are ultimately paid by British electricity consumers to promote the growth of wind power.
Onshore renewable energy operator Dale Vince has collected over £145 million of state subsidies over the last 20 years, according to recent research compiled by David Turver from published accounts and government sources. But profits may be at risk, concludes Turver, with current subsidies running out and an aging wind fleet declining in performance. The subsidies of course are ultimately paid by British electricity consumers to promote the growth of wind power. Vince has donated £5.4 million to the ruling Labour party in recent years and will no doubt be hoping that even more generous future state payments will be available, and the planning brakes on onshore wind farms are lifted.
The bulk of the subsidies for his Ecotricity operation come from the Renewable Obligations Certificates (ROC) scheme. This scheme was remarkably generous and until 2017 it handed out tradable financial certificates. Vince often states that his companies are subsidy-free but ROCs are essentially moolah for megawatts. The scheme is a transfer of wealth from consumers to producers via the State and over the last 20 years the entrepreneurial Vince has collected £115 million. Alas, the scheme only subsidises windmills for their first 20 years of operation, and in the latest financial period the ROC contribution fell from £9.15 million to £7.87 million.
Other benefits clearly visible include an “enduring derogation” from the Ofgem consumer energy price cap. Turver works out that Ecotricity is allowed to charge 11.8% more on its standard variable rate than its competitors. To be fair to Vince, he can charge higher prices due to his appeal to ‘green’, presumably well-heeled, customers. Turver does, however, note that the higher prices beg the question why Vince has to charge extra for his supply when he frequently states that wind energy is the cheapest energy source.
From 2014/15, Vince’s companies have earned a further £8.55 million in renewable credits, and since 2015/16 it has collected £21.5 million for administering the Feed-in-Tariff (FiT) scheme. The FiT scheme is no longer available, but it rewards home consumers for producing electricity. The FiT income would not exist without the FiT subsidies so technically, argues Turver, this is a subsidy. It brings the total of Ecotricity subsidy receipts to £145 million.
The ability to harvest subsidies and charge more than the energy price cap does not eliminate the risks of renewables. Borrowings of £80 million from banks and bondholders (Ecotricity customers get an extra 0.5 bond interest rate) are outstanding. As an entrepreneur there are the inevitable mishaps for Dale Vince. Problems with a scheme to turn grass into gas led to a recent £12.2 million write-off. In 2022, the Heckington Fen onshore wind farm was denied planning consent because of fears it would interfere with radar. Such concern appears to be growing with the Ministry of Defence recently forced to spend £1.5 billion to combat the ’Doppler’ effects of wind farms on vital military radar. Even with this amount of money spent, it’s not clear if there is a viable solution in sight. In addition, there’s political risk in the air with the Reform party leading in the UK polls and promising to save billions of pounds by scrapping what it calls Net Stupid Zero.
Interestingly, a plan for a 500MW solar farm at Heckington Fen was approved by the Labour Government earlier this year, but instead of developing it Vince has put it up for sale to achieve a quick profit. Money also came into the company last year from the sale of a 24.7% stake in the Good Energy Group. Turver observes that the CEO of Good Energy is Nigel Pocklington, who is the brother of Jeremy Pocklington, who is the Permanent Secretary of the Department of Energy Security and Net Zero (DESNZ). Juliet Davenport, founder of Good Energy, serves on the DESNZ Clean Power 2030 Advisory Commission. Good Energy was bought by a United Arab Emirates-based company earlier this year for £99.4 million, providing Ecotricity with £24.5 million.
Perhaps the biggest concern facing Vince and Ecotricity is the fall in wind output from the ROC-funded fleet from 159GWh in 2023/24 to 124GWh in 2024/25. Much of this was due to a farm being turned off for batteries to be installed, but the large wind farms at three sites all saw “significant drops” in output as measured by the number of RIOCs they were awarded. In considerable detail, Turver shows that older wind farms are losing efficiency and will run out of ROC payments in the near future. Most, if not all of them, seem to rely on the subsidies to remain profitable. Wind farms like Mablethorpe, Ecotech, Lowick Beacon (Swaffham), Blood Hull (Somerton) and East Kilbride will likely not be profitable says Turver, as output declines and the subsidies run out.
In Turver’s view, the performance of his companies falsifies Vince’s claim that wind power is the cheapest energy source. His companies struggle to be profitable with massive subsidies, even though he charges his customers more than the price cap. Nevertheless, it can be concluded that Vince is a skilled entrepreneur who was quick to grab the generous State cash designed to boost renewable energy over the last 20 years. Recently, he has built a large media and political presence and disseminates his views on climate catastrophe widely. His views are often controversial but his repeated calls for climate change “denial” to be criminalised is unlikely to dent his popularity with his target audience.
We have attempted to report fairly on David Turver’s work, much of which is based on published sources. However, if Dale Vince thinks we have misreported any figures or conclusions, he is welcome to reply to this article.
Chris Morrison is the Daily Sceptic’s Environment Editor. Follow him on X.
One day, and I hope it’s in the not-too-distant future, when we can finally rid ourselves of climate hysteria, historians will begin to grapple with the staggering cost this has inflicted on humanity. The sheer amount of time and money squandered on something we should simply adapt to—it’s likely astronomical. Not only that, but it has stymied true advancement by diverting funds away from far more worthy pursuits, creating an incalculable loss.
One day, and I hope it’s in the not-too-distant future, when we can finally rid ourselves of climate hysteria, historians will begin to grapple with the staggering cost this has inflicted on humanity. The sheer amount of time and money squandered on something we should simply adapt to—it’s likely astronomical. Not only that, but it has stymied true advancement by diverting funds away from far more worthy pursuits, creating an incalculable loss. The pain and aggravation it has caused, the needless loss of human life it has triggered—after all, if Russia lacked the money to wage war, they wouldn’t start one, nor would Iran. Were it not for the attempted overthrow of our way of life over the last four years, the momentum set in the previous four would have yielded massive dividends, instead of plunging us into a hole so deep that, no matter what President Trump does, it will take divine intervention to climb out.
But that’s not really the subject here. What the subject truly is, is how NOAA’s relentless emphasis on climate change has obscured the public’s awareness of just how exceptional the National Weather Service has become.
As the longest-running global forecaster in the private sector, I’ve always viewed the National Weather Service as a competitor. But my attitude has evolved into one of profound respect, admiration, and gratitude. Because I know I must add real value to my forecasts—they produce darn good ones that push me to elevate my own game. In the last decade, I’ve also sought involvement in public-private partnerships with the National Weather Service to exchange ideas. Though, because I speak my mind on certain issues, that’s probably not going to happen. However, I want readers of CFACT to understand that the weather and climate divisions of NOAA are two entirely distinct entities. NOAA’s constant push on climate change issues has robbed the National Weather Service of its due. Not only has it siphoned actual money that could have bolstered the Weather Service, but it has also prevented the general public from grasping how darn good they truly are. Now, I don’t think some of their models match the European model, for instance, but I could list endless tools I draw from NOAA’s weather branch—not copying forecasts, but leveraging their research, available maps, past weather reconstructions, and more. The list is endless. And yet, nobody in the general public knows about it.
Now, what I’m about to say won’t make me popular with those eager to slash government spending—and I haven’t scrutinized the recent cuts to the National Weather Service directly. But I want you to understand something: Why would I, as a competitor, want the National Weather Service to improve? Simple—for one, I’m not afraid of competition; for two, it raises my own level; and for three, they do darn good work as a safety net for the common defense. But many people don’t realize that, so when cuts happened recently—and rightfully so, overdue in climate-related excesses—other aspects should have been evaluated objectively by outsiders who know what’s valuable. For instance, I would have loved to weigh in on precisely what to cut in research and development. You wouldn’t gut R&D in defense, would you? No, because that could be suicidal for our country. Well, consider that normal weather variations, in a growing nation, will naturally cause more problems. So, aren’t we compelled to develop better tools to prepare? You can’t achieve that by haphazardly declaring, “Oh, we don’t need this or that.” In my opinion, there may have been a rush to judgment to impress the higher-ups, as you can’t wield a blunt instrument on something like this—instead, use a surgeon’s precision.
On the other hand, some of the shrill hysterics talking about how many lives this or that would cost, or using individual events, are simply the creatures that haunt the swamp that weather has become due to politics, and come out when it suits their purpose. And they do a disservice to the reality of looking at what actually should be scrutinized, and who knows, PERHAPS BEEFED UP..
But in the end, I blame it all on the phony climate war agenda. The constant drumbeat about how the climate is deteriorating so badly, this disaster and that calamity, needing more research to prove this and that about climate change blah blah blah—and what happens? Nobody recognizes the true treasure buried within parts of NOAA.
And by the way, this applies to NASA, too. In some ways, a Saturday Night Live skit from years ago, could have sounded alarm bells at NASA. It was a phony phone call from the president to the space shuttle crew, and nobody cared because it had become so routine. Well, no flight into space is ever routine—NASA is just so damn good that it almost always goes right. But when they dove into climate—naturally, given the money thrown at this phony climate war—guess what? Their main mission gets prostituted, a victim of all this hysteria. I’ve got an idea for NASA, or Elon, or whoever: Why not build transports to haul nuclear waste to the far reaches of the universe? How’s that for a mission? Kill two birds with one stone—for all you “CO2 will destroy the atmosphere” fans, nuclear power emits none. And if you could send that waste to the edge of the universe—unless you’re fretting about Klingon retaliation—it seems like an interesting plan.
So, in a way, this is a defense of the National Weather Service and its remarkable work and advancements. If you folks knew what I know and saw what I see, you’d understand. I’ll give you an example: If you’re an Alabama fan, no way do you want Auburn off your schedule. In fact, if you’re a true Alabama fan, you probably want Auburn to come in undefeated every year, so you can beat them. Or vice versa if you’re an Auburn fan. But you should appreciate the value, and the only way to do that is not to let it be prostituted by some phony issue that blinds you to something of true worth.
Think of it in terms of all the great people we have working in the FBI, not where their politically motivated superiors were misdirecting them too.
I know what the weather has done and can do. ( What would we do if the 1930s showed up again? can you imagine the hysteria for instance, if 2 major hurricanes hit the US within 18 hours of each other, with this crew of climate hysterics we have.. all of them not even knowing that happened)? A growing country needs to counter any attack on it that can hinder growth. If you look at it that way, and look at the National Weather Service as a vital part of the safety net, then the whole picture emerges. As for the emphasis on man-made climate change, goodbye and good riddance. If NOAA’s emphasis had been on the front-line forecasting, it’s likely people would know more about what is going on and we would be even better. Maybe our flagship forecast models wouldn’t trail the Europeans as I showed in a previous blog.
But then again, that has always been the main motive of the climate campaign. Deception, distortion, and delusion. And the NWS may have suffered some collateral damage in that war.
Britain’s green energy industry has accused the Reform UK party of undermining the national interest by threatening to strip public subsidies for wind and solar projects if it comes to power.
…
Richard Tice, the deputy leader of the party founded by Nigel Farage, added that developers seeking a subsidy contract in the upcoming auction would “do so at your own risk” because the party would “seek to strike down all contracts” if it gained power.
“The political consensus that has sheltered your industry for nearly two decades is fracturing,” Tice said.
…
James Alexander, the chief executive of the UK Sustainable Investment and Finance Association, said: “This letter risks putting politics before prosperity by issuing threats to developers in one of the UK’s fastest-growing industries.
“Investors wholeheartedly recognise these long-term investment opportunities. It is a great shame that some politicians would rather attack the sector instead of seizing the huge potential that it offers.”
…
She [Jess Ralston] added that “ ripping up long-term policies and changing agreed contracts is likely to destroy the UK’s credibility as a solid place to invest” in clean energy, which would make the UK more exposed to spikes in imported gas prices.
Green investors running for the hills at the slightest hint of subsidy cancellation exposes the falsehood that renewables are competitive and affordable.
Of course, we already knew that – even Mad Miliband is throwing in the towel on a pure renewable Net Zero, at least until the magic happens.
Before you ask, while it is true the nuclear fusion economic revival programme was started by the Tories, it has been continued by the Starmer government.
As for Farage, I once had the privilege of a 20 minute one on one conversation with Nigel Farage at an event in London, many years ago. He is the same in person as he is on TV, one of the few senior politicians I’ve met who pass the pub test.


You must be logged in to post a comment.