Global warming, climate change, all these things are just a dream come true for politicians. I deal with evidence and not with frightening computer models because the seeker after truth does not put his faith in any consensus. The road to the truth is long and hard, but this is the road we must follow. People who describe the unprecedented comfort and ease of modern life as a climate disaster, in my opinion have no idea what a real problem is.
In August of 2017 America went crazy for the first coast-to-coast total solar eclipse on US soil since 1918 and it provided a great opportunity for scientists and all sky watchers.
This map shows the 20-year (2000-2020) “median cloud fraction” in the month of April at approximately 1:30 pm local time as measured from NASA’s Aqua satellite. The path of totality on April 8, 2024, is shown with red lines marking the northern and southern limits and a blue line up the center. Based on this climatological cloud cover map, Mexico and southern Texas offer the best prospects for a clear view of totality. Data courtesy: NASA.
* *
Overview
In August of 2017 America went crazy for the first coast-to-coast total solar eclipse on US soil since 1918 and it provided a great opportunity for scientists and all sky watchers. What was referred to as “The Great American Solar Eclipse” took place on August 21st, 2017 when the moon passed between the sun and earth. Total solar eclipses occur somewhere on Earth every year or so, but generally cast their shadows over oceans or remote land masses. If you missed the 2017 total solar eclipse or it turned out to be cloudy in your particular area then there will be another opportunity in just thirty days from this Friday on Monday, April 8th, 2024. This time the Moon’s dark shadow, about 115 miles wide, will cross Mexico, sweep northeast from Texas to Maine, and then darken the Canadian Maritimes.
Cities inside the totality path for the April 8th, 2024 total solar eclipse (Courtesy GreatAmericanEclipse.com)
Details
The next total solar eclipse visible on US soil will come on Monday, April 8th, 2024. This one will feature a duration of totality up to 4 minutes and 27 seconds which is almost double that of “The Great American Eclipse” of August 21, 2017. It is estimated that the 2017 total solar eclipse was witnessed by around 20 million people from Oregon to South Carolina and the next one is very likely to be viewed by many millions more. The prediction of “many millions more viewers” is quite safe considering the fact that there are 31 million people already living in the totality path which will extend in a southwest-to-northeast fashion from Texas to Maine.
The solar eclipse of April 8, 2024, will be total in a narrow path from Mexico to the Canadian Maritimes and partial to the northwest and southeast. Yellow curves indicate how much of the Sun is covered by the Moon outside the path of totality. The difference between a total solar eclipse and a partial one is literally the difference between night and day, so get yourself into the path of totality if you can. Courtesy GreatAmericanEclipse.com
In the US, totality will begin on April 8th, 2024 at 1:27 (CDT) in Texas and will end in Maine at 3:35 pm (EDT). The narrow path of totality—where the Moon covers the Sun completely, causing a total eclipse – runs through Mexico (from SinaloatoCoahuila), the US (from Texasto Maine), and Canada (from OntariotoNewfoundland). And if you happen to live in southern Illinois or southeastern Missouri then you will be lucky enough to be in the “totality zone” for the second time when including the 2017 celestial event. A partial eclipse will be visible across nearly all of North America, and a sliver of western Europe.
This animated GIF shows the Moon’s shadow arcing across the Pacific, then traversing North America, and ending at sunset not far from Spain. The longest duration will be near Torreon, Mexico at 4 minutes and 27 seconds. The inner black circle, the umbra, is where the shadow is complete — a total eclipse of the Sun. The outer shadow circle, the penumbra, shows the extent of the partial eclipse. The partial eclipse will be slight near the outer circle and deep near the path of totality.
During a total solar eclipse, the Moon blocks the Sun’s bright face — the photosphere — briefly revealing our star’s outer atmosphere: the shimmering corona, or “crown.” The corona is always there, but we usually can’t see it because the photosphere is about a million times brighter and drowns it out. When the Moon covers the Sun’s bright face, the corona is definitely the main attraction, and depending on location, the corona will be visible for up to 4 minutes 28 seconds.
These are the times and durations of the eclipse at several points inside the path of the total solar eclipse.
Made of rarefied gas heated to millions of degrees, with its atoms highly ionized (stripped of electrons), the corona gets sculpted into streamers and loops by the Sun’s powerful magnetic field and shines with a light seen nowhere else. Those who have witnessed it say it is hauntingly beautiful and one of the most awesome sights in all of nature. During those moments of totality, it is safe to look directly at the Sun, even through binoculars or a telescope. But whenever any part of the photosphere is uncovered, it is essential to view the Sun through a safe solar filter, that is, one that meets the transmission requirements of the ISO Spec 12312-2, sometimes labeled as: 12312-2:2015 which is an international safety standard. Such filters are widely available and are not too costly. Looking at the uneclipsed or partially eclipsed Sun through dark sunglasses or any other unapproved filter is a recipe for serious and potentially permanent eye injury (i.e., do not use regular sunglasses).
The moon covers the sun during a total solar eclipse in Piedra del Aguila, Argentina, Monday, Dec. 14, 2020. Credit for photo: AP (Natacha Pisarenko)
At the beginning and end of totality, the thin middle layer of the Sun’s atmosphere, the chromosphere, blazes in an arc of ruby red. The sky darkens to a deep twilight blue, with yellow, orange, and pink sunrise/sunset colors on the horizon in all directions. Bright stars and planets may become visible in the darkened sky and the air temperature will often drop noticeably. The dark sky even tricks nocturnal animals into thinking it’s nighttime and you may hear crickets chirping or see birds returning to their nests.
This map of the U.S. shows the totality path of the 2017 solar eclipse combined with the upcoming event in April 2024. Notice there is a small section of the nation that is lucky enough to experience this kind of celestial event in both cases.
Remember…when it comes to solar eclipses…99% is definitely not the same as 100%…getting inside the path of totality is critical as this is the only place the corona can be seen.
One final note… after 2024, the next total solar eclipse to be visible from the United States will be in 2044.
Anthony and Charles had a spectacular time in 2017 on an expedition to photograph the 2017 eclipse. The feature image at the top of this article was taken by Anthony.
Spinning climate data to fit a policy agenda undermines public faith in science.
Public trust in many mainstream publications continues to consistently decline. Part of the reason for this seems to be that media outlets cater more and more to the ideological tastes of specific groups, sacrificing their credibility to a wider audience in the process. I have criticized the New York Times, for example, for exaggerating the impacts of climate change, but this type of criticism may be in vain if they are covering climate exactly how their audience wants them to.
It is in a media environment like this, however, that we desperately need reputable sources of scientific information. Sources that will avoid the same temptation to cater to their audiences and prioritize dispassionate reporting of facts instead.
Nature magazine has a reputation as one of the most reliable sources of information on earth. Their publication has a section of peer-reviewed articles as well as softer sections dedicated to science news and the like. I have criticized the landscape surrounding high-impact peer-reviewed scientific studies published in places like Nature, but I won’t elaborate on that here. Here, I want to bring attention to Nature’s science news section. Sadly, this section now appears to be engaged in similar levels of spin on climate information as outlets like The New York Times.
Two recent articles serve to illustrate the point.
Surge in extreme forest fires fuels global emissions. Climate change and human activities have led to more frequent and intense forest blazes over the past two decades.
Climate change is also a health crisis—these graphics explain why…Rising temperatures increase the spread of infectious diseases, claim lives, and drive food insecurity.
Between these two news articles, we have four claims: one on wildfires, one on infectious disease, one on deaths, and one on food security. Let’s scrutinize each claim one by one. Are wildfires and their carbon emissions increasing?
The title and subtitle of the first article conveys the impression that global wildfire activity is increasing, which in turn increases CO2 emissions from wildfires. This idea is also communicated several times in the text of the article (emphasis added):
“Global forest fires emitted 33.9 billion tonnes of carbon dioxide between 2001 and 2022…Driving the emissions spike was the growing frequency of extreme forest-fire events.”
“Xu and her colleagues found that the growth in emissions had been mostly fuelled by an uptick in infernos on the edge of rainforests between latitudes of 5 and 20º S and in boreal forests above 45º N.”
“The increased numbers of forest fires was partially driven by the frequent heatwaves and droughts caused by climate change”
The article also goes on to raise the concern of a self-reinforcing feedback loop:“In turn, the CO2 emitted by forest fires contributes to global warming, creating a feedback loop between the two.”
There are, of course, many positive and negative feedback loops in the climate system (i.e., responses to warming that either amplify or counteract the initial warming). The relative sizes of these feedback loops are systematically documented in synthesis reports like those from the Intergovernmental Panel on Climate Change. According to the IPCC, the CO2 feedback associated with fires is very small relative to other feedbacks. To put it in perspective, it is only about three percent as large as the water vapor feedback (as the atmosphere warms, it can “hold” more water vapor, which is a greenhouse gas, that further enhances warming). Thus, a self-perpetuating cycle of warming leading to more fires and more CO2 emissions is not exactly at the top of our list of concerns.
Second, and more importantly, despite what is communicated in the article, global CO2 emissions from wildfires are not actually increasing!
The Nature article covers a recent non-peer-reviewed report by the Chinese Academy of Sciences that contains one figure on changes in wildfire CO2 emissions over time (with emissions separated by region):
This figure does not indicate an increase in global emissions over the study period (2001-2022).
Independently, the most well-known estimate of CO2 emissions from wildfires comes from the Copernicus Atmosphere Monitoring Service (CAMS), Global Fire Assimilation System (GFAS). This estimate shows a decrease in global wildfire carbon emissions over its record (dating back to 2003):
This reduction in carbon emissions is also in line with a long–term observed decrease in the annual amount of global land area burned by wildfires:
Since all these numbers seem to contradict what is communicated in the Nature article, I emailed the author to get some clarification. She told me that:
“Based on my interview with Xu Wenru, a co-author (of the Chinese Academy of Sciences report), extreme forest fires became more frequent over the past 22 years in areas prone to forest fires (on the edge of rainforests between 5 and 20º S and in boreal forests above 45º N), and their CO2 emissions increased rapidly.”
But this amounts to saying that CO2 emissions from wildfires are increasing…where CO2 emissions from wildfires are increasing. And it completely leaves out the important context that global CO2 emissions from wildfires are decreasing.
Another month, another load of unvetted climate exaggerations and misrepresentations that climate campaigners set bouncing about the media echo chamber.
Another month, another load of unvetted climate exaggerations and misrepresentations that climate campaigners set bouncing about the media echo chamber.
Fortunately, CFACT and our partners are on the job correcting the record.
Each month we work together to publish a scholarly climate “fact check” that debunks Green propaganda with verifiable data.
This month we remind readers about natural El Nino / La Nina cycles and the impact they have on our weather. It was warm during the 1998 El Nino, it is warm during this one, and it will be warm during the next one, whether we live in a free economy or not.
The media wants you to know that Dallas hit 93 degrees on February 26th, 2024. That’s a hot February day. Dallas also hit 93 degrees on February 25th, 1918. A touch of history adds valuable perspective, don’t you think?
The Washington Post is alarmed that recent Canadian wildfires kept on burning underground. They called it a “zombie fire.” We reproduced a newspaper ad about underground Canadian fires from 1988.
Nothing wrecks an alarming narrative like a touch of history.
Our February “Climate Fact Check” is chock full of facts like these and more.
Thanks to CFACT’s climate fact check partners the Competitive Enterprise Institute (CEI), the Heartland Institute, Energy & Environment Legal Institute, Committee for a Constructive Tomorrow (CFACT), the International Climate Science Coalition (ICSC), and Truth in Energy and Climate.
This PBS piece, hosted by John Yang, is unusual in that the guest on the program, Jonas Jägermeyr, a climate scientist from Columbia University and the NASA Goddard Institute for Space Studies, admitted that carbon dioxide is positively affecting plant growth.
PBS News Weekend claimed in a recent video, “How climate change is disrupting the global food supply,” that climate change will harm the global food supply in the future, but this unlikely. The claim is refuted by food production trends over recent decades of warming, and an understanding of agronomy.
This PBS piece, hosted by John Yang, is unusual in that the guest on the program, Jonas Jägermeyr, a climate scientist from Columbia University and the NASA Goddard Institute for Space Studies, admitted that carbon dioxide is positively affecting plant growth.
Jägermeyr told PBS that the three main drivers for crop production are temperature, precipitation, and the presence of atmospheric carbon dioxide. So far, so good. Where Jägermeyr’s argument falls apart is when he follows that statement up with the claim that recent warming creates “extreme events such as droughts, heat waves[…] hail, and flooding,” which impact agriculture negatively.
Available data do not show increases in any of those extreme weather categories. As Climate Realism has covered in greater detail before: although everyplace has drought periodically, there is no evidence droughts are getting worse or more becoming more frequent; heatwaves are not becoming more severe; hail has been decreasing in the United States at least since 2005. Even the Intergovernmental Panel on Climate Change does not claim that flooding is getting worse due to climate change.
He goes on to admit that carbon dioxide is needed and loved by crop plants, albeit to different degrees, but then makes the puzzling statement that corn or maize does not benefit greatly from additional CO2 fertilization, and is “really seeing the largest negative impact.”
Pulling up the data from the United Nations Food and Agriculture Organization on corn production and yield, it is unclear what negative impact Jägermeyr is referring to. Over the past three decades, which is supposed to be the most intense period of warming, corn production has steadily climbed worldwide.
Since just 1990, worldwide:
Corn production has increased by 140 percent;
Yield has increased by 54 percent. (see the figure, below)
Despite admitting that “climate change isn’t just a negative blanket of adverse impacts,” Jägermeyr gave himself cover from his climate science peers by saying “we want to be really careful because potential positive or potential gains are difficult to realize.” That’s clearly false. By contrast, it seems that negative trends fairly attributable to climate change are almost impossible to identify.
One particularly puzzling claim made during the PBS interview, was that accelerated plant growth due to CO2 fertilization will “dilute” the nutritional quality of crops, because “the protein content, micronutrients such as zinc and vitamins and iron, these components aren’t taken up, aren’t produced by the crop at the same pace they’re growing.” This, Jägermeyr says, raises concerns about global nutrition. This claim is not new, and it is just as lame as it has always been.
The argument relies on the assumption that all other metrics – fertilizer, soil mineral content, et cetera—will stay constant amid increased CO2 fertilization. So, although more crops are produced on the same amount of land, it is dividing the same quantity of available micronutrients between them. If this was a real unsolvable problem, greenhouse operators who grow tomatoes and other vegetables in CO2-enriched atmospheres, sometimes upwards of thousands of PPM, would be producing significantly less nutritious produce. They are not, so what is the secret? Adding enough nutrients back to the soil in the form of fertilizers.
There are other factors to consider as well, such as the variety of the crop being grown, because not all wheat species, for example, have the same nutritional value in the first place.
Jägermeyr told PBS that poorer countries have a harder time adapting or handling extreme weather events when they do happen, which is true, but that’s true whether or not climate change has a net-negative impact on weather.
All things considered, the modest warming and especially the increased carbon dioxide in our atmosphere has increased crop yields, a trend which should continue in the future. Fearmongering about diluted micronutrients and future scenarios have not presented themselves outside of computer models. Thus, hyping such as yet imaginary fears, as PBS does, is counterproductive at best. Shame on PBS for hyping alarming, unverified claims of climate harm, while downplaying the good news about crop production.
The energy implosion set in motion by New York’s Climate Leadership and Community Protection Act of 2019 (Climate Act) continues to unfold slowly. This week we have gotten a few more new data points.
The energy implosion set in motion by New York’s Climate Leadership and Community Protection Act of 2019 (Climate Act) continues to unfold slowly. This week we have gotten a few more new data points. If you can read between the lines of wild spinning by the Governor and her team of bureaucrats, you will find that the scope of offshore wind projects moving forward with accepted bids has decreased by about two-thirds, while the price has just jumped by over 30%.
First, some background. The Climate Act sets several unachievable and impossible targets, the first of which is 70% of electricity from “renewables” by 2030. How to get there? The bureaucrats in charge of meeting the targets have no idea what they are doing, but they have established as a first goal to have some 9,000 MW of offshore wind turbines (nameplate capacity) up and running by some point in the 2030s. Does that sound like a lot? Current average demand in New York State is about 17,000 MW per this NYISO 2023 Report (at page 26), meaning that New York consumes about 150,000 [G]Wh of electricity in a year. (17 x 8760 (hours in a year) = 148,920). 9,000 MW of offshore wind turbines operating at a 30% annual capacity factor will generate 23,652 [G]Wh in a year (9 x 8760 x 0.3 = 23,652). That’s less than a sixth of current consumption. And did I mention that they are also planning to increase demand by 50% or more by forcing the electrification of all automobiles and home heating and cooking? So the 9,000 MW of offshore wind turbines will provide maybe 10% of our electricity needs in the 2030s, at random and often useless times — and that’s assuming that the turbines actually get built.
Forging ahead with its nonsensical and unworkable plan, in 2018-20 New York conducted a series of solicitations for bids from offshore wind developers to put up turbines in various sites off the coast of Long Island. Those solicitations resulted in accepted bids for close to half of the 9,000 MW goal. The big projects were named Sunrise Wind, Beacon Wind, and Empire Wind 1 and 2. Here is a map of where the turbine farms are to be located:
As I reported in this post from October 5, 2023, the prices that the State agreed to pay the developers after the auction were $110.37 per MWh for Sunrise Wind, and $118.38 per MWh for Empire Wind 1.
But then in July 2023 essentially all the developers with accepted offshore wind development contracts backed out of the deals, and demanded price increases averaging about 50%. The Chair of the New York Public Service Commission, Rory Christian, reacted with outrage. My post of October 15, 2023 covered a report of Mr. Christian’s reaction that had appeared in the New York Times. Excerpt:
Mr. Christian added that the state’s ratepayers, who would have borne the cost, could not serve as an “unlimited piggy bank” for companies to tap. “We have a deal,” he said to the developers, calling on them to stand by the terms they agreed to.
Sure. Here was my reaction to Mr. Christian:
Well, Rory, I’ve got news for you: the developers aren’t going to honor the deal. You’re going to have to hold a new auction. And the prices that will be bid will be as high or higher than those just demanded by these developers.
And, as I predicted, they proceeded to hold a new auction. By January, there was word that new bids had been received, but there was no information as to bidders or prices or awards.
Governor Kathy Hochul today announced the State has conditionally awarded two offshore wind projects from its fourth offshore wind solicitation – a planned 810-megawatt project, Empire Wind 1, (developed by Equinor) and Sunrise Wind, a planned 924-megawatt project (developed by Orsted and Eversource). The competitively selected projects will create more than 800 near-term family-sustaining construction jobs and invest $2 billion in near-term enhanced economic development statewide, including developer-committed investments to support disadvantaged communities. The projects, totaling over 1,700 megawatts of clean energy, will be the largest power generation projects in New York State in over 35 years once they enter operation in 2026, and will continue progress towards achievement of the State’s Climate Leadership and Community Protection Act (Climate Act) goal to develop 9,000 megawatts of offshore wind energy by 2035.
Yes, it’s all happy talk about how great this is. Here’s some more:
“I promised to make New York a place for the renewable energy industry to do business, and we are delivering on that promise,” Governor Hochul said. “Offshore wind is foundational to our fight against climate change, and these awards demonstrate our national leadership to advance a zero-emissions electric grid at the best value to New Yorkers.”
And how about getting President Biden in on the credit:
“Today’s announcement is the latest step forward as President Biden continues to deliver historic progress on growing the American offshore wind industry, creating good-paying union jobs, and advancing our ambitious climate and clean energy goals,” said White House Deputy National Climate Advisor Mary Frances Repko.
Dare we ask how much is actually getting built and at what cost? If you can get past the introductory happy talk, you will finally come to this:
The weighted average all-in development cost of the awarded offshore wind projects over the life of the contracts is $150.15 per megawatt-hour which is on-par with the latest market prices.
And yet you will not find anywhere in this press release any mention of the prices of the previously accepted bids. But you read Manhattan Contrarian, so you know that the previously accepted prices were $110.37/MWh for Sunrise Wind and $118.38/MWh for Empire Wind 1. In other words, despite Mr. Christian’s outrage, the prices have gone up by in excess of 30%. And this is for only 1700 MW of capacity. Previously they had accepted bids for 4300 MW of capacity, and plans for 9000 MW. 1700 MW of offshore wind capacity operating at a 30% +/- capacity factor might provide 2% or so of New York’s electricity needs in the 2030s, and at mostly uselessly intermittent times. What’s happening with the rest of their big plans? No word here.
And what does the cost here mean for consumer utility bills? You can divide the $150/MWh by 1000 and quickly figure out that they are planning to pay $0.15 per kWh as a wholesale price for intermittent electricity at the source. Nothing is included in that for transmission upgrades, backup, or storage to make for a reliable 24/7/365 grid. By the time you add in those extra costs, as the percent of electricity from the wind turbines gets to around 50% it would be amazing if you could get electricity to the consumer for less than $0.50/kWh. And if the percentage of electricity from the wind turbines goes well above 50%, then all bets are off. $1.00/kWh? $2.00? Easily.
Meanwhile, the Energy Information Administration reports here in 2023 (page 6) that the “levelized cost” of electricity from a new combined cycle natural gas plant is under $50/MWh — for dispatchable power with no transmission upgrades, backup or storage needed. That translates into electricity to the consumer of well under $0.20/kWh.
Governor Hochul’s press release actually includes a line as to the costs to the consumer of the newly accepted offshore wind farm bids:
The average bill impact for customers over the life of these projects under these awards will be approximately two percent, or about $2.09 per month.
Talk about deceptive. They give no methodology or assumptions as to how they came up with the cost figure. But it is obvious that it includes just the cost of blending into the grid the new power from these particular turbines, and otherwise using existing transmission lines and existing fossil fuel plants for the backup role. There is no effort whatsoever here or anywhere else in New York’s propaganda to figure out how much it will cost the consumer for electricity when the grid has been converted to all renewables plus massive amounts of some kind of backup or storage that hasn’t even been invented yet.
Memo to Attorney General James: If you have any real interest in prosecuting people who lie about plans to supposedly achieve “net zero” carbon emissions, here is the worst offender of all right under your nose.
The Heartland Institute’s Donald Kendal, Jim Lakely, and Chris Talgo present episode 439 of the In The Tank Podcast. The electric vehicle industry can not catch a break. There have been a number of stories coming out highlighting the “sluggish” sales of electric vehicles over the past few months.
The Heartland Institute’s Donald Kendal, Jim Lakely, and Chris Talgo present episode 439 of the In The Tank Podcast. The electric vehicle industry can not catch a break. There have been a number of stories coming out highlighting the “sluggish” sales of electric vehicles over the past few months. But now, a recent study is challenging the very idea that electric cars are better for the environment. Additionally, a massive Tesla plant in Germany was apparently the target of ecoterrorism.
“These aforementioned groups and individuals are standing tall against the Climate Industrial Complex and Big Government Wind, Big Governmental Solar, Big Government Batteries, and the I-want-to-control-your-energy-life elitists. The real environmentalists speak from the grassroots, not from Washington, D.C.”
“These aforementioned groups and individuals are standing tall against the Climate Industrial Complex and Big Government Wind, Big Governmental Solar, Big Government Batteries, and the I-want-to-control-your-energy-life elitists. The real environmentalists speak from the grassroots, not from Washington, D.C.”
Dense energy is the most environmental, as pointed out by the late Peter Huber in Hard Green: Saving the Environment from the Environmentalists (New York: Basic Books, 1999):
The greenest fuels are the ones that contain the most energy per pound of material that must be mined, trucked, pumped, piped, and burnt. [In contrast], extracting comparable amounts of energy from the surface would entail truly monstrous environmental disruption….
The greenest possible strategy is to mine and to bury, to fly and to tunnel, to search high and low, where the life mostly isn’t, and so to leave the edge, the space in the middle, living and green.
Anderson in his article also fails to understand that the “Pro-fossil Fuel Think Tanks” are less pro-fossil fuels than they are pro-consumer, pro-taxpayer, pro-freedom, and pro-environment. The problem of massive industrial wind turbines and solar acreage is that consumers do not like them and they are bad neighbors as judged by real local grassroots environmentalists.
Back to the article. Dave Anderson provides the following list for real environmental applause:
The State Policy Network (SPN) announced on its website last month that it will focus on working with state lawmakers to prevent states from adopting wind and solar power in 2024.
SPN is the national organization that serves as the central hub of a network of affiliated think tanks located in all 50 states, and is funded by right-wing and corporate donors that include fossil fuel interests. The network also includes associate groups like the Donald Trump-aligned America First Policy Institute and multiple organizations backed by Charles Koch, such as Americans for Prosperity.
Koch is the billionaire CEO and chairman of Koch Industries, which operates in multiple sectors of the fossil fuel industry. His Stand Together Trust contributed $5 million in 2022 to SPN-affiliated think tanks and millions more to SPN associates like the American Legislative Exchange Council and Cato Institute, according to the Center for Media & Democracy.
The Energy and Policy Institute is publishing new research profiles of SPN and several affiliated think tanks involved in coast-to-coast efforts to block renewable energy projects. Highlights and links to the new profiles can be found below: State Policy Network: SPN has brought on Amy Oliver Cooke, a political consultant who previously worked for a SPN-affiliated think tank in Colorado that was funded by coal producers in Wyoming, to lead its Energy Policy Working Group.
Sponsors of SPN’s annual meeting in Chicago last year included the American Fuel & Petrochemical Manufacturers, Stand Together Trust, and the Koch-backed group Americans for Prosperity. Texas Public Policy Foundation (TPPF): TPPF, which received more than $3 million from Stand Together Trust and the Charles Koch Institute in 2021 and 2022, ran an online fundraising campaign last year that featured false claims about offshore wind farms “beaching whales” and aimed to raise $500,000.
Ten of the nineteen individuals listed on TPPF’s board of directors web page have direct financial connections to the fossil fuel industry. Caesar Rodney Institute (CRI): CRI is leading SPN’s national campaign against offshore wind power. The Delaware-based SPN affiliate received $162,500 from the du Pont family’s Longwood Foundation in 2022.
The Longwood Foundation’s president Thère du Pont is a director for the DuPont Company, which sells products used by coal and methane gas power plants, and the foundation’s chairman Charlie Copeland works for CRI. Ben du Pont chaired a $150-per-person fundraising dinner for CRI’s anti-offshore wind campaign in November.
Cascade Policy Institute: The Oregon-based SPN affiliate published a report, “Quantifying the Unreliability of Wind and Solar Power in the Northwest,” last year by Eric Fruits. Fruits is also a senior scholar for the International Center for Law & Economics, which received $500,000 in 2022 from Koch’s Stand Together Trust.
Other SPN affiliates and associate groups have also been ramping up efforts to block renewable energy The Buckeye Institute, an Ohio-based SPN affiliate, has made the Frasier Solar project and Knox County officials the latest targets of its campaign against Ohio’s Payment in Lieu of Taxes (PILOT) program.
PILOT payment arrangements provide renewable energy developers with tax certainty, while ensuring counties benefit from reliable revenue from wind and solar projects for local schools and services. Frasier Solar has faced opposition from Knox Smart Development, an anti-solar LLC that has connections to the gas industry and has used the Buckeye Institute’s flawed analysis in its efforts to derail the solar project.
The Buckeye Institute’s Board of Trustees includes Mark Jordan, the president of the gas exploration and production company Knox Energy. Jordan also serves on the board of the Kirkpatrick Jordan Foundation, which contributed $35,000 to $40,000 annually to the Buckeye Institute in recent years, according to IRS Form 990s.
The Center of the American Experiment, which received $250,000 from Koch’s Stand Together Trust in 2022, has run multiple anti-wind and anti-solar ad campaigns on Facebook. The Minnesota-based SPN affiliate also received $20,000 from Americans for Prosperity in 2021, when it published an anti-renewables report, “Not in Our Backyard,” by Robert Bryce, a leading purveyor of anti-renewable energy disinformation.
These aforementioned groups and individuals (and many more) are standing tall against the Climate Industrial Complex and Big Government Wind, Big Governmental Solar, Big Government Batteries, and the I-want-to-control-your-energy-life elitists. from the grassroots, not from Washington, D.C.
An electric car driver whose £80,000 Jaguar I-Pace “went rogue” on the M62 has told how he feared he would “kill an innocent person” as he swerved through traffic at speeds of up to 100mph.
Motorist thought he would ‘kill an innocent person’ after vehicle allegedly reached speeds of up to 100mph.
An electric car driver whose £80,000 Jaguar I-Pace “went rogue” on the M62 has told how he feared he would “kill an innocent person” as he swerved through traffic at speeds of up to 100mph. The Telegraph has the story.
Nathan Owen, 31, was overtaking another vehicle on the motorway on Wednesday when his 2019 model apparently malfunctioned forcing him to lose control of the vehicle for about 35 minutes.
A major police operation was scrambled to bring the car to a stop with officers forced to close a stretch of the motorway and ram the vehicle after forming a protective convoy.
Mr Owen, from Bolton, Greater Manchester, told MailOnline that he feared for his life during the ordeal which he likened to the Grand Theft Auto video game.
He claimed the car also malfunctioned in December, reaching speeds of up to 120mph, but that Jaguar had assured him it was safe after checking the car.
‘I pressed the brakes but nothing happened’
The latest incident happened as he was travelling home from his first day as a crisis support worker with children in Ormskirk, Liverpool, on Wednesday at 2.30pm.
“The car literally just started speeding up,” he told the MailOnline.
“The speed was going towards about 100mph in the high 90s, going to 100. I thought this was a bit wrong.
“It came up on the dashboard saying there was a battery malfunction in my car. I kept trying to press the brakes but nothing was happening. So the next thing I thought I should do was call 999 and tell them what was happening.”
At least eight vehicles from Merseyside Police and Greater Manchester Police were forced to escort him down the busy motorway.
Officers closed off two lanes of the four-lane motorway as they tried to bring the Jaguar to a stop.
A likely amplifying mechanism is Earth’s convection and atmospheric circulation system. This post examines that idea. It is yet another important idea that the IPCC and AR6 ignore and brush away as unimportant, vis-à-vis global warming.
In part 3 we discussed the relationship between changes in solar activity and climate changes. Exactly how solar changes affect climate is not understood. It isn’t the immediate change in radiation delivered to the Earth, since that is too small to have much of an effect. So, it must be how Earth’s climate system reacts to the changes. The observed impact of solar irradiance changes over the solar cycle on the climate is much larger than the change in delivered radiation can account for.[1] A likely amplifying mechanism is Earth’s convection and atmospheric circulation system. This post examines that idea. It is yet another important idea that the IPCC and AR6 ignore and brush away as unimportant, vis-à-vis global warming.
The emphasis the IPCC places on global average surface temperature and the use of the phrase “global warming” suggests that atmospheric and oceanic circulation of thermal energy are not important in discussions of global climate change. Theodore Shepherd argues that global climate is driven by thermodynamics, and only regional climate is driven by convection and atmospheric circulation.[2] He also admits that climate models are much less consistent in their predictions of precipitation than temperature, and that the difference is likely due to atmospheric circulation, which affects precipitation patterns more than temperature. Finally, he acknowledges that our understanding of atmospheric circulation is weak.
The IPCC makes much of the fact that the only way Earth gains thermal energy is through radiation that is absorbed by the atmosphere or the surface from outer space and the only way it loses energy is when radiation is emitted to outer space.[3] This is true, but the apparent corollary that movement of thermal energy from one place to another on Earth’s surface makes no difference in the overall energy imbalance, is not true. Convection and circulation largely control the residence time of the energy within the climate system.[4] When the average residence time is short, Earth cools, when the residence time is long, Earth warms.
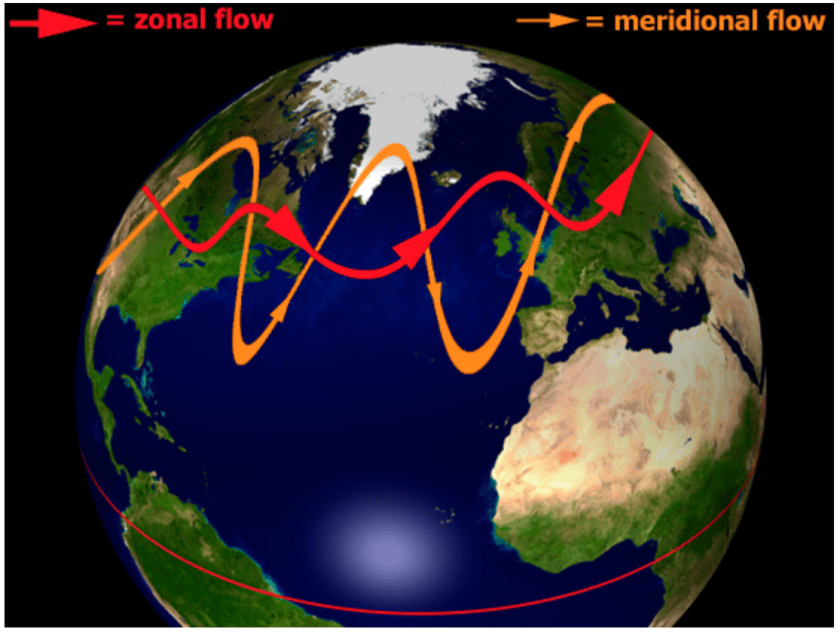
To demonstrate this, we need to examine six critical areas of climate and geological research. The first is the areal distribution of incoming and outgoing radiation around the globe and the distribution of net radiation flux (incoming-outgoing radiation). Next, we will examine energy transport from the tropics, where there is a surplus of thermal energy, to the polar regions which have a deficit, or net loss of thermal energy to space. This thermal energy transport is called the “meridional transport” of energy. When meridional transport is strong, Earth cools, and when it is weak Earth warms. Figure 1 illustrates strong meridional flow in orange and weak (or “zonal”) flow in red.
Thirdly, tropical temperatures do not vary much over geological time because over the oceans they are limited to less than 30°C by evaporation.[5] So-called “global warming” happens almost exclusively in the higher latitudes, not in the tropics. Fourth, we examine how the temperature difference between the equator and the poles forms a characteristic equator-to-pole temperature gradient. Fifth, the equator-to-pole temperature gradient today is relatively steep, suggesting the climate of today is unusually cold. Sixth, the temperature gradient powers meridional transport, the steeper it is, all else equal, the colder the Earth is.
Figure 1. Northern Hemisphere zonal flow (warming) in red and meridional flow (cooling) in orange. Source: (Keel, 2018).
While the temperature gradient powers meridional transport, meridional transport has many modulators, and the gradient is only one of them. It is unclear exactly how the temperature gradient and meridional transport interact, but clearly, they are the main drivers of global climate change at all time scales.[6]
In summary, discussing annual or monthly global average surface temperature as if it represents global climate change is very misleading. Earth’s climate does not behave that way. It circulates excess energy from warmer areas with a strong greenhouse effect to colder areas that have a weak greenhouse effect. Deserts and the polar regions have a weaker greenhouse effect due to their lower humidity (water vapor is the strongest greenhouse gas[7]) and can more easily send energy to space as a result. The speed of energy transport determines whether the world warms or cools. The world is not a static uniform object that simply receives energy from the Sun and evenly emits it back into space, with a minor delay caused by greenhouse gas emissions, which seems to be how the IPCC views and models our planet’s climate.
Areal distribution of energy
The tropics (roughly 30°N to 30°S) cover half of Earth’s surface. This is the region that contains the location where the Sun is directly overhead at noon. Half of the tropics, 25% of Earth’s surface, is in daylight at any given time, and this 25% of the surface receives 62% of the solar energy that strikes Earth. This, combined with a very large tropical greenhouse effect and a low albedo,[8] creates an enormous surplus of energy in the tropics.
Figure 2. Net thermal energy flux at the top of the atmosphere by latitude. Vertical axis is in W/m2, positive numbers mean more incoming energy than outgoing, and negative values are a net loss of energy to space. After: (Randall, 2015, p. 13)
Because more energy is received in the tropics than is emitted to space, the excess energy must be transported elsewhere. To make the situation even more complicated, Earth has an axial tilt relative to the plane of its orbit around the Sun. The effect of this tilt is illustrated in figure 2, where the Northern Hemisphere winter net energy flux[9] profile is shown as a heavy dashed line and the Northern Hemisphere summer profile is shown as a light dotted line. The yearly average is shown as a solid line. The X axis is the latitude, positive latitudes are north of the equator and negative are south.
Because Earth is closest to the Sun (perihelion) on January 4th, more total energy is delivered during the Northern Hemisphere winter. Figure 2 illustrates how complicated the task of regulating the surface temperature of Earth is. The point receiving the maximum energy input from the Sun is constantly moving. Besides this problem, the tropics have the strongest greenhouse effect in the lower troposphere as previously mentioned.
Meridional transport
In contrast to the tropics, the polar regions have the smallest greenhouse effect in the troposphere. This is especially true in the polar winter when the relative humidity is nearly zero due to the lack of sunlight and the low air temperature. This causes the air moving into the polar region to be warmer than the surface. The water under the polar ice is relatively warm (approximately -1.8°C) but it is insulated from the colder surface by ice. Thus, there is more radiant cooling to space from the polar air than from the surface because warmer bodies emit more radiation. In the dry polar regions, most radiation in the winter is from CO2, and adding more CO2 there means more radiation to space, which increases the rate of cooling, so we observe a reverse CO2-human-enhanced greenhouse effect during polar winters.
The transport of energy from the tropics to the poles (aka meridional transport) is very large, exceeding five petawatts,[10] as illustrated in figure 3. In figure 3 the northward energy flow is positive and southward energy flow is negative.
Figure 3. The poleward transport of energy by the oceans and the atmosphere. Positive values are northward and negative values are southward. From (Randall, 2015, p. 15).
Figure 3 is an average over the year, it conceals very large differences during the year due to storms, Earth’s axial tilt, and changes in meridional transport.[11]
Tropical temperature hardly varies
There is one more important point to make regarding surface temperature and incoming solar radiation. The tropical temperature is limited to about 30°C.[12] As the ocean surface approaches 30°C, very rapid evaporation occurs and “deep convection” commences that drives lower density humid air[13] very high (to an air pressure of about 200 hPa, or about 38,000 ft or 12 km) in the troposphere where it cools and forms clouds that shield the surface from the Sun.[14] This deep convection also causes downdrafts of cool, dry air that work to cool the ocean surface.[15]
The equator-to-pole temperature gradient
Because tropical temperatures are limited over the oceans and cannot exceed 30°C, the global energy balance forces global warming to occur at higher latitudes.[16] Thus, a temperature gradient is created from the tropics to the poles that drives meridional transport. Since tropical temperatures do not change much,[17] as the global average temperature decreases the temperature gradient increases in slope and as the average temperature increases, the gradient decreases. This is illustrated in figure 4, it is by Chris Scotese and colleagues.[18]
Figure 4 is based on a model created by making 100 maps of ancient Köppen[19] climatic belts around the world, each map represents the estimated paleoclimate of a five-million-year period, so the maps cover the past 500 million years. Scotese’s studies are significant for two reasons. First, the surface temperature ranges over the oceans and any significant body of water are limited, and since most of Earth’s surface is water, this limits the global average temperature, regardless of the greenhouse gas concentration in the atmosphere. Secondly, his work shows that the global average temperature today is unusually cold.
Today is unusually cold
Scotese’s work suggests that the “normal” surface temperature for the Earth over the past 500 million years is about 19-20 degrees, thus our surface temperature today is well below normal for Earth. Today’s average temperatures, by latitude, are marked in figure 4 with small plus signs. They tend to fall between 14- and 15-degrees global average temperature.
The last column in figure 4 is the percentage of the time each gradient shown exists in his maps. Over half the time (59%) in Earth’s recent history the global average temperature was between 19 and 20°C.
Figure 4. The equator-to-pole temperature gradients for various global average temperatures (GAT). The average equatorial temperature is 26°C and polar temperatures vary from 8° to 23°. Today’s temperatures are shown with small plus signs. The percent of the past 540 million years with each gradient is in the last column. The most common global average temperature is about 19 – 20°C, some 4-5° warmer than today.
The current climate is unusual in Earth’s history, but it is unusually cold, not unusually hot. Scotese’s work is very well accepted in the geological community, yet it is ignored by the IPCC who prefer to proclaim current warming is unprecedented. In fact, although Chris Scotese is famous for his work on paleoclimate in the geological community, a search for his name in AR6 WGI comes up with nothing. In fact, his name is not referenced in any of the AR6 volumes, although his findings are relevant to all three.
Summary
Atmospheric circulation and convection do play a role in global climate change since they affect the speed and efficiency of meridional heat transport, which helps determine the equator-to-pole temperature gradient and the residence time of thermal energy in the climate system. Some would have us believe that global average temperature is only a function of thermodynamics and the global climate can be characterized by this quantity. Yet circulation patterns are very important in regional precipitation patterns, which are very poorly understood, and poorly represented in climate models.
Characterizing the global climate using the best modeled quantity (global average temperature) is not very scientific. The focus of our work should be on what we do not understand. As Shepherd states:
“Every aspect of climate change in which there is strong confidence … is based on thermodynamics. Circulation, on the other hand, is … governed by dynamics. Therefore, the earlier dichotomy can be re-stated as saying there is relatively high confidence in the thermodynamic aspects of climate change, and relatively low confidence in the dynamic aspects.”[20]Shepherd, 2014
In other words, if we treat Earth as a static and uniform thermodynamic body, we understand it. If we look at it as a real, dynamic planet with a circulating atmosphere and ocean, we don’t. A rather obvious point, and a part of the climate system that the CMIP models do not model well. This is acknowledged, regarding regional precipitation, in AR6.[21]
In the next post, we will cover the sixth item in the list above, that the temperature gradient powers meridional transport. We will also cover the topic of storminess, that is extreme weather, is it increasing as the world gets warmer?
(Vinós, Climate of the Past, Present and Future, A Scientific Debate, 2nd Edition, 2022, p. 261), (Scotese, Song, Mills, & Meer, 2021), (Liang, Czaja, Graversen, & al., 2018), and (Barry, Craig, & Thuburn, 2002) ↑
(Wijngaarden & Happer, 2020) and (Pierrehumbert, 2011) ↑
The tropics are mostly covered by oceans and oceans absorb almost all incident solar radiation. Their albedo is small, meaning they reflect less energy than land or clouds. ↑
Net energy flux is just the incoming solar energy – the outgoing (to space) energy, averaged by latitude. ↑
A petawatt is 1015 Watts or a billion megawatts. ↑
A Köppen belt is a latitude band around the world that contains a set of diagnostic fossils and rocks that are characteristic of a climatic zone. For example, tropical rainforests have diagnostic fossils and rocks, as do deserts, temperate grasslands, and ice-covered polar regions. By dividing the world into diagnostic climatic zones, a pole-to-equator gradient can be constructed which can be translated into a global average temperature using Figure 4. See (Scotese, Song, Mills, & Meer, 2021) for more details. ↑
The only way out of the Malthusian catastrophe would be restraint of human nature, through “mutual coercion mutually agreed upon,” as Garrett Hardin put it. Tyranny
Garrett Hardin was a professor of biology and environmental studies at UC Santa Barbara. His “commons” was a metaphor drawn from the traditional English practice of shared grazing and agricultural land to which all members of a community had access. Commons were inherently prone to abuse, Hardin argued, because every user of the commons will exploit it to maximize personal benefit without regard to the other users, leading ultimately to the collapse of the commons as a useful resource.
Hardin extended the metaphor of the commons to include all natural resources, including the air, water, other species, even the entire Earth. The tragedy of Hardin’s expansive commons was the inexorable march to environmental doom, driven by the folly of human freedom. “No technical solution” could halt its march, no ingenious tinkering could fix the problem. Rather, Hardin asserted that the juggernaut could only be arrested through “mutual coercion, mutually agreed upon.” To save ourselves, we would have to give up many freedoms we take for granted, specifically “relinquishing the freedom to breed.”
Hardin’s “Tragedy of the Commons” is perhaps the most influential paper ever to come out of the field of ecology.
Within its six pages were sown the seeds that have grown into the vast industry that is modern environmentalism. If you’ve ever wondered how environmentalism got from simple concern for clean air and water and preservation of wilderness and its wonderful creatures, to Greta Thunberg, Extinction Rebellion and throwing soup at the Mona Lisa, it was Garrett Hardin who drew the map.
Hardin’s path to the tragedy of the commons was itself mapped out by the English economist and cleric, Thomas Malthus. When Thomas Carlyle famously cast economics as the “dismal science” — a “dreary, desolate… quite abject and distressing science” — it was Thomas Malthus he had in mind. Malthus’s economic philosophy was one of finitude and futility. Human populations always grew faster than could the food supply, he asserted, leading inexorably to famine, disease, perpetual poverty and war: the “Malthusian catastrophe.” Malthus’s economics stands in marked contrast to that of his near-contemporary Adam Smith’s more hopeful economics of free trade, free markets and the inscrutable “invisible hand” that would guide societies to prosperity and liberty. The history of economics has been a long contention between these two competing ideas.
Malthusian economics considered people to be aimless particles pushed this way and that by powerful and indifferent forces. People are considered to have no agencywhatsoever, or whatever agency they might have, encompass no other sentiment but selfishness.The only way out of the Malthusian catastrophe would be restraint of human nature, through “mutual coercion mutually agreed upon,” as Garrett Hardin put it. Tyranny
A big part of Malthus’s appeal at the time was his mathematical argument, which imparted a faux certainty to his claims. Charles Darwin and Alfred Russell Wallace both were inspired by Malthus’s mathematics, for example, however, Malthus’s mathematics were simplistic and naïve and failed to account for the fact that humans do, in fact, have individual agency — and that the range of moral sentiments was far wider than mere selfishness.
Nevertheless, Malthusianism continues to find devoted acolytes wherever simplistic and naive mathematical presumptions reign. Presently, it is climate change that fits that bill, and it is climate change where the Malthusian tragedy of the commons is again rearing its head — no, having its head propped up, Weekend at Bernie’s style — by a group of twenty-three scholars (they always seem to come in packs) in the prestigious pages of Proceedings of the National Academy of Sciences. There, they call for a “new paradigm” (that buzzword) to stave off the tragedy of the Anthropocene “planetary commons.”
Their new paradigm goes beyond mere governments managing common resources, like sea-floor mineral prospecting. Rather, they are advocating a more ambitious program to take control of the “biophysical systems” that impart resiliency to the Earth’s function. These systems include the atmosphere, hydrosphere (oceans, lakes, rivers and aquifers), the biosphere (encompassing all of the Earth’s biota), the lithosphere (all terrestrial ecosystems, and the cryosphere — ice and snow). Exerting such control, they say, will require “mobilization of efforts at an unprecedented scale, including future research” (read spending), which can only be done through a “nested Earth system governance approach.” This will mean “[adjusting] notions of state sovereignty and self-determination,” taking on “obligations and reciprocal support and compensation schemes … comprehensive stewardship obligations and mandates,” all with the aim to protect “Earth-regulating systems in a just and inclusive way.” You get the idea: “following the science” means a world government that subordinates those pesky notions of self-government and national sovereignty.
Doomsday scenarios are nothing new in the genre of “climate action.” Usually, such contributions bristle with weasel words such as “may,” “possibly,” “perhaps” and the ilk (e.g. the impending extinction of insects). Not so the planetary commons paper, which bristles with alarmist certitude. We are driving the Earth toward dangerous instability, rapidly pushing us past “tipping points” where the Earth will be plummeted irreversibly into disaster, making the Earth inhospitable to life itself. We are sinners in the hands of an angry goddess.
The whole thing is a house of cards, which a little digging will expose. Let’s begin with that word in the title: “Anthropocene.” What does it mean? It sounds science-y, but in fact “Anthropocene” is a neologism proposed in 2000 that demarcates the past 250 years from the Holocene, the geological epoch that began around 11,000 years ago, and which encompasses the rise of modern humans. It is no accident that the Holocene-Anthropocene boundary is set at 250 years before the present: it coincides with the beginning of the Industrial Revolution.
The Anthropocene is the stand-in for the eschatological End Times. Like the End-Times, it is defined by a basket of horrors and portents:
♦ An order-of-magnitude increase in erosion and sediment transport associated with urbanization and agriculture; ♦ marked and abrupt anthropogenic perturbations of the cycles of elements such as carbon, nitrogen, phosphorus and various metals together with new chemical compounds; ♦ environmental changes generated by these perturbations, including global warming, sea-level rise, ocean acidification and spreading oceanic “dead zones”; ♦ rapid changes in the biosphere both on land and in the sea, as a result of habitat loss, predation, explosion of domestic animal populations and species invasions; and ♦ the proliferation and global dispersion of many new “minerals” and “rocks” including concrete, fly ash and plastics, and the myriad “technofossils” produced from these and other materials.
No mention is made, of course, of the dramatic reductions of poverty, extensions of life spans, improved agricultural productivity, cleaner air and water, safer environments that also mark the Industrial Revolution. Those are Hardin’s “technical solutions,” to be dismissed as the false consciousness that merely delays the springing of the Malthusian trap. We best be wary.
The Anthropocene is not a scientific term: it is an entirely political construction. Being able to sell it as scientific has long been a coveted tool to advance the climate change agenda. This has meant a long march through the institutions that govern geological nomenclature. That effort came to fruition in 2019, at a meeting of the International Union of Geological Sciences in Cape Town, where a vote was taken to formally recognize the Anthropocene as a geological epoch. It passed by a supermajority of 88 percent in favor, which by the rules of the Society, closed off the matter from further debate. What was the actual vote? Thirty-three individuals voted to recognize the Anthropocene, and four dissented. Was this scientific consensus? Technically it was, but we keep in mind the deceptive power of percentages: the 2022 membership of the Geological Society of America totaled 18,096. Remember these figures the next time we hear about a scientific “consensus.”
With the Anthropocene established as a formal geological epoch, the door was opened for climate activists to advance a political agenda masquerading as “science.” The planetary commons paper, for example, asserts that we have already passed six of nine “tipping points,” putting us THIS CLOSE to catastrophe. That sounds dire, to be sure. But just what determines a tipping point, and how do we know we’re past it? One of the references cited in support of this claim is a paper (with many of the same authors as the planetary commons paper) which defines the “safe operating space” for the nine variables.
What determines the limits of the “safe operating space”? Why, it’s the presumed conditions prior to the Anthropocene!
The circle is thereby closed: the politically-defined Anthropocene is used to set the politically defined “safe operating space” for the Earth, which sets the course for “navigating” through the perilous Anthropocene. Follow the science! The agenda is clear: reverse the Industrial Revolution and return civilization to the illusory halcyon of the Holocene. This is the climate change echo chamber at work: a collection of mutually-reinforcing arbitrary presumptions dressed up in a science-y costume.
It would be amusing were it not for the costume being flashy enough to take in the mid-wit rubes that constitute our present-day ruling class. Danger lurks there, which was expressed eloquently 264 years ago by Adam Smith in his 1759 Theory of Moral Sentiments:
“The man of system, on the contrary, is apt to be very wise in his own conceit; and is often so enamored with the supposed beauty of his own ideal plan of government, that he cannot suffer the smallest deviation from any part of it… He seems to imagine that he can arrange the different members of a great society with as much ease as the hand arranges the different pieces upon a chess-board. He does not consider that the pieces upon the chess-board have no other principle of motion besides that which the hand impresses upon them; but that, in the great chess-board of human society, every single piece has a principle of motion of its own, altogether different from that which the legislature might choose to impress upon it. If those two principles coincide and act in the same direction, the game of human society will go on easily and harmoniously, and is very likely to be happy and successful. If they are opposite or different, the game will go on miserably, and the society must be at all times in the highest degree of disorder.
Garrett Hardin was, in his time, also a “man of system,” and it’s worth remembering that our last flirtation with the tragedy of the commons did not end well, especially not for Garrett Hardin himself, who now seems to be somewhat of an embarrassment to our present-day presumptive “persons of system.” We seem to have learned nothing since 1968, or for that matter, since 1759.
Will history repeat, this time as farce? Or will it be tragedy?




You must be logged in to post a comment.