Global warming, climate change, all these things are just a dream come true for politicians. I deal with evidence and not with frightening computer models because the seeker after truth does not put his faith in any consensus. The road to the truth is long and hard, but this is the road we must follow. People who describe the unprecedented comfort and ease of modern life as a climate disaster, in my opinion have no idea what a real problem is.
Since the late 19th century, with the work by Svante Arrhenius, climate models have been used to estimate the amount of global warming due to human greenhouse gas emissions.[1] Due to the complexity of Earth’s weather and climate, the connection between climate change/global warming and greenhouse gases cannot be observed or measured, it can only be estimated with a model.
Since the late 19th century, with the work by Svante Arrhenius, climate models have been used to estimate the amount of global warming due to human greenhouse gas emissions.[1] Due to the complexity of Earth’s weather and climate, the connection between climate change/global warming and greenhouse gases cannot be observed or measured, it can only be estimated with a model. Arrhenius constructed the first such model and speculated that temperature changed linearly with the logarithm of the CO2 concentration, specifically he estimated that as CO2 doubled in the atmosphere, surface temperature should increase 4°C.[2]
In part 1 of this series, I proposed a definition of a scientific model and described the types of models used by the IPCC in their various reports. We saw that as George Box famously said, “All models are wrong.”[3] He also said that all models reach a point where they cannot be improved, a point where (paraphrasing) attempts to refine them or make them more accurate amount to self-flagellation. We also saw that there are many examples where the sixth generation CMIP models fail to predict climate accurately. If you can’t get it right after six tries, you might have entered the realm of self-flagellation. Finally, part 1 lists the most common types of bias in the CMIP climate models and the IPCC reports.
Arrhenius’ estimate of the climate sensitivity to a doubling of CO2 of 4°C, falls within the IPCC AR6 estimate of the likely range of this value, which they abbreviate as “ECS” or the equilibrium climate sensitivity. The AR6 range is 2.5 to 4°C/2xCO2.[4] Thus according to the IPCC, Arrhenius’ estimate over 100 years ago is possibly still valid. Arrhenius concludes that the changes due to burning fossil fuels are a good thing, and writes:
“By the influence of the increasing percentage of carbonic acid [CO2] in the atmosphere, we may hope to enjoy ages with more equable and better climates, especially as regards the colder regions of the earth, ages when the earth will bring forth much more abundant crops than at present, for the benefit of rapidly propagating mankind.”[5]Arrhenius, 1908, page 63.
Arrhenius’ model was based upon laboratory measurements of the “permeability to heat”[6] of CO2 and water vapor. He tells us that the sources of additional CO2 are volcanos or human fossil fuel consumption and the main sinks for CO2 are the ocean, the weathering of rocks by carbonic acid, and growing plants.[7] Plants are more abundant and robust when the atmospheric CO2 concentration is high and less so when it is lower. He notes that all CO2 sinks increase in strength as the CO2 concentration increases.
Arrhenius’ conclusions were mostly accepted as the world warmed from 1908 to 1945, but when the world cooled from 1945 to 1976, while CO2 was still increasing, the hypothesis fell into disrepute. The pattern of global average surface temperature change, often used as the primary metric of “climate change” is illustrated in figure 1 using the HadCRUT4 global surface temperature anomaly dataset.[8] His ideas gained favor again after 1976 when the world began to warm again. The instrumental temperature record reveals that while CO2 concentration may have some influence on climate, as the Arrhenius and IPCC climate models attempt to show, it cannot be the entire story. It is instructive that both Arrhenius and the IPCC assume, in their models, that solar variability plays no role in recent warming and cooling. Both assume that volcanos do play a role, Arrhenius thought volcanos put more CO2 into the air and caused warming[9] and the IPCC assumes that volcanic aerosol emissions reflect more sunlight and have a cooling influence.[10]
In AR6, they feed recent observations of CO2 and temperature, paleoclimate CO2 and temperature proxies from the geological record, and modeled constraints on climate sensitivity into a subjective statistical model to compute a likely ECS range of 2.5 to 4°C/2xCO2.[11] This is a change from previous reports where general circulation climate models were used to compute the ECS. As they write in AR6:
“… despite decades of model development, increases in model resolution, and advances in parametrization schemes, there has been no systematic convergence in model estimates of ECS. In fact, the overall inter-model spread in ECS for CMIP6 is larger than for CMIP5; …”[12]AR6, WGI, page 1008.
While reading this quote from AR6, we need to remember Box’s cautions about “overelaboration and overparameterization.” It is also worrying that even after refining the IPCC/CMIP models for over 30 years, the spread in model results is not converging, it is increasing. This is a sign that the model premises[13] and/or design are flawed. It is also a clue that the conceptual IPCC model that human activities are controlling climate change,[14] has reached the end of its useful life.
Figure 1. The HadCRUT4 average global surface temperature anomaly from 1850 to 2020. Source: (Morice, Kennedy, Rayner, & Jones, 2012) and the HadCRUT4 website.
The likely lower limit of 2.5°C/2xCO2 was raised from the AR5 lower limit of 1.5°C/2xCO2.[15] However, their subjective statistical model is flawed and internally inconsistent with the confidence intervals of each input variable. When Nic Lewis redid their work using an objective statistical model, with improved and more recent data, he produced an ECS range of 1.75-2.7°C/2xCO2 (5-95%ile).[16] Like the IPCC, Lewis assumes that increasing CO2 has caused nearly all the warming since the 19th century. If that assumption is incorrect and there was some natural warming due to the Modern Solar Maximum[17] then even Lewis’ calculated ECS values are too high and are maximum, not likely values.[18] A large body of evidence for an ECS less than 2°C/2xCO2 exists,[19] which supports Lewis’ view that the AR6 subjectively modeled ECS is biased high.
AR6 does mention that observation-based studies exist that produce estimates of ECS below 2°C/2xCO2 but dismisses them because they believe that the feedback to increasing CO2 and warming increases with warming.[20] This concept of climate feedback changing as the world warms to increase the warming rate is a perfect example of Box’s “overelaboration.” They write that since observation-based estimates assume that the net feedback remains constant over the period being studied (usually 1870 to 2020), the estimates are incorrect. All the authors of the Clintel AR6 assessment dispute the idea that CO2 warming feedback changed significantly from 1870 to 2020.[21]
When a favored model, such as the IPCC model that CO2 is the “control knob”[22] for climate reaches its end, it is common to reach for any idea that can save it from extinction (overelaboration). However, the idea that CO2-caused warming feedback changes radically over geologically short periods of 150 years is a very desperate reach.
Laboratory measurements show that infrared active gases, like CO2, water vapor, and some hydrocarbon gases selectively absorb some of the infrared radiation emitted by Earth’s surface.[23] When they do this, the gas molecules become excited and vibrate faster for periods of a few milliseconds to a few tenths of a second and in this excited state, they collide more often with the gas molecules around them, warming them.[24] Then they emit the remainder of the radiation they absorbed. In the denser and more humid atmosphere near Earth’s surface, this has a warming effect because almost all the emitted surface radiation joins the neighborhood thermal energy pool.[25] The higher in the atmosphere the surface radiation is absorbed, the less energy is retained in the immediate neighborhood and the more energy is emitted by the greenhouse gases as radiation, some of which goes to outer space and escapes Earth’s climate system. The altitude where more of the radiation goes to space than to the surrounding air or back to the surface is traditionally called the “top of the atmosphere” or TOA.
Summary
In this part we examined the IPCC “conceptual model” or hypothesis that attributes modern warming to human influence through our land use and greenhouse gas emissions,[26] and the idea’s 100-year plus history. While adding greenhouse gases to the atmosphere probably causes some warming there are numerous studies that suggest some of the warming is natural and unrelated to human activities. The proportion of the warming that is due to human activities is unknown, but as we have seen in this post, it is very unlikely to be either zero or 100%, it falls in the middle somewhere, and may be small.
Modern general circulation climate models (called “Earth System Models” or “ESMs” in AR6) are all based upon the idea that most or all the warming in the past 150-170 years is due to human activities, with minimal impact from volcanism or solar activity changes. However, the models do not match observations in numerous critical areas.[27] As noted above, in some cases the CMIP6 models are worse than the previous generation CMIP5 models. Since these mismatches have persisted through six iterations of the models, it is reasonable to assume the flaw is in the assumptions, that it is in the hypothesis itself. In other words, it is likely the conceptual model should be scrapped, and a new one with different assumptions constructed.
In the next part we will examine the IPCC/CMIP assumption that changes in solar activity over the past 170 years have been too small to make any difference in Earth’s climate. In part 4 we will examine the assumption that changes in atmospheric and oceanic circulation make no net difference in the climate over time, since all these changes supposedly do not change the total thermal energy (heat) stored in the climate system, they just move it around.
(IPCC, 2021, p. 926 & 1007), (Sherwood, et al., 2020), and (Lewis, 2023) ↑
(IPCC, 2021, p. 1008), AR5 is the fifth major WGI IPCC report: (IPCC, 2013). CMIP5 are the models used in AR5. ↑
Model premises are all the assumptions and data used to build it. ↑
“Taken together with numerous formal attribution studies across an even broader range of indicators and theoretical understanding, this underpins the unequivocal attribution of observed warming of the atmosphere, ocean, and land to human influence.” AR6 WG1 TS, page 63. ↑
(McKitrick & Christy, A Test of the Tropical 200- to 300-hPa Warming Rate in Climate Models, Earth and Space Science, 2018), (McKitrick & Christy, 2020), (Lewis, 2023), (IPCC, 2021, p. 990) ↑
The United Nations’ Intergovernmental Panel on Climate Change (IPCC) published their latest assessment report (AR6) in 2021. In 2023, the Clintel Foundation published a report which criticizes AR6.
Clintel is short for Climate Intelligence, and the Clintel Foundation doesn’t think there’s a climate emergency. Overall, Clintel’s main criticism is that the IPCC hasn’t reviewed the scientific literature in an objective way, as is their stated mission.1)
This article focuses on the topic of chapter 2 of the Clintel report: The Resurrection of the Hockey Stick.
What is a “hockey stick” temperature graph?
The image below shows a “hockey stick” temperature graph for the past 1000 years. This particular version is from the Summary for Policymakers of the IPCC’s third assessment report from 2001, and it applies only to the Northern Hemisphere.
The graph is called a hockey stick graph because the shape somewhat resembles an ice hockey stick with a long, flat “shaft” and a big “blade” shooting up at the end. If there had been more variability in the temperature before the “blade” – meaning that the “shaft” wasn’t flat – then it wouldn’t be a hockey stick graph.
Short summary
A “hockey stick” temperature graph has made a comeback in the latest IPCC report from 2021 (AR6), after being absent in the fourth and fifth reports.
Unlike the previous two reports which included multiple temperature estimates, AR6 relies on just one temperature estimate for the past 1000-2000 years, sparking criticism.
Moreover, this single estimate has itself been criticized. The perhaps most important issue relates to a method that incorrectly generates hockey stick temperature graphs from non-hockey stick data.
In general, the quality and amount of data that can tell us something about past temperatures quickly decline when we go further back in time. Based on the currently available data, it might therefore be impossible to know whether the global temperature of the past 1000-2000 years has a hockey stick shape or not.
Why is the hockey stick important?
A hockey stick temperature graph is convincing evidence that human emissions of greenhouse gases have a big impact on the climate, and according to IPCC, humans are responsible for roughly 100% of all warming over the past 150 years.
For Clintel, who doesn’t think there’s a climate emergency, it would make their argumentation easier if past temperature variability were higher, as more of the recent warming could then be attributed to natural causes. They write that if past temperature variability has been high, then “the temperature rise of the past 170 years would have to be shared [between] anthropogenic and natural causes.” 2)
However, this way of thinking is a fundamental mistake, according to climate scientist Ulf Büntgen. He argues that a high pre-industrial variability would mean that the atmosphere is more sensitive to changes in e.g. greenhouse gases, than if pre-industrial temperature variability has been low.3)
In any case, what’s most important is, of course, to get a correct estimate (or “reconstruction”) of past temperatures — whose shape may or may not resemble a hockey stick. Let’s explore!
One of the big surprises of the IPCC’s AR6 report was the comeback of the so-called “hockey stick“. This term refers to the northern hemispheric and global temperature development of the past 1000-2000 years. More than two decades ago, Mann et al. (1999) published a reconstruction in which the temperatures of the pre-industrial period 1000-1850 AD appear rather flat and uneventful (the “shaft” of the ice hockey stick), followed by a fast and allegedly unprecedented warming since 1850 (the “blade”). The hockey stick became world famous because it was featured prominently in the Summary for Policymakers (SPM) in the IPCC’s 3rd Assessment report [see image at the top of this article].
The hockey stick graph received a fair amount of criticism, and Clintel explains that the hockey stick graph was subsequently corrected — resulting in a temperature reconstruction with more pre-industrial variability, and thus without a hockey stick shape. IPCC’s fourth and fifth assessment reports did not include a hockey stick temperature graph, but in the most recent assessment report (AR6), the IPCC once again presents a temperature reconstruction with low pre-industrial variability – a new hockey stick:
The new hockey stick temperature reconstruction is based on the work of PAGES 2k, the flagship of the PAGES (Past Global Changes) project. Clintel writes:
The PAGES 2k group is specialised in climate reconstructions and back in 2013 was comprised of the majority of all active paleoclimatologists. In 2019, PAGES 2k published a new version of the temperature development of the past 2000 years (PAGES 2k Consortium, 20194) [hereafter “PAGES 2k 2019”]). Surprisingly, it differed greatly from the predecessor version. Even though the database had only mildly changed, the pre-industrial part was now suddenly nearly flat again. The hockey stick was reborn[.]
And:
Evidence suggests that a significant part of the original PAGES 2k researchers could not technically support the new hockey stick and seem to have left the group in dispute.
It would be very interesting to read more about this. Unfortunately, Clintel doesn’t provide a reference.5) Anyway, Clintel continues:
Meanwhile, the dropouts published a competing temperature curve with significant pre-industrial temperature variability (Büntgen et al., 2020)[.] On the basis of thoroughly verified tree rings, the specialists were able to prove that summer temperatures had already reached today’s levels several times in the pre-industrial past. However, the work of Ulf Büntgen and colleagues was not included in the IPCC report[.]. [Emphasis added]
Did they really prove it? Probably not.
This is figure 4 from Büntgen et al. 2020, where they compare their own results with other temperature reconstructions covering the past 1000-2000 years, including PAGES 2k 2019. The PAGES 2k temperature reconstruction is the white line in the middle, the gray shading being the uncertainty range. Büntgen et al.’s results are the lines denoted EA and EA+. EA is Eurasia (above 30 degrees north), and EA+ additionally includes the North Atlantic region. The black line on the right side is thermometer data for June, July and August (JJA) in the 30-70 degrees north latitude band.
PAGES 2k 2019 is a global multi-proxy temperature reconstruction. Büntgen et al. 2020, on the other hand, applies only to the extra-tropical Northern Hemisphere, uses only one proxy-type – tree rings, and only looks at summer temperatures, not yearly temperatures. Still, it may actually make sense to compare Büntgen et al.’s reconstruction with PAGES 2k 2019, but that’s not immediately obvious, and a discussion of this by Clintel could have been beneficial.
What’s a multi-proxy temperature reconstruction?
In the previous paragraph, the term multi-proxy temperature reconstruction was used. A proxy — in this case a proxy for temperature — is an alternative to a direct temperature measurement with a thermometer. We’ve only had thermometers for a few hundred years, so we have no direct measurements of temperatures before that. To be able to estimate past global temperatures, scientists thus have to use less accurate alternatives instead of direct temperature measurements. These alternatives are called proxies. One proxy that can be used for temperature is tree ring width. Trees will typically grow more in a warm year than in a cold year, so for certain temperature sensitive trees, bigger tree rings could mean higher temperature.
A multi-proxy temperature reconstruction is an estimate of past temperatures that’s based on multiple proxy types. Tree ring width is typically one of several proxy types used in a multi-proxy temperature reconstruction.
The reason it may still make sense to compare Büntgen et al. 2020 and PAGES 2k 2019 is that PAGES 2k 2019 is also biased towards the Northern Hemisphere, towards summer temperatures, and towards the use of tree ring proxies:
PAGES 2k 2019 used 257 6) proxies out of a total of 692 proxies in the PAGES 2k database. 210 of these are high-resolution proxies with yearly resolution. In the below image, which is parts A, B and C from Figure 2 of Anchukaitis and Smerdon 2022, we can see A) that most of the proxies with yearly resolution are based on trees (tree rings), B) that the average latitude is not the equator, but 47 degrees north, and C) that most of the proxies capture summer temperature (the growing season for trees in the extra-tropical Northern Hemisphere), not yearly temperature.
Criticism of PAGES 2k 2019 and IPCC
Anchukaitis and Smerdon 2022, where the above image is taken from, is an article that reviews “the strengths and limitations of existing global and hemispheric paleoclimate temperature reconstructions and highlight[s] likely sources of [existing] uncertainties, all in the context of [IPCC AR6].” They’re quite critical of the IPCC’s new hockey stick graph.
One thing they criticize IPCC for, is that the IPCC did not consider a variety of multi-proxy temperature reconstructions, which they had done in their previous two assessment reports (AR4 and AR5):
Despite the attempts in AR4 and AR5 to reflect uncertainties across multiple reconstruction efforts and to represent time-dependent uncertainties as they expanded back in time, these efforts were surprisingly abandoned in the most recent AR6 Working Group I (WG1) report in favor of a single ensemble-based reconstruction of global temperature with relatively static uncertainty bounds over the [past 2000 years.] […] The most recent assessment […] is thus a turn away from the attempts in previous reports to provide a full accounting of uncertainty in reconstruction efforts […], an incomplete representation of forward progress in both understanding and quantifying disagreement in temperature reconstructions of the [past 2000 years], and is an unnecessary return to a singular representation of large-scale temperature estimates that span all or part of the last several millennia.
Another point made by Anchukaitis and Smerdon, which they also touched upon in the above quote, is that the uncertainty range in the new hockey stick graph is far too narrow, especially when we get further back in time:
[T]he estimated uncertainties for this reconstruction used in AR6 only reflect the methodological differences as applied to the PAGES2k dataset at decadal and longer time scales. Much larger latent uncertainties are almost certainly present due to the change through time in proxy availability, sensitivity, and spatial distribution[.] Because the consequences of these uncertainties are poorly represented in AR6, which is intended to reflect an assessment of the current state of the science, the report fell short in its representation of what we know and what we have learned about Common Era [=past 2000 years] temperatures over the last two decades. [Emphasis added]
Clintel, of course, also criticizes PAGES 2k 2019:
Like its predecessor, the new hockey stick by PAGES 2k 2019 is based on a large variety of proxy types and includes a large number of poorly documented tree ring data. In many cases, the tree rings‘ temperature sensitivity is uncertain. For example, both PAGES 2k Consortium (2013) and PAGES 2k Consortium (2019) used tree ring series from the French Maritime Alps, even though tree ring specialists had previously cautioned that they are too complex to be used as overall temperature proxies (Büntgen et al. 2012; Seim et al., 2012).
In contrast, Büntgen et al. (2020) were more selective, relied on one type of proxy (in this case tree rings) and validated every tree ring data set individually. Their temperature composite for the extra-tropical northern hemisphere differs greatly from the studies that use bulk tree ring input.
In some cases, PAGES 2k composites have erroneously included proxies that later turned out to reflect hydroclimate and not temperature. In other cases, outlier studies have been selected in which the proxies exhibit an anomalous evolution that cannot be reproduced in neighbouring sites (e.g. [Medieval Warm Period] data from Pyrenees and Alboran Sea in [PAGES 2k 2013]) (Lüning et al., 2019b). Outliers can have several reasons, e.g. a different local development, invalid or unstable temperature proxies, or sample contamination.
However, starting from the third sentence, this text is virtually copy-pasted from a study by Lüning and Lengsfeld (2022). Clintel could have at least added a reference to that study. Also, it’s unclear whether the last paragraph applies to PAGES 2k 2019 or just to earlier PAGES 2k versions. If it does indeed apply to the 2019 version, then the Clintel report would have benefited from documenting it.
A new temperature reconstruction that includes short-term trends
As noted, PAGES 2k 2019 is a multi-proxy temperature reconstruction (although it may be biased towards tree-rings), while Büntgen et al. 2020 only uses tree rings. All things equal, multi-proxy reconstructions should be preferred over single-proxy reconstructions; according to Büntgen et al. 2022, there is “community-wide agreement that multi-proxy compilations are the most appropriate methodology to climate reconstructions“.
One reason that multi-proxy reconstructions are better is that some proxy types can reveal short-term temperature variability, but not long-term variability, while others can reveal long-term variability, but not short-term variability.
And while “tree rings are excellent at capturing short frequency variability, they are not very good at capturing long-term variability.” (Fundamentals of Tree-Ring Research, James H. Speer, 2009) This is also pointed out by Büntgen et al. 2020 itself, the study that used tree-rings only:
[Tree ring width] is particularly limited when reconstructing the amplitude and duration of climatic extremes[.]
And:
While we have no doubt about the timing of past summer cooling in our reconstructions, accuracy of the temperature amplitude remains somewhat challenging.
Since some proxy types are good for capturing short-term trends, while others are good for capturing longer-term trends, the best way to make a temperature reconstruction should be to use proxy-types that capture long-term variability for the long-term trends, and then use e.g. tree rings to show the short-term variations on top of the long-term trends.
Titled “A frequency-optimised temperature record for the Holocene“, Helen Essell et al. 2023 is a study that combines short-term and long-term proxies in this way. It’s the first study that attempts to “present […] temperature variability on interannual timescales over the past 12 000 years.” Previous studies have had a much lower (worse) time resolution, and hence the temperature graphs from those studies have been smoother and with less variability.
However, while “interannual signals ([less than] 10 years) are best captured by tree-ring chronologies (wood)“, only 3 tree-ring proxies were included in the study. Unfortunately, the study doesn’t discuss uncertainties related to the low number of short-term proxies.
The study performs a global temperature reconstruction, but like most other “global” reconstructions, there is a bias towards the Northern Hemisphere and summer temperatures.
Also note that the study looks at the time period 12,000 – 0 BP, where BP means “before present” and “present” is defined as the year 1950. This is a longer time period than we normally talk about for hockey stick temperature graphs, which is 1000-2000 years. Hockey stick temperature graphs also normally include the time period after 1950, which is often represented by thermometer data in addition to proxy data. Helen Essell et al. 2023 does not use thermometer data.
Although the time period is different, it’s interesting to compare IPCC’s hockey stick graphs with the new temperature reconstruction from Helen Essell et al. 2023, which looks like this (where light green shows the uncertainty range):
If the results of this study are broadly correct, then pre-industrial temperature variability has been high, which would mean that hockey stick temperature graphs are not correct.
Since Helen Essell et al. 2023 is a new and novel study, it may or may not contain important errors, but their criticism of the IPCC is very relevant regardless; the IPCC should not compare long-term average temperatures with recent yearly (high) temperatures:
[W]e remain critical of the interpretation of the smooth trajectories of existing Holocene temperature reconstructions, which have influenced policy debate. For instance, the Sixth Assessment Report of the Intergovernmental Panel on Climate Change (IPCC), and its ‘Summary for Policy Makers’ and ‘Technical Summary’ compared recent annual extremes against past centennial averages. Such unequal comparison has the potential to mislead portrayal of the threat of global warming as low- and high-frequency records reflect different aspects and amplitudes of the Earth’s climate system. [References removed]
Stephen McIntyre
Stephen McIntyre is a central figure in the hockey stick controversies. McIntyre thinks (as does Clintel) that the IPCC wanted to get a hockey stick temperature graph: “the IPCC remains addicted to hockey sticks“, he wrote in a 2021 article on his blog, ClimateAudit, where he explains some of his major complaints about the new IPCC hockey stick.
So it’s safe to say that McIntyre is very knowledgeable when it comes to the proxies underlying the temperature reconstructions that have been published in the last few decades. And in 2019, McIntyre commented on Twitter that: “[…] I probably know the data better than the article lead authors[.]“
Asian tree ring chronologies: – It’s worse than anyone can imagine
What’s a tree ring chronology?
A tree ring chronology represents the year-to-year variations in tree growth within a geographical region. In a chronology for temperature sensitive trees, the variations in tree growth will roughly correspond to temperature variations. Scientists take samples from lots of temperature sensitive trees in a region, and you can think of the resulting chronology as an average of all those trees.
The most common tree ring proxy is tree ring width. There may be better tree ring proxies, but tree ring width is the one that’s easiest (cheapest) to measure.
Since the cross-section of the stem of a tree grows roughly the same amount each year, tree rings are typically wider for younger trees. For this reason, you can’t directly compare tree ring widths and say that, just because the tree ring was wider in a given year, that the temperature was also higher in that year. You have to first adjust for the age of the tree and potentially other factors. This adjustment is called standardization (or detrending), and it’s usually performed on data for each tree before the data from individual trees are combined into a chronology.
There are many problems with the chronologies included in PAGES 2k 2019. Here, I’ll just focus on the most important issue. But see footnote 7) for a summary of some other issues.
According to McIntyre, some of the tree ring chronologies included in PAGES 2k are incorrectly calculated:
It’s hard for a statistical methodology to be so bad as to be “wrong”. Mann’s principal components methodology was one seemingly unique example. PAGES2K’s Asian tree ring chronologies are another. It’s worse than anyone can imagine. [Emphasis added]
In a 2021 article, McIntyre writes about the Asian tree ring chronologies used by PAGES 2k. He writes that many chronologies were introduced without having been reviewed. The ones that made it into the latest PAGES 2k version were the ones that were the most hockey stick-shaped:
About 20% of the PAGES 2019 proxies are 50 Asian tree ring chronologies, all of which were originally published as chronologies in PAGES (2013). At the time, none of these series […] had ever been published in technical literature, peer reviewed or otherwise. Nothing in the Supplementary Information to any of these articles says who calculated these chronologies or how they were calculated. […]
PAGES (2013) was originally rejected by Science in 2012, because peer reviewers (including Michael Mann) objected to the introduction of so many new proxies in what was ostensibly a review paper; they sensibly recommended that components first be peer reviewed in relevant specialist journals. However, PAGES2K results had already been incorporated into a pending IPCC assessment (AR5), so the authors, now under a very short deadline, submitted to Nature, which was confronted by the same review problems that led to the rejection by Science. Keith Briffa had a clever, too clever, solution: publish the PAGES2K submission as a “Progress Article” – a classification that did not require the peer review procedure required for a Research Article. This would qualify the article for IPCC and nobody would notice the sleight-of-hand. (Even I didn’t notice it at the time; someone told me.)
One of the consequences of the 2013 manoeuvring was that several hundred Asian tree ring chronologies were introduced to paleoclimate archives with no technical publication or technical peer review, no information on how they were calculated or even who among the PAGES2K (2013) authors had calculated them.
Having been introduced through the back door, so to speak, nearly all of the 200+ Asian tree ring chronologies were carried forward into the PAGES (2017) compilation, and then a subset of 50 chronologies (more or less the most hockey stick shaped) was screened to become a substantial component of PAGES (2019) – the source of the IPCC Summary for Policy-makers Hockey Stick.
One of the new Asian tree ring chronologies is shown below. In addition to “Asia_207”, it also goes by the name “paki033” and “Asia-MUSPIG”:
The x-axis shows the year, and the y-axis shows ring width index, which corresponds to temperature in the region. The higher the ring width index, the higher the temperature. In an ideal world, at least.
Below are two chronologies that McIntyre calculated from the underlying tree ring widths using two normal standardization procedures (middle and right) compared with the PAGES 2k 2019 chronology (left):
As we can see, there is no hockey stick in the chronologies calculated using the standard procedures. And actually, temperature (or tree growth) seems to be going down rather than up in the 20th century, “so how did PAGES2K manage to get such a hockey stick? I have no idea“, wrote McIntyre in 2021.8) In 2023, however, Hampus Söderqvist (@detgodehab on Twitter/X) had been able to reverse engineer the algorithm used by PAGES 2k.
It turned out that the algorithm had a tendency to add upticks at the end — making hockey sticks from non-hockey stick data. This was verified by McIntyre and Söderqvist by cutting off the last 50 or 25 years of data before applying the algorithm. From Twitter:
bingo. Excluding the last 50 years of data, paki033 had an even bigger blade //50 years earlier//. For good measure, @detgodehab did test excluding 25 years and got same big blade //25 years earlier//.
@detgodehab has verified that same flawed algorithm was used for at least 8 other Pakistan sites. Note that these sites (together with Columbia U’s Mongolia chronologies) dominate PAGES19 list of heavy contributors to closing blade.
The problematic standardization procedure used by PAGES 2k is called signal-free detrending.9) As we’ve seen, tree rings aren’t very good at preserving long-term temperature trends, and the signal-free procedure was created with the intention to at least partly solve this problem — to preserve medium-term (up to one century) variability in tree ring temperature reconstructions.10)
Looking to the scientific literature, we actually find a criticism of this procedure that’s very similar to McIntyre and Söderqvist’s; Pearl et al. 2017 found that
the signal-free detrending procedure increased the amplitude of the early and late ring-widths beyond reasonable growth patterns for the species[.]
and that
the use of [signal-free standardization] instead of traditional [negative exponential] chronologies results in an overestimation of recent temperature trends and a lack of reconstruction skill. [Emphasis added]
An overestimation of recent temperatures was exactly what McIntyre and Söderqvist found could happen.
How much can we actually know about past temperatures?
In light of the big differences between global temperature reconstructions, one might wonder how much we can actually be certain of when it comes to past global temperatures. In a 2021 article, The future of paleoclimate, Jan Esper and Ulf Büntgen address this issue:
Our understanding of natural climate variability rapidly declines over the Common Era (CE) [Common Era=past 2000 years] as the pre-instrumental temperature amplitude differs substantially among large scale reconstructions. Highlighting such differences and emphasizing paleoclimatic findings is crucial for placing [human-caused] climate change in a long-term context. We argue that more proxy records are needed to accurately reconstruct first millennium CE temperature variability[.] [Emphasis added]
The number of proxies as well as the quality of these series declines back in time, so that only a few records are available during the early centuries of the [Common Era]. All of these issues, i.e. the limited resolution, reduced replication, and increased dating uncertainty, affect our ability to accurately assess past temperatures and cause a blurring of the climate record back in time. [References removed]
In their opinion, we can know very little about global temperature variability prior to the year 1400:
Yet the circumstance that the next IPCC report will no longer include a paleoclimate chapter should not mistakenly be interpreted as evidence that natural climate variability is understood. The opposite is actually the case. We are in the dark already before 1400 CE, have a rather limited idea of the magnitude […] of pre-industrial warm periods, and know much less about the Southern Hemisphere[.] [Emphasis added]
Conclusion
Whether the average global temperature of the past 2000 years forms a hockey stick pattern or not might not be possible to determine from existing proxy records. And there’s disagreement in the scientific literature about how much the pre-industrial global temperature has varied since year 0.
Although the IPCC knew about the disagreement, they still chose to rely on a single temperature reconstruction for the past 2000 years (PAGES 2k 2019) in their latest assessment report. That in itself is unfortunate, since they’re supposed to make an objective assessment of the scientific literature. It’s even more unfortunate considering all the criticism PAGES 2k 2019 has received.
Did the IPCC want to present a hockey stick temperature graph? The Clintel Foundation and McIntyre believe so, and I wouldn’t be surprised, either. But it’s hard to prove.
Footnotes:
1) An objective review is at least one of IPCC’s stated missions. On their About page, one of the things the IPCC writes is:
An open and transparent review by experts and governments around the world is an essential part of the IPCC process, to ensure an objective and complete assessment and to reflect a diverse range of views and expertise.
As a rule of thumb, the larger[…] the pre-industrial temperature changes, the higher[…] the natural contribution to the current warm period (CWP) will likely be, thus, reducing[…] the CO2 climate sensitivity and the expected warming until 2100.
There is one thing that often gets taken wrong if we are reconstructing past climate and we show more natural variability. Some people, they don’t understand it fully, they would say “ah okay, you are able to show us that [the] climate system was always varying, so where is the problem?” This is the wrong assumption, the assumption is that this only indicates that the climate system is very sensitive, so it’s about the sensitivity. That means even without [varying amounts of] greenhouse gases, we had these fluctuations; we had cold and warm periods. So that means the sensitivity of the [Earth] system is very high, which makes the effect of greenhouse gases even bigger, right? So I think it is exactly the counter-argument. If we are able to show that pre-industrial temperature and precipitation changes were relatively big, it only means that the additional effect of greenhouse gases will be even further a problem.
I haven’t found a discussion in the scientific literature comparing the opposing perspectives of Clintel and Büntgen.
5) But an article by Swedish blogger Maths Nilsson may lend some support to Clintel’s claim. Nilsson had asked climate scientist and fellow Swede, Fredrik Ljungqvist, whether a new hockey stick had been commissioned by the IPCC, something that the Clintel report suggested might have happened. According to Nilsson, Ljungqvist’s answer was a categorical no:
So I contacted Fredrik Charpentier Ljungqvist (FCL), co-author of both the Page[s] 2k (2019) and Büntgen (2020)-papers. What did he say?
First of all, the IPCC did NOT in any way commission the Page[s] 2k-study as Clintel implies ([Ljungqvist] used the capital letters).
Nilsson’s next paragraph then hints at a possible justification for Clintel’s claim that some researchers seem to have left PAGES 2k in dispute — at the very least, there seems to have been disagreement:
[Ljungqvist] did however confirm that some leading [paleoclimatologists] do not think the Page[s]2k graph was properly used in the IPCC AR6-report. They don’t think there is sufficient data to even reconstruct a global mean temperature with precision 2000 years back (most data comes from northern [hemisphere]). [Ljungqvist] somewhat regrets putting his name on the Page[s]2k-study. [Emphasis added]
6) Stephen McIntyre has made available a folder with two files. One file, proxy_pages2019.csv, shows an overview of all 257 chronologies (although only the tree ring chronologies were visible to me by default — I had to unhide the others). The other file, info_pages2019.xlsx, includes all yearly values (temperature, ring width index or similar) for all 257 chronologies.
7) Some of the other potential problems that McIntyre writes about:
The IPCC AR6 Hockeystick: “The idea/definition of a temperature “proxy”“, McIntyre writes, “is that it has some sort of linear or near-linear relationship to temperature“. He argues that this is not the case for the proxies underlying e.g. PAGES 2k 2019. To illustrate his point, McIntyre visualizes random samples of 11 proxies from each of PAGES 2k 2017, PAGES 2k 2019, and tree ring chronologies from North America (used by PAGES 2k 2019), and compares them with PAGES 2k 2019’s resulting hockey stick graph. A few proxy chronologies have a hockey stick shape, but in those cases, according to McIntyre, the hockey stick shape was the result of errors in calculating the chronology. One chronology looks like an upside-down hockey stick. McIntyre suspects PAGES 2k 2019 flips it over (!), which means it would contribute positively to the final hockey stick shape.
PAGES2019: 30-60S: PAGES 2k 2019 includes very few southern hemisphere proxies. In the 30-60 degrees south latitude band (southern extra-tropics), PAGES 2k has included only 8 proxies. Of the 8 proxies, 7 are tree rings, and none are ocean proxies despite 94% of the area being ocean. The 8 proxies had been reduced from 19 proxies in PAGES 2k 2017. Only one proxy goes back 2000 years, one goes back about 1200 years, and the rest are shorter than 600 years. The final PAGES 2k reconstruction has a much more pronounced hockey stick shape than any of the 8 proxies that it’s made up of.
PAGES19: 0-30S: PAGES 2k 2019 includes 46 proxies in the 0-30 degrees south latitude band (southern tropics). However, only 2 of them go back 2000 or nearly 2000 years. Among the rest, none of the proxies go back further than the year 1500 AD, and about half have a start date after 1850. McIntyre comments: “None of these short series shed any light on whether the medieval period, for example, was warmer than modern period or not.” 43 of the 46 proxies are coral proxies, and strangely, there are only two proxies from land.
There are two different coral temperature proxies, δ18O and Sr/Ca. δ18O looks at the ratio of two different oxygen isotopes in the coral, the common 16O and the much less common 18O. The Sr/Ca proxy looks at the ratio of two different chemical elements in the coral, Strontium (Sr) and Calcium (Ca). According to McIntyre, “PAGES2K is primarily populated with d18O series – which, in specialist articles, are seldom, if ever, used as temperature proxies, as Sr/Ca is usually preferred. Changes in 20th century coral d18O are nearly always much more pronounced than corresponding changes in coral Sr/Ca. Perhaps that’s why they were selectively chosen into the PAGES2K network.” A little speculation at the end there, but from having read many of McIntyre’s articles, the speculation is certainly very understandable.
PAGES 2019: 0-30N Proxies: PAGES 2k 2019 includes 41 proxies in the 0-30 degrees north latitude band (northern tropics), which is down from 125 proxies in PAGES 2k 2017. The removed proxies were mostly ocean sediments and tree rings, “all of which were much longer than the retained coral proxies“. Among the 41 remaining proxies in PAGES 2k 2019, only one extends back 2000 years, while two others go back around 1000 years. 8 of the proxies are from tree rings, two of which had upticks at the end. However, the upticks didn’t appear when standardizing the raw data using normal detrending-algorithms. “In response to a recent inquiry, the PAGES2019 authors were unable to identify how the chronology was calculated and refused to find out.” Presumably, they were calculated using the same flawed algorithm that was used for the Asian tree ring chronologies discussed in the main text (the signal-free procedure).
8) The reason McIntyre didn’t know was that PAGES 2k hadn’t documented which standardization (or detrending) method was used to create each tree ring chronology. I already quoted McIntyre saying this (“Nothing in the Supplementary Information to any of these articles says who calculated these chronologies or how they were calculated“), and Klippel et al. 2020 confirms it:
[T]he PAGES2k database contains no information regarding the detrending method used to produce the tree-ring chronologies in its collection[.]
9) Here’s a technical explanation from McPartland et al. 2020 for why the algorithm is called signal-free:
The term “signal-free” refers to the creation of detrending curves that do not contain the common signals shared across the trees in a chronology, and are thus ‘free’ from common variance and should preserve this signal in the resulting chronology.
In its original formulation, [signal-free standardization] was primarily intended to improve the expression of medium-frequency (i.e., decades to one century) variance associated with climate forcing.
Major energy companies asked the Supreme Court Wednesday to reconsider a state court decision allowing Honolulu’s lawsuit against them for alleged climate damages to proceed.
Major energy companies asked the Supreme Court Wednesday to reconsider a state court decision allowing Honolulu’s lawsuit against them for alleged climate damages to proceed.
In October, the Hawaii Supreme Court ruled against the companies’ effort to dismiss the case on the basis that federal law prevents claims under state law, allowing it to continue to trial. The companies, which include Chevron and Sunoco, urged the Supreme Court Wednesday to intervene, noting “years might pass before another opportunity to address this pressing question comes along.”
“This case presents the Court with its only foreseeable opportunity in the near future to decide a dispositive question that is arising in every climate-change case: whether federal law precludes state-law claims seeking redress for injuries allegedly caused by the effects of interstate and international greenhouse-gas emissions on the global climate,” the petition states. “After the decision below, there is now a clear conflict on that question.”
“State court litigation is not a constitutionally permissible means to establish global climate and energy policy,” Theodore J. Boutrous, the attorney for Chevron, said in a statement. “As the U.S. Court of Appeals for the Second Circuit held in dismissing a similar New York City lawsuit, ‘such a sprawling case is simply beyond the limits of state law.’”
“Honolulu will respond in court on this, and that will be the only comment on the petition,” Matt Gonser, executive director of the city’s Office of Climate Change, Sustainability and Resiliency, told the Daily Caller News Foundation.
The Delaware Superior Court held in January that the state’s claims against oil companies for “injuries resulting from out-of-state or global greenhouse emissions and interstate pollution” were preempted by the federal Clean Air Act. The U.S. Court of Appeals for the Second Circuit likewise found in April 2021 that New York City could not bring claims against energy companies under state law, noting that “global warming is a uniquely international concern that touches upon issues of federalism and foreign policy.”
The Hawaii Supreme Court ruled on Feb.7 that there is no state constitutional right to carry a firearm in public, finding that the “spirit of Aloha clashes with a federally-mandated lifestyle that lets citizens walk around with deadly weapons during day-to-day activities.”
Honolulu did not immediately respond to a request for comment.
All content created by the Daily Caller News Foundation, an independent and nonpartisan newswire service, is available without charge to any legitimate news publisher that can provide a large audience. All republished articles must include our logo, our reporter’s byline and their DCNF affiliation. For any questions about our guidelines or partnering with us, please contact licensing@dailycallernewsfoundation.org.
Twenty-three states have adopted goals to move to 100 percent clean energy by 2050. State governments propose to retire coal- and gas-fired power plants and adopt wind and solar systems. But, these goals conflict with efforts to promote electric vehicles (EVs), electric appliances, and a new rising demand for electric power.
Twenty-three states have adopted goals to move to 100 percent clean energy by 2050. State governments propose to retire coal- and gas-fired power plants and adopt wind and solar systems. But, these goals conflict with efforts to promote electric vehicles (EVs), electric appliances, and a new rising demand for electric power.
The green energy push seeks to eliminate greenhouse gas emissions to fight human-caused global warming. Leaders tell us that without a complete transformation of electric power, transportation, and home appliances to achieve Net Zero carbon dioxide emissions, we are doomed to suffer from increasingly severe climate change impacts.
For example, Michigan passed Senate Bill 271 on December 29 of last year as part of its “Healthy Climate Plan.” The bill requires 100 percent carbon-free electricity by 2050. Michigan’s electrical power in 2022 was generated by gas (34%), coal (29%), nuclear (22%), and wind and solar (12%).
Michigan plans to close its gas and coal plants, which provide 63 percent of the electric power, while also retiring nuclear plants. At the same time, the state wants residents to switch to EVs and electric appliances.
The Healthy Climate Plan calls for two million EVs to be on the road by 2030, along with expanded electric-powered mass transit. It calls for replacement of gas appliances with electric heat pumps. But today, more than three-quarters of Michigan homes are heated with natural gas. The state is also the largest user of propane fuel for home heating.
Efforts to adopt EVs and heat pumps will produce rising electricity demand and directly conflict with efforts to close power plants. Michigan’s carbon-free electricity goals appear to be impossible to achieve.
In 2022, 60 percent of US electric power was generated by coal and natural gas. About 85 percent came from the traditional generators: gas (40%), coal (20%), nuclear (18%), and hydroelectric (6%). After two decades of subsidies, wind and solar provided only about 15 percent of US electricity.
US demand for electricity has not grown since about 2005. But the push to electrify homes and transition to EVs will usher in a new era of rising power demand.
Almost all states striving for Net Zero by 2050 will run into the problem that Michigan faces. Shutting down coal and gas plants while promoting electric vehicles and heat pumps will produce electric power shortages. The only states that may be able to approach carbon-free electricity are Idaho, Oregon, and Washington, where hydroelectric generators produce most of the power.
The New England Integrated System Operator (ISO) issued a report in 2022 that looked at four scenarios to decarbonize the New England power grid by 2040. The report projected increases in power demand from EVs and electrification of home and business heating.
Only one scenario could meet state decarbonization goals and rising demand. That scenario called for 84 gigawatts of new wind, solar, and storage to provide 56 percent of electricity by 2040.
But, the ISO concluded that such a wind-, solar-, and battery-dominated system would not be reliable, requiring periodic operator-imposed blackouts. Even with 2,400 gigawatt-hours of battery-energy capacity and system reserve margins that were 300 percent over typical electricity demand, the system would fail for an estimated 15 days and be at risk of failure an additional 36 days each year.
Wind and solar buildouts also conflict with alarming climate forecasts. Climate warnings call for increasingly severe weather, including stronger and more frequent storms, floods, and droughts. Yet climate policy advocates demand a switch to intermittent wind and solar electricity sources. Wind and solar typically fail to operate during heatwaves, cloudy, rainy, snowy, or stormy weather conditions.
After a transition to electrified energy systems, blackouts would be more severe. When the lights go out, residents won’t be able to cook with an electric stove or drive an EV either.
Other nations also depend upon coal, gas, and oil generators for much of their electricity. Examples of hydrocarbon-produced power in 2022 were Australia (52%), China (64%), Europe (38%), India (77%), and Japan (65%). Switching to EVs and heat pumps while shuttering coal and natural gas generators will not be possible in most countries.
Two additional trends will drive electric power demand. First, the revolution in artificial intelligence (AI) requires data centers to upgrade servers with high-performance computer processors. Data center power consumption will jump by a factor of six to ten over the next decade, rising from about 1.5 percent of world power demand today to approaching ten percent of world demand.
Second, governments are pushing to establish a new green hydrogen fuel business to power heavy industries such as steel. Production of green hydrogen from the electrolysis of water is very electricity intensive.
The electricity required to drive electrolyzers to produce hydrogen to power a single steel plant with a four-million-ton annual capacity will require solar installations covering an area of approximately 70 square miles. About 5,000 terawatt-hours of electricity would be needed to drive electrolyzers to generate hydrogen for the world steel industry, equaling one and one-half times the total non-hydroelectric global renewable electricity generated today.
The green movement calls for a shutdown of coal and gas power plants. At the same time, it demands a switch to electric vehicles, electrical home appliances, and green hydrogen produced by power-intensive electrolyzers. The AI revolution will add additional electricity demand. The result will be a breakdown of the green energy transition.
A few days ago, a wildfire started in north Texas and grew quickly, driven by strong southwesterly winds. Named the Smokehouse Creek Fire, it has burned more than 1.1 million acres and is now the largest wildfire in Texas history.
A few days ago, a wildfire started in north Texas and grew quickly, driven by strong southwesterly winds. Named the Smokehouse Creek Fire, it has burned more than 1.1 million acres and is now the largest wildfire in Texas history. The mainstream media has been quick to blame climate change for the fire, with headlines like this one from NBC News: Wildfires ravage Texas amidst climate change crisis, or this one from ABC13 in Houston: How climate change is increasing wildfire risks across Texas. These stories are false; multiple lines of real-world data refute any connection between these fires and climate change.
NBC News claims:
The Texas Panhandle is no stranger to face-blasting winds nor roller-coaster dips in temperature. But the fires would not have had the same chance to take off if not for unseasonably warm temperatures and dry conditions made more likely by climate change.
ABC13 claims:
Additionally, climate change could increase Texan’s risks for wildfires over the next 30 years. ABC13 Meteorologist Elyse Smith has previously covered this topic through ABC’s Weathering Tomorrow initiative, which uses data from our partners at the First Street Foundation. It shows how wildfire risk, as well as heat, flood, and wind risks, will be impacted by climate change through the year 2050.
If either of these news outlets had bothered to do a ‘fact check,’ they would find their claims are unsupported by real world data.
Figure 1 – From 1910 through 1964 the number of hot days was actually greater than the current period of time.Figure 2 – From 1970 to the present, average annual precipitation for Texas increased.
With fewer hot days and increased precipitation recorded in the long-term climate records, the claim that Texas is more susceptible to wildfires now that in the past because of climate change is clearly false.
Both media outlets suggested that the area where the fires are is drier than normal. This too is false. Here is a map from InciWeb showing the location of the Smokehouse Creek Fire (circled in red) in Figure 3.
Figure 3 – location of the Smokehouse Creek Fire.
According to the US drought monitor, the area now beset by the wildfire is not abnormally dry and certainly not experiencing drought conditions:
Figure 4 – U.S. Drought Monitor map of Texas for Feb27, 2024. Note most of the upper Texas panhandle area is not in drought.
Nor is the adjacent region of Oklahoma caught up in the wildfire suffering under abnormally dry or drought conditions.
Wildfires, especially in arid parts of the United States, have always been a natural part of the environment, and they likely always will. Global warming did not create wildfires. In fact, wildfires have become less frequent and less severe in recent decades. One of the key contributing factors has been that the United States has experienced fewer droughts in recent decades than in periods throughout the twentieth century.
Even the most recent International Panel on Climate Change (IPCC) assessment of global climate agrees. On Page 90 – Chapter 12 of the UN IPCC Sixth Assessment Report. Emergence of Climate Impact Drivers (CIDs) the table in Figure 5 shows the incidence of “Fire weather” has not emerged from climate change:
Figure 5: note that Fire Weather has not emerged from climate change being a driver.
Actual data and various lines of hard evidence show that there is no connection between climate change and the wildfires now ravaging parts of north Texas and Oklahoma, or anywhere else for that matter. Sadly, once again the media is pushing the “climate catastrophe,” narrative in which every extreme weather event or natural disaster is caused by climate change, despite the clear evidence that this is false. In this case, rather than doing investigative due diligence, neither NBC nor ABC bothered to check facts before publishing these scare stories, which suggests that their reporters and editors are either lazy, incompetent, blinded by political ideology, or all three.
At stake in the European elections in June this year will be everything that defines the modern EU: a large volume of net zero legislation, a values-based foreign policy, and ever-more intrusive business regulation.
With farmers in revolt and the far right surging, is Ursula von der Leyen about to wreck her own green agenda?
At stake in the European elections in June this year will be everything that defines the modern EU: a large volume of net zero legislation, a values-based foreign policy, and ever-more intrusive business regulation.
Polls suggest the centrist majority that has supported these policies is growing slimmer. [emphasis, links added]
Ursula von der Leyen [pictured above] has been the quintessential representative of that majority. Born in Brussels, German by nationality, proposed by France, she was the perfect candidate for European Commission president in late 2019.
Now she is seeking a second term. Whether she will succeed will depend to a large extent on whether the centrist four-party coalition that supported her in 2019 will hold.
The far right is part of that response, but the main political shift has been inside Von der Leyen’s own political group, the European People’s Party (EPP), of which the German CDU/CSU is the largest member.
This backlash follows one of the most hectic political phases in recent EU history. When Covid struck in early 2020, Von der Leyen was instrumental in setting up the EU’s recovery fund to help countries deal with the economic consequences of the pandemic.
Then came the Green Deal, a hefty tranche of legislation on renewable energy, land use, forestry, energy efficiency, emission standards for cars and trucks, and a directive on energy taxes.
There was also a tightening of standards on pesticides, air quality, water pollution, and wastewater.
Farmers are resisting this program because it affects their livelihoods. Industrialists, too, are unhappy. A big part of the Green Deal was its industrial policy; the flagship legislation was the Net Zero Industry Act.
The industry used to be the EU’s strongest supporter.
But with the new laws came new bureaucracy: now, all EU-funded investment must include a green component of at least 30 percent, while a carbon border adjustment mechanism, to take effect in 2026, will penalize imports that do not meet EU carbon-emission standards. Together, EU legislation in the last few years amounts to a near-total corporate regime change.
Compliance with some regulations is virtually impossible for companies without dedicated legal teams. It is going to get worse.
Under discussion right now is a supply-chain law that would make European companies responsible for human rights abuses in their supply chain– including the suppliers of their suppliers.
It is instructive to look at what happened to Green politics in Germany. The coalition of the center-left SPD, the Greens, and the liberal FDP started with great enthusiasm in 2021 but is now hopelessly divided.
They depict them as members of metropolitan elites forcing their urban values on rural communities. The language suggests parallels with Brexit. As the EU is associated with partisan policies of the center-left, opposition to those policies and opposition to the EU are starting to merge.
It was the sudden abolition of a diesel subsidy for agricultural vehicles that led farmers to protest in Germany. But their discontent goes deeper.
A consequence of this is that the centrist coalition is no longer viable. This is a healthy development. When centrist parties always form coalitions with one another, we should not be surprised to see parties emerge on the fringes.
The centrists’ reaction to the rise of the far right has been to erect firewalls – by simply refusing to engage with such parties.
This might work to begin with. But when the far right exceeds certain thresholds in support, as it has in Germany, such firewalls cannot withstand the electoral arithmetic.
In Brussels, the firewall is cracking. The EPP has already opened up to the European Conservatives and Reformists group, whose most influential member is Giorgia Meloni, the hard-right Italian prime minister, who has said she will support Von der Leyen.
Meloni’s big issue is immigration: I would not rule out the idea of Von der Leyen once again assembling a majority; what I struggle to imagine is a coalition that encompasses both the left and Meloni.
It is not clear whether Renew Europe, the liberal grouping in the European Parliament, will still support Von der Leyen. Support for liberal parties is weakening everywhere, including in France.
Mark Rutte’s Party for Freedom and Democracy lost last year’s election in the Netherlands. The German FDP is fighting for its political survival within the coalition in Berlin. Von der Leyen’s hyperactive green industrial agenda is the antithesis of what conservative-liberal parties such as the FDP are standing for.
And herein lies the ultimate irony. If Ursula von der Leyen were to win a second term, she would spend most of it undoing what she did in her first.
Decarbonising the steel and electricity industry in pursuit of Net Zero represents a real and present danger to national security and must be abandoned, a former Security Minister has warned.
Decarbonising the steel and electricity industry in pursuit of Net Zero represents a real and present danger to national security and must be abandoned, a former Security Minister has warned.
Writing in a foreword to a new paper from campaign group Net Zero Watch, Sir Gerald Howarth, Minister for International Security Strategy under David Cameron, said:
Our adversaries are watching us like hawks, so let us leave them in no doubt: we are rearming and rebuilding, and Net Zero is firmly on hold.
Professor Gwythian Prins, a defence expert and one of the paper’s authors, agrees that with the recent deterioration of the world’s security situation, “luxury beliefs” such as Net Zero must be jettisoned as a matter of urgency:
This is the moment when the music stops. The Port Talbot closure harshly exposes the costs of luxury ‘green’ beliefs. We cannot be dependent on imports for the full range of necessary steels to rebuild our arsenals – the Navy first and foremost – and, most ridiculously, we cannot depend for them on our global antagonists.
Furthermore, our armed forces are wholly dependent on oil to keep them in the field, and our electricity grid will collapse without gas. Any attempt to abandon them will leave us entirely at the mercy of hostile powers.
The paper also includes a contribution from Gautam Kalghatgi, a Professor of Combustion and Energy Engineering, who ridicules plans to decarbonise the armed forces through use of batteries and biofuels.
Historian (and Daily Sceptic regular) Guy de la Bédoyère sets out the eternal historical lesson that technological laggards usually end up the victims of conquest by their more advanced neighbours.
Mr. de la Bédoyère said:
It is impossible to diminish the effectiveness of a nation’s armed forces without making it a sitting duck for a more ambitious rival’s greed. But that’s exactly what our leaders seem to want to do.
Andrew Montford, Director of Net Zero Watch said:
The three contributors make it clear that Net Zero is leaving us at the mercy of hostile powers. A Net Zero army and a Net Zero economy could both be brought to their knees in a matter of days. In these dangerous times, our politicians must re-order their priorities.
This tribute to the four leading professors among oil and gas law pioneers in academia was presented by the late Joseph W. Morris (obituary below) in 2001. It is reprinted in appreciation of private property rights to the subsoil that has set the U.S. apart from most of the rest of the world.
Ed. Note: This tribute to the four leading professors among oil and gas law pioneers in academia was presented by the late Joseph W. Morris (obituary below) in 2001. It is reprinted in appreciation of private property rights to the subsoil that has set the U.S. apart from most of the rest of the world.
I bring you four academicians.
W. L. Summers
He was born in Kingman, Indiana in 1888 and died in 1963. He took his Baccalaureate Degree and his first law degree from the University of Indiana in 1911 and a J.D. Degree from Yale in 1912. He briefly practiced law and then became a Professor of Law at the Universities of Florida and Kentucky and in 1920, joined the faculty of law at the University of Illinois. He was a member of the Order of the Coif, an advisor to the Restatement of the Law of Real Property and published articles dealing with oil and gas in many legal periodicals. He was the author of one of the first major treatises on the law of oil and gas. I am speaking of W. L. Summers, author of Summers on Oil and Gas.
II. A. W. Walker, Jr
He was born in Denison, Texas in 1901 and died in 1987. He took his Baccalaureate Degree in 1921 and his Law Degree in 1923 from the University of Texas and did post-graduate work at both Columbia and Yale in law. He practiced law for two years and then became Professor of Law at the University of Texas. He was a member of Phi Beta Kappa, the Order of the Coif, was the editor of a case book on oil and gas and published numerous articles in the legal periodicals. I am speaking of A. W. Walker, Jr., Professor of Law at the University of Texas. He was at Texas for 25 years and in 1948, resigned from the faculty to re-enter the practice of law with the Dallas-based Jackson, Walker law firm.
III. Eugene O. Kuntz
He was born in 1913 and died in 1995. He took his Baccalaureate Degree and his Law Degree from Baylor University and his LL.M. Degree from Harvard. He practiced law briefly before becoming Professor of Law at the University of Wyoming and thereafter at the University of Oklahoma. While at the University of Oklahoma, he was also from 1958 until 1965, a partner in the McAfee, Taft, law firm in Oklahoma City. He was Dean of the Law School at the University of Oklahoma for five years. He was widely published in the legal periodicals before authoring his treatise and was editor of a leading case book on oil and gas. I am speaking of Professor Eugene O. Kuntz, the author of Kuntz on Oil and Gas, which had its beginning as a revision of Thornton on Oil and Gas first published in 1904.
IV. Howard R. Williams
He was born in 1915 and is still active. He took his Baccalaureate Degree from Washington University in St. Louis in 1937 and his Law Degree from Columbia University in 1940. He was admitted to practice law in New York and practiced there briefly following which he became a Professor of Law at the University of Texas from 1946 to 1951, a Professor of Law at Columbia University from 1951 until 1963, and a Professor of Law at Stanford University from 1963 until 1998, when he became an Emeritus Professor of Law. He was editor of a leading case book on oil and gas and an author of a treatise on oil and gas. I am speaking of Professor Howard R. Williams, Emeritus Professor of Law at Stanford University and an author of Williams and Meyers on Oil and Gas.
Their Legacy
The subject which I wish to speak about for a few minutes has to do with prominent academicians. I do not purport to be a legal historian. But I do know that the law of oil and gas is relatively young. If the common law had its origin in 1066 when William the Conqueror crossed the English Channel, we know that many branches of the law which we continue to study today, had their origins hundreds of years ago. I refer to subjects like Real Property, Equity, Contracts, Torts and Remedies.
It is said by some that the drilling of an oil well in 1859 in Titusville, Pennsylvania, by Colonel Drake, “ushered in the Petroleum Era.” It is clear that the underlying principles of oil and gas law were laid down, defined and developed in the early and middle part of the 1900’s. By that I mean, it was in that time frame that the legal concepts relating to the rule of capture, theories of mineral ownership, conveyancing of minerals and royalty, the nature of the oil and gas lease and the implied covenants were evolving and being addressed by the courts.
In 1928, Professor A. W. Walker put it this way:
Oil and gas was a specie of property peculiar unto itself, . . . As a result of this realization, there is in the process of evolution today a distinct body of rules of law which may properly be designated the law of oil and gas. 6 Tex. Law Rev. 125 (1948).
I have identified four academicians who played a very, very significant role in shaping the law of oil and gas in the time frame mentioned. I clearly do not mean to say that there were not others who also made great contributions in shaping that law. Look at Professors Kulp, Merrill, Maxwell, Meyers, Sullivan, Masterson, Flitty, Huie, Woodward and Hemingway. Their footprints are also clear. But Summers, Walker, Williams and Kuntz have had a truly great impact on shaping the law.
I have found that:
In the 1930 to 1960 time frame, Professor Summers, in his Treatise and in his articles has been cited by the state and federal courts 470 times.
In the 1960-1980 time frame, the Williams and Meyers Treatise has been cited 167 times.
In the 1950 to 1980 time frame, Professor Kuntz, in his Treatise and periodicals has been cited 83 times and Thornton on Oil and Gas, which Professor Kuntz supplemented and revised has been cited 91 times in that time frame. At his death in 1995, it was reported by Professor Owen Anderson that he had been cited nearly 250 times, 3 of which were by the Supreme Court of the United States.
The December 1948 issue of the Texas Law Review was dedicated to Professor Walker when he resigned from the faculty. [2] Dean McCormick at Texas directed attention in that issue to numerous recent decisions by the Texas Courts which had cited Walker’s scholarly writings.
Later when Walker had an argument before the Texas Supreme Court in an oil and gas case, it was noted that seven of the nine justices on the Court had taken oil and gas from Walker when he was on the faculty.
All of these academicians were in a unique position to shape the evolution of the law of oil and gas. They were intensely involved in this branch of the law. Some were involved near the beginning of the 20th century when the principles of oil and gas law were evolving. Volume I of the Summers treatise was first published in 1927.
There were three ways in which these scholars made their voices heard.
First, they wrote treatises and scholarly articles which appeared in the law reviews which were widely read. They had a very receptive audience. Their audiences were the courts and the oil and gas practitioners who were struggling with the evolving theories. All were seeking help in the analysis of new theories. They found their help from these scholars.
Second, each year these teachers had perhaps 50 to 100 or more students in their classrooms. They sat at the feet of the masters year in and year out. They were a captive audience. As students, they listened and learned the principles being espoused. They were always asking: what is the law? And they were being told what the law was. [3]
And as professors are wont to do, students were also being told what those teachers thought the law ought to be. Teachers are not a timid lot. They like to talk. They like to teach. They are imaginative and these men provided great insight to the students who sat at their feet and listened to their words in a time frame when the law was evolving.
Third, when their students graduated from law schools, they pursued careers either as oil and gas practitioners or as judges or as professors of law. Listen to Owen Anderson, who is now the Eugene Kuntz Professor in Oil and Gas and Natural Resources at the University of Oklahoma: “Eugene Kuntz has influenced oil and gas law more than any other individual.”
Listen to what Howard Williams, Bill Maxwell and Charles Meyers had to say about A. W. Walker, Jr. in the Preface of their first case book published in 1956 – almost 50 years ago:
It is only fair to say, however, that our work is built on the earlier work of others. In particular, our case book reflects the work of A. W. Walker Jr. now of the Dallas, Texas Bar, but for 25 years, Professor of Law at the University of Texas. His splendid writings in the field are frequently cited and quoted in this collection.
When Professor Walker left the law school in 1948, his students wrote this tribute in the law review.
Law students like to think of Judge Walker as a lawyers’ lawyer. . . . His loyalty to the interests of the students was never more evident than in his decision this past summer to abandon a vacation to offer once more his oil and gas course in response to a petition of several hundred students.
I have been with my law firm, Gable & Gotwals, in Tulsa for 17 years. But I have nibbled around the edges of legal education, so I know a bit about the academic world. I was on the faculty of the Short Course in oil and gas law for about 15 years sponsored by the Southwestern Legal Foundation along with Professor Maxwell and Thomas Lynch. I was Dean for a short time at the University of Tulsa. I have been published now and again in the legal periodicals.
It has also been my great good fortune to know Gene Kuntz and Howard Williams – fairly well. I have visited Gene Kuntz’s classes and been exposed to his superb teaching abilities. I worked with him in the Bar when he was Dean of the Law School. I worked with him not too long before his death on a brief concerning a tough oil and gas question which we had before the courts. He was a wonderful man.
Almost 50 years ago, I visited and conferred with Howard Williams in New York City when he was teaching oil and gas law at Columbia University; I used his case book when I taught oil and gas law as an Adjunct Professor at the University of Tulsa and sat on an arbitration panel in Melbourne, Australia in a case involving an overriding royalty interest where Howard was an expert witness. It was also my great good fortune to talk to him on the telephone last week for over ½ hour. I reached him at his office at the Stanford University Law School – still thinking, still pondering and still analyzing at the age of 86. What a superb scholar.
I did not know A. W. Walker but I met him when he was Chairman of the Natural Resource Law Section of the American Bar Association. I did not know Professor Summers. I know it may be crossing the minds of some – – – but it is not true – – – I did not meet William the Conqueror when he crossed the English Channel.
What great impact all of these scholars had. Today their work is being carried forth by other top of the line scholars in case books and in treatises. The Kuntz contribution is being carried forward by Professors Lowe, Anderson, Smith and Pierce; and the Williams contribution is being carried forward by Professor Patrick Martin, the Chairman of the International Oil and Gas Education Center of the Southwestern Legal Foundation and Professors Kramer and Maxwell.
In the academic world, the law of oil and gas continues to be in excellent hands.
When John Chipman Gray died in 1915, he was remembered by a series of lectures which were privately published. Gray was a future interests scholar and wrote a book entitled, The Rule Against Perpetuities and another book entitled Restraints on Alienation. He was first and foremost a scholar and a teacher at the Harvard Law School – – but he was also a practitioner and was a founder of the Boston Law firm, Ropes and Gray, which continues to be an outstanding law firm in Boston.
One of the lecturers in speaking about Gray said, “he who controls the fountain determines the color of the stream.” The same could be said about any of these four scholars. Those of us who have been lucky enough to have learned from their teaching and writing are the beneficiaries.
———————
[1] In Memoriam: Eugene O. Kuntz, 48 Okla. L. Rev. xi (1995) 2 A. W. Walker, Jr., 27 Tex. L. Rev. 137, 138 (1948).
[2] A. W. Walker, Jr., 27 Tex. L. Rev. 137, 138 (1948).
[3] A Century of Texas Law and Lawyering, 129 Texas Lawyer Publication
Judge Joseph W. Morris died on November 11, 2021, at age 99. He was born on April 28, 1922, on a farm in Rice County, Kansas in in the same house in which his father was born in 1896. Joe attended grades one through eight in a one-room school to which he walked or rode his horse. He attended high school in Nickerson, Kansas….
After receiving his baccalaureate degree from Washburn, Joe entered the United States Navy during World War II…. After the war, he returned to Washburn where he received his law degree, graduating first in his class. He was later inducted into the Order of the Coif at the University of Oklahoma….
Following law school, he enrolled in the graduate program of the University of Michigan Law School where he earned an LL.M and an S.J.D. degree. After returning home from the University of Michigan Law School, he and Deane Conklin were married, and he joined the legal department of Shell Oil Company where he worked in both Tulsa and New York City for 12 years.
In 1960, Joe joined the legal department of Amerada Petroleum Corporation where he served as Associate General Counsel and General Counsel in Tulsa. In 1972, he was named as Dean of the College of Law of the University of Tulsa.
In 1974, he was appointed United States District Judge for the Eastern District of Oklahoma. He served as Judge and Chief Judge until 1978, after which he was named Vice President and General Counsel of Shell Oil Company in Houston. Following his retirement from Shell, Judge Morris became a shareholder and member of the board of GableGotwals where he served until his death….
During his entire career, he had a keen interest in legal education and taught oil and gas law as an adjunct professor for more than 20 years prior to becoming Dean of the College of Law at the University of Tulsa. He taught a course in Arbitration Law at the University of Tulsa College of Law as an Adjunct Professor until shortly before his death….
During the last 28 years of his life, Judge Morris was heavily involved in international arbitrations…. He was a member of the American Law Institute, the American Bar Association, the Oklahoma Bar Association, and past president of the Tulsa County Bar Association. He was an Oklahoma Fellow of the American Bar Foundation, and a former chairman of the Natural Resources Law Section of the American Bar Association….
Blackout News: “EON chief warns of a cost explosion due to transition to green energies.”
Blackout News here reports that there’s no end in sight for Germany’s self-inflicted energy crisis. Energy prices are expected to continue rising, thus posing a huge risk to industry.
This is of course no surprise as Germany, driven by radical green dogmatism, has shut down its fleet of nuclear power plants and is moving to also eliminate power plants fired by coal and natural gas. The country’s economy and environmental policy is led by economics minister Robert Habeck.
The problem is that Habeck is woefully unqualified for leading the country’s federal economics ministry.
Recently Habeck claimed that companies do not go bankrupt, rather they just stop producing, and that the economy was okay – “only the numbers are bad”.
EON chief warns of further rising energy costs
At the beginning of the year, head of Eon, Leonard Birnbaum, announced higher electricity prices and this is “now manifesting itself in reality,” reports Blackout News. “A few weeks after this forecast, energy companies EnBW and EWE announced their intention to increase tariffs.”
The increase will average 6%.
Birnbaum blames “increased investment costs” as the expansion of renewable energies and their integration into the electricity grid requires “rapid and intelligent grid expansion as well as sufficient reserve capacity”.
“In view of current developments, Birnbaum warns of further price increases if the political leadership does not take decisive countermeasures. Energy-intensive industry in particular is severely affected by rising electricity costs, which jeopardizes its competitiveness.”
Birnbaum also says that wind energy has been hampered by “uncoordinated planning” and “the problem of overloading the electricity grids due to the uneven distribution of wind turbines.”
Nearly one in three (29.2%) U.K. Met Office temperature measuring stations have an internationally-defined margin of error of up to 5°C. Another 48.7% of the total 380 stations could produce errors up to 2°C, meaning nearly eight out of ten stations (77.9%) are producing ‘junk’ or ‘near junk’ readings of surface air temperatures. Arguably, on no scientific basis should these figures be used for the Met Office’s constant promotion of the collectivist Net Zero project. Nevertheless, the state-funded operation frequently uses them to report and often catastrophise rises in temperature of as little as 0.01°C.
Under a freedom of information request, the Daily Sceptic has obtained a full list of the Met Office’s U.K. weather stations, along with an individual class rating defined by the World Meteorological Office. These CIMO ratings range from pristine class 1 and near pristine class 2, to an ‘anything goes’ or ‘junk’ class 5. The CIMO ratings penalise sites that are near any artificial heat sources such as buildings and concrete surfaces. According to the WMO, a class 5 site is one where nearby obstacles “create an inappropriate environment for a meteorological measurement that is intended to be representative of a wide area”. Even the Met Office refers to sites next to buildings and vegetation as “undesirable”. It seems class 5 sites can be placed anywhere, and they come with a WMO warning of “additional estimated uncertainties added by siting up to 5°C”; class 4 notes “uncertainties” up to 2°C, while class 3 states 1°C. Only 13.7%, or 52 of the Met Office’s temperature and humidity stations come with no such ‘uncertainty’ warnings attached.
The above graph shows the percentage totals of each class. Class 1 and 2, identified in green, account for just 6.3% and 7.4% of the total respectively. Class 3 identified as orange comes in at 8.4%. The graph shows the huge majorities enjoyed by the darkening shades of red showing classes 4 and 5. It is possible that the margins of error identified for classes 3, 4 and 5 could be a minus amount – if for instance the measuring device was sited in a frost hollow – but the vast majority are certain to be pushed upwards by heat corruptions.
Last year, the investigative journalist Paul Homewood sought FOI information from the Met Office about the Welsh weather station Porthmadog, which often appears in ‘hottest of the day’ listings. He was informed that the site was listed as class 4 and “this is an acceptable rating for a temperature sensor”. Hence, continued the Met Office, “we will continue to quote from this site”. In short, observes Homewood, the Met Office is happy to use a class 4 site for climatological purposes, “even though that class is next to junk status”. It is bad enough that the Met Office is using this site, but it is even worse that they know about the issues but still plan to carry on doing so, Homewood continued. “How many other weather stations are of such poor quality?” he asked.
Now we know.
Using these figures with a precision to one hundredth of a degree centigrade, the Met Office declared that 2023 was the second hottest in the U.K., coming in just 0.06°C lower than the all-time record. Cue, of course, all the Thermogeddon headlines in mainstream media. In 2022, the Met Office said that five sites in the U.K. on July 19th went past 40°C, with a record of 40.3°C at RAF Coningsby. Kew Gardens is termed a class 2 site, although it is very close to one of the largest tropical glasshouses in the world. St James’s Park and Northolt airport are class 5 sites, Heathrow is class 4, while RAF Coningsby is class 3. At the time, the Met Office declared that the records set a “milestone in U.K. climate history”. A national record was also set on July 18th at Hawarden Airport in Wales (class 4) and on July 19th at Charterhall in Scotland (class 4).
Always alive to a popular headline catastrophising the weather, the Met Office declared a warmest St. Valentine’s night English record this year of 11.5°C at class 4-rated St. Mary’s airport on the Isles of Scilly. Earlier in the year, the Met Office declared the highest January temperature in Scotland at 19.6°C at Kinlochewe, a class 4 site. Interestingly the previous, much promoted, U.K. record was set on July 31th 2019 at the Cambridge Botanic Gardens, a class 5 site. Even more interesting is that in the Homewood FOI disclosures, the Met Office stated that class 5 data “will be flagged and not quoted in national records”.
The Met Office is between a rock and a hard place with these surface temperature measurements. Many of its long-standing stations have been encroached by urbanisation and corruptions seem to have become endemic across the entire system. In the past, this didn’t matter as much since margin of error allowances could be accepted along with less accurate local and national weather forecasting. Measuring surface temperatures across countries and then the planet is always going to be difficult, but a more accurate reading would be obtained by only using data from WMO classes 1 and 2. However, national and global temperatures have become politicised by the global warming scare and the proposed Net Zero solution. Alarmists often state that climate ‘tipping’ points will be reached with very small increases in temperature measured in tenths of a degree.
Using data from just classes 1 and 2 would likely crash the claimed rises in national and global temperatures. Something similar would likely occur if the Met Office moved the majority of its stations to more suitable spots. A number of scientists have tried to measure the urban heat bias in temperature records with estimates suggesting a general problem of warming corruption around the 20-30% mark. Last October, two scientists working out of the University of Alabama in Huntsville (UAH), produced a paper noting: “The bottom line is that an estimated 22% of the U.S. warming trend, 1895 to 2023, is due to localised UHI [urban heat island] effects.”
Under our FOI request, it can now be seen that the problems with corrupted U.K. weather stations are similar to those discovered in the United States by meteorologist Anthony Watts. In work compiled over a decade, Watts found that 96% of temperature stations used by the U.S. weather service NOAA were “corrupted” by the localised effects of urbanisation. Sites in close proximity to asphalt, machinery and other heat-producing or heat-accentuating objects, “violates NOAA’s own published standards, and strongly undermines the legitimacy and magnitude of the official consensus on long-term climate warming trends in the United States”, he observed.
Both the U.K. and U.S. temperature datasets are important constituents of global totals compiled by a number of weather operations including the Met Office and NASA. The Met Office runs HadCRUT, where over the last 10 years two retrospective revisions have added about 30% extra warming to recent global temperatures. This had the effect of removing all traces of a pause around 2000-2014. Meanwhile, Professor Ole Humlum has noted that the GISS database run by NASA increased its surface air temperature between 1910 to 2000 from 0.47°C to 0.67°C, a boost of 49% over this period. “Frequent and large corrections in a database unavoidably signal a fundamental uncertainty about the correct values,” commented Humlum.
Pristine temperature data is available. In 2005, NOAA set up a 114 nationwide network of stations called the U.S. Climate Reference Network (USCRN). It was designed to remove all urban heat distortions, aiming for “superior accuracy and continuity in places that land use will not likely impact during the next five decades”.
The graph above shows nothing more than very minor, gentle warming since 2005, slight warming that might be expected in the small and continuing natural rebound from the depths of the pre-industrial Little Ice Age. A reliable source of global data is to be found in the UAH satellite record, which shows less overall warming since 1979 than the surface datasets. Both these datasets are rarely mentioned. In fact one of the compilers of the satellite data, along with the UAH paper on urban heat, is Dr. Roy Spencer. In 2022 he was kicked off Google AdSense for publishing “unreliable and harmful claims”. The move demonetised Dr. Spencer’s widely consulted monthly satellite temperature update page by removing all Google-supplied advertising. Google is on record as stating that it will ban all sites that are sceptical of “well established scientific consensus”.
Chris Morrison is the Daily Sceptic’sEnvironment Editor.


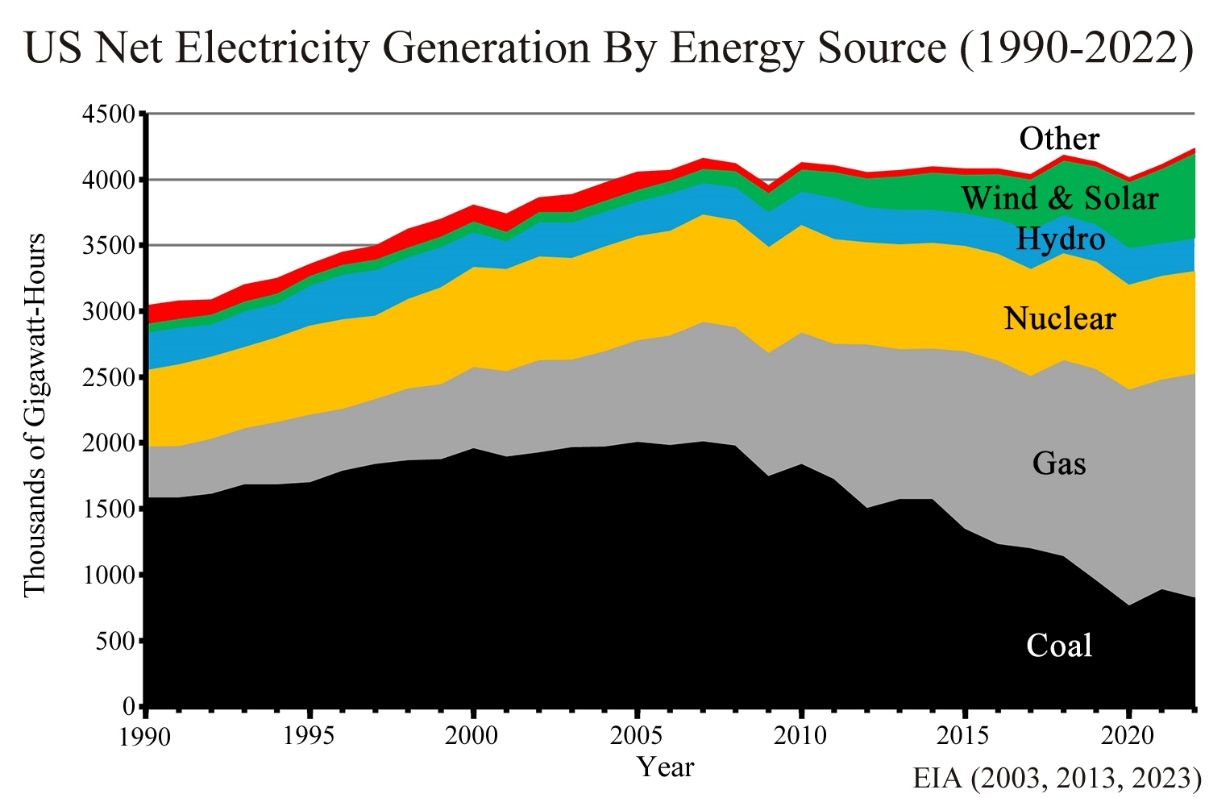
You must be logged in to post a comment.