No, ScienceDaily, Data Show No โ€˜Sharp Accelerationโ€™ in Warming

ScienceDailyโ€™s article, โ€œScientists detect a sharp acceleration in global warming,โ€ promotes a new Geophysical Research Letters paper claiming that global warming has entered โ€œa faster gearโ€ since about 2015. This is false.

From ClimateRealism

By Anthony Watts


ScienceDailyโ€™s article, โ€œScientists detect a sharp acceleration in global warming,โ€ promotes a new Geophysical Research Letters paper claiming that global warming has entered โ€œa faster gearโ€ since about 2015. This is false.  The authors argue that after statistically removing the effects of El Niรฑo, volcanic eruptions, and solar variability from five global surface temperature datasets, they detect a statistically significant acceleration in warming of about 0.35ยฐC per decade over the past 10 years. But historical temperature data show a much different picture.

There is no convincing evidence that Earthโ€™s warming has suddenly accelerated. Instead, this appears to be an exercise in statistical manipulation built upon climate modeling assumptions, presented as though it were an observational discovery.

And thereโ€™s advocacy behind the paper too, as evidenced by this quote from the paperโ€™s co-author, climate science blogger Stefan Rahmstorf:

If the warming rate of the past 10 years continues, it would lead to a long-term exceedance of the 1.5ยฐC limit of the Paris Agreement before 2030. How quickly the Earth continues to warm ultimately depends on how rapidly we reduce global CO2 emissions from fossil fuels to zero.

Science and advocacy are not a convincing combination.

The paper does not report the discovery of a new measurement. It takes existing surface temperature records, applies a statistical procedure designed to subtract what the authors consider โ€œnoiseโ€ from El Niรฑo, volcanic aerosols, and solar variability, and then analyzes the adjusted temperatures for an acceleration signal.

In other words, the claimed acceleration appears only after the authors modify the observations. ScienceDaily presents this as though scientists have discovered a new physical phenomenon. They havenโ€™t. They have created a new statistical product.

While that may be a perfectly legitimate scientific exercise, it should not be confused with or take precedent over direct observational evidence. In addition, to be a fair statistical comparison, they would have had to run the same analysis, โ€œremoving noise,โ€ from past historical temperature data.

The paper acknowledges that the apparent acceleration is not statistically significant in the unadjusted data. Only after removing what the authors characterize as natural variability does the acceleration exceed their chosen confidence threshold.

That raises an obvious question: If the temperature acceleration is so obvious, why must it first be extracted mathematically via statistical methods?

Even more revealing is what the authors admit later in the paper. Their adjustment for El Niรฑo, volcanic eruptions, and solar influences is โ€œempirically based, but approximate and imperfect,โ€ and they acknowledge that the influence of the powerful 2023-2024 El Niรฑo may not have been completely removed. Those are important caveats, and ScienceDaily barely mentions them.

Instead, readers are told that global warming has โ€œshifted into overdriveโ€ and that warming has accelerated with more than 98 percent statistical certainty. That makes for a dramatic headline, but statistical confidence in a chosen analytical method is not the same thing as confirmation that the climate system itself has fundamentally changed.

The paper also leans heavily on climate models. ScienceDaily notes that the observed acceleration is considered โ€œconsistentโ€ with current climate models, while the journal paper likewise states that such acceleration is expected under standard global warming scenarios and falls within the range of model predictions.

That should immediately raise skepticism.

Climate models are hypotheses expressed as computer code. They are useful research tools, but they are not measurements. Their value depends on how well they match the real world. Using model expectations to validate statistical adjustments derived from observations risks becoming a circular exercise, i.e. โ€œjunk science.โ€ As importantly, models consistently fail, without adjustment, to accurately portray past and present temperatures. If models donโ€™t get past and present temperatures right, consistently overstating measured warming, no one should trust their projections of the future or base predictions upon their outputs.

If the question is whether global warming has accelerated, perhaps the first place to look should be the atmosphere itself. The University of Alabama in Huntsville (UAH) satellite temperature record provides one of the worldโ€™s longest continuous measurements of lower-tropospheric temperature using microwave sounding instruments carried aboard satellites. The UAH team has maintained this record since 1979, producing a globally consistent dataset that measures the bulk atmosphere rather than relying on a patchwork of imperfect and biased surface weather stations.

The latest UAH global temperature time series, seen below, tells a very different story from the one presented by ScienceDaily.

The graph accompanying the July 2026 report shows that lower-troposphere temperatures surged during the recent El Niรฑo, peaked in 2024, and have since declined noticeably. The current anomaly remains above the long-term average, but the sharp rise that fueled so many alarming headlines has subsided. The short-term trajectory is downward, not upward.

That does not prove that global warming has ended. Neither does it support headlines claiming that warming has suddenly accelerated into a new phase.

Instead, it illustrates something climate scientists have long recognized: global temperatures fluctuate considerably from year to year because of natural variability, particularly from El Niรฑo and La Niรฑa events. A few unusually warm years following a strong El Niรฑo are not, by themselves, evidence that the long-term warming rate has permanently changed.

Ironically, even the paper cited by ScienceDaily acknowledges this uncertainty. The authors explicitly state that they are not identifying the physical cause of the claimed acceleration and concede that whether such rapid warming continues โ€œremains to be seen.โ€

Those are appropriately cautious scientific statements. ScienceDailyโ€™s headline is not, and that is the broader lesson here.

Science advances through observations that can be independently verified, not through increasingly sophisticated methods of massaging existing datasets until they reveal the desired statistical signal. When a claimed acceleration appears only after extensive adjustments for multiple variables and is then celebrated because it agrees with climate model expectations, skepticism is not only appropriate, but also essential. Also, there is no evidence whatsoever presented in the article that reducing fossil fuel use will change temperature trends in the near or long-term, although statistical filtering and manipulations might project a favorable decline called for by the advocates/researchers if the data is massaged enough.

The climate is changing, as it always has. The question is how fast, why, and with what degree of confidence we can measure those changes. Those questions are answered by observations, not by admittedly imperfect statistical filters designed to tease out an โ€œaccelerationโ€ that isnโ€™t obvious by simply looking at the base data.

ScienceDailyโ€™s readers deserved to hear that distinction. Instead, they received another clickbait style headline announcing certainty with possible future consequences where the underlying science remains far more nuanced and proof of danger of exceeding a politically chosen temperature target is non-existent.

Soros-Backed E3G Boasts About Institutionalizing Its โ€˜Climate Securityโ€™ Power Grab

E3G (Third Generation Environmentalism) is a real UK-based climate think tank focused on integrating climate policy into politics, economics, diplomacy, and now security frameworks.

Full embrace of their “broader concept” risks turning climate into a master variable that distorts priorities in a dangerous world where nuclear deterrence, conventional military power, and economic competitiveness remain paramount.

E3G (Third Generation Environmentalism) is a real UK-based climate think tank focused on integrating climate policy into politics, economics, diplomacy, and now security frameworks.

Soros-Funded Group E3G Crows Over Dystopian โ€˜Climate Securityโ€™ Subterfuge It Helped Build

E3G receives funding from various philanthropic foundations, governments, and NGOs.

Open Society Foundations (founded and primarily funded by George Soros) has provided grants: at least ~$1 million between 2020-2023 according to public records cited in the Newsbusters piece.

E3G’s own site lists funders like the Childrenโ€™s Investment Fund Foundation but emphasizes independence. Sorosยด Open Society has broadly funded climate initiatives (e.g., green jobs, finance for developing countries), fitting a pattern of supporting progressive global governance and environmental causes.

This confirms the “Soros-funded” label has a factual basis, though it’s not E3G’s sole or majority funder.

E3G recently published “Climate Security: Entering a new era?” (July 21, 2026), celebrating progress. Key points from their blog:

  • They claim to have helped build the “first generation” of climate security work, which framed climate change as a “threat multiplier” for instability, migration, resource conflicts, supply chains, etc.
  • Recent developments they highlight: UK’s new Climate Security Taskforce (co-chaired by climate and defense ministries), references in >60 countries’ strategies, events like their forum with King’s College, and integration into national security docs (e.g., Germany, Japan, Pacific Islands).
  • They argue for expanding it: Embed climate across defense, diplomacy, development, finance; treat it as a core geopolitical factor alongside energy transitions, critical minerals, and resilienceโ€”not just an environmental issue.
  • Tone: Pragmatic policy advocacy noting risks from fragmentation, but optimistic about mainstreaming.

This aligns with broader trends. Climate impacts (extreme weather, Arctic routes, energy security) are objectively discussed in military and intelligence assessments worldwide (e.g., US DoD, UK MoD reports for years). Framing it as “security” can justify budgets, international cooperation, or domestic policy.

The query mirrors a Newsbusters article (conservative media watchdog) criticizing this as part of a Soros-backed push for expansive globalist regulation.

Their concerns:

  • “Crowing” over institutional capture: Using climate to expand government reach into security, foreign policy, economics (“whole-of-society” approach).
  • Links to Soros’s history of funding transformative agendas (open borders, criminal justice, etc.), seeing climate as another vector for centralized control and reduced national sovereignty.
  • Risks of “securitizing” everything: Prioritizing climate could distort defense priorities, enable protectionism, or create new bureaucracies without delivering security.

E3G’s self-congratulatory tone is typical for advocates who’ve influenced policy.

E3G’s Climate Security Strategy

E3G frames climate security as a core geopolitical, economic, and institutional imperative. Their approach has evolved from awareness-raising (“threat multiplier”) to mainstream integration across government functions. The July 21, 2026, blog post “Climate Security: Entering a new era?” best summarizes their current strategy.

E3G divides it into phases and pillars:

  1. Phase 1 (Completed, per E3G): Establish climate change as a security and resilience risk. They claim influence here, citing early reports like Degrees of Risk (2011), which proposed risk management frameworks for climate impacts on stability.
  2. New Phase (Current Focus): Climate as a “geopolitical force” reshaping energy, trade, industrial strategy, migration, critical minerals, and clean-tech supply chains. Bidirectional: Climate affects geopolitics, and geopolitics constrains climate action.
  3. Four Key Reflections/Pillars:
    • Institutional mainstreaming: Push for dedicated structures (e.g., UK Climate Security Taskforce co-chaired by climate and defense ministries), inclusion in >60 countries’ national/defense strategies, and national risk assessments (Germany, Japan).
    • Broader, integrated concept: Combine defense, diplomacy, development, finance, and resilience. Embed climate into foreign/security policy planners (beyond environment ministries). Tailor by context: existential for Pacific Islands; maritime/disaster/energy for Indonesia; shared prosperity via supply chains for others.
    • Practical action over rhetoric: Warn that language can outpace implementation; risks from “disorderly, militarized or protectionist reactions.”
    • Climate finance as security tool: Link adaptation funding, development bank reform, and budgeting for climate risk to resilience. Critique narrowly military resilience definitions (e.g., Canadian Defence, Security and Resilience Bank).

Tactics:

  • Convening (e.g., forums with officials, Kingโ€™s College).
  • Diplomacy and coalition-building.
  • Targeted reports and briefings on economic security, EU policy, US clean energy transition.
  • Framing clean energy transitions as enhancing security (e.g., reducing fossil fuel dependency).

Strengths

  • Real overlaps: Climate impacts (extreme weather, Arctic opening, supply chain disruptions, energy reliability) legitimately intersect with security. Intelligence/military assessments worldwide acknowledge this. E3G highlights measurable issues like insurance withdrawals, grid strain, and resource competition.
  • Pragmatism in tone: They acknowledge fragmentation, trust erosion, and risks from poor responsesโ€”not pure alarmism. Contextual tailoring (different regions have different priorities) is sensible.
  • Institutional focus: Moving from abstract warnings to concrete embedding (strategies, taskforces) could improve preparedness if done narrowly.

Weaknesses and Skeptical Critiques

  • Over-securitization risk: Expanding “security” to encompass finance, development, industrial policy, and migration can justify expansive government intervention and blur lines with economic planning. This risks subordinating traditional hard security (e.g., military capabilities, alliances against state adversaries) to climate metrics.
  • Assumed urgency and solutions: Relies heavily on rapid clean energy transitions and massive finance mobilization as security enhancers. Underplays trade-offs: mineral dependencies (new vulnerabilities), reliability challenges with renewables, economic costs, and political backlash. Developing countries often prioritize cheap energy and growth over stringent targets.
  • Self-reinforcing narrative: Claiming “the argument is won” and pushing “sharper focus” creates pressure for perpetual action. Success is measured by integration and spending rather than verifiable reductions in net insecurity or damages relative to costs.
  • Geopolitical naivety potential: In a fragmented world (rising multipolarity, great-power competition), prioritizing global cooperation and finance flows may conflict with national interest realism. Protectionism or militarized responses they warn against could be rational state behavior.
  • Adaptation vs. mitigation emphasis: Strong on mitigation-linked finance; resilience talk includes adaptation but often ties back to emissions goals. History shows wealth and technology (adaptation) have reduced climate vulnerability far more than emissions cuts to date.
  • Influence model: Effective at elite levels but top-down. Funded partly by aligned philanthropies, it aligns with a “transformational” agenda that can prioritize long-term climate modeling over near-term resilience and prosperity.

Overall Assessment

E3G’s strategy is sophisticated, insider-oriented advocacy that professionalizes climate as a cross-cutting security domain.

It correctly identifies interconnections but extends them into a holistic governance overhaul that invites mission creep.

In practice, it promotes accelerating net-zero policies under a security banner, leveraging real risks to advance preferred economic transitions.

Partial integration makes sense for resilience planning (e.g., infrastructure hardening, supply chain diversification, energy diversity).

Full embrace of their “broader concept” risks turning climate into a master variable that distorts priorities in a dangerous world where nuclear deterrence, conventional military power, and economic competitiveness remain paramount.

Outcomes will depend on implementationโ€”risk registers and taskforces are easy; delivering affordable, reliable energy and genuine resilience is harder.

Watch whether it produces adaptive strength or diverts resources into symbolic global coordination.

E3G is a London-based climate think tank (with offices in Brussels, Berlin, Washington DC) that positions itself as translating “climate politics, economics, and diplomacy into action.”

It focuses on accelerating the net-zero transition through elite influence: policy advice, coalition-building, diplomacy, and increasingly “climate security.”

Wrong, Guardian, Climate Change Hasnโ€™t Taken New Orleans Beyond the โ€˜Point of No Returnโ€™

The Guardian claims in โ€œโ€˜Point of no returnโ€™: New Orleans relocation must start now due to sea level, study findsโ€ that New Orleans has effectively entered a โ€œterminal conditionโ€ and must begin an organized population retreat because sea-level rise will surround the city within decades. This is false. The article relies on speculative climate modeling, paleoclimate analogies, and worst-case sea-level projections that are nowhere near what actual tide gauge measurements of sea level show today.

From ClimateRealism

By Anthony Watts

The Guardian claims in โ€œโ€˜Point of no returnโ€™: New Orleans relocation must start now due to sea level, study findsโ€ that New Orleans has effectively entered a โ€œterminal conditionโ€ and must begin an organized population retreat because sea-level rise will surround the city within decades. This is false. The article relies on speculative climate modeling, paleoclimate analogies, and worst-case sea-level projections that are nowhere near what actual tide gauge measurements of sea level show today.

The story warns that southern Louisiana faces โ€œ3โ€“7 meters of sea-level riseโ€ and shoreline retreat of up to 100 kilometers inland. That claim is extrapolated from comparisons to a warm period 125,000 years ago when ice sheets were in a very different configuration, not based on observed current data trends. The result of computer model simulations of ancient paleoclimate conditions has no bearing on the present, nor is it in-line with actual sea-level trends.

Measured sea-level rise along the Gulf Coast is well documented by long-running tide gauges operated by the National Oceanic and Atmospheric Administration (NOAA). The observed rate in the region is on the order of millimeters per year, not meters per decade as seen in the sea level trend graphic from the National Atmospheric and Oceanic Administration (NOAA) below.

The New Canal Louisiana tide gauge is the station closest to New Orleans. Note that based on actual data, NOAA predicts about two feet of rise in 100 years. Even accounting for local subsidence, the data show gradual rise, not an exponential surge toward three to seven meters (9.8 to 23 feet) this century. There is no empirical evidence supporting the notion that New Orleans will be โ€œsurrounded by the Gulf of Mexico before the end of this century.โ€

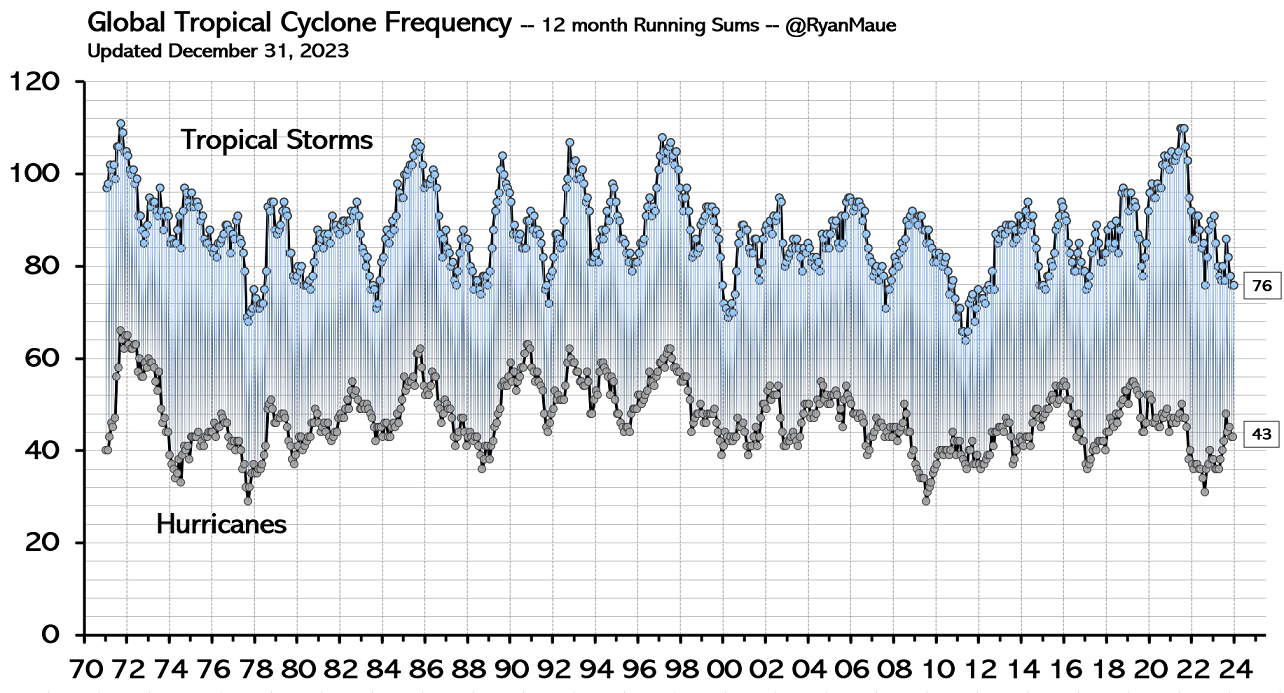
The Guardian also asserts that โ€œstrengthening hurricanesโ€ are compounding the threat. Yet the Intergovernmental Panel on Climate Change (IPCC) Sixth Assessment Report (AR6) reports no increase in the number or severity of major hurricanes. Observational records for U.S. landfalling hurricanes show no significant upward trend over the past 50 years, as seen in the graphic below.

Source: Ryan N. Maue, โ€œGlobal Tropical Cyclone Activity,โ€ Climate Atlas, accessed May 6 2026, http://climatlas.com/tropical/frequency_12months.png

The most destructive hurricane to strike Louisiana, the 1900 Galveston storm and later the 1915 and 1965 storms, occurred long before modern carbon dioxide emissions were elevated. Hurricane activity in the Gulf of America has always fluctuated due to natural cycles such as the Atlantic Multidecadal Oscillation. Wind shear, sea-surface temperatures, and atmospheric dynamics drive storm intensity. There is no consistent data demonstrating a climate-driven escalation in Gulf Coast hurricane strength.

To the extent that โ€œsea level riseโ€ is greater on average in New Orleans and some other Gulf Coast areas than for the nation or world as a whole is due to a factor that the Guardian largely ignores, land subsidence. Southern Louisiana is sinking due to sediment compaction, groundwater withdrawal, oil and gas extraction, and the historical channelization of the Mississippi River. Much of the relative sea-level rise in the region is local land sinking, not accelerating global ocean expansion. Conflating subsidence with climate change induced sea level rise is grossly and dangerously misleading.

Even the study at the center of the article is an opinion piece, not a research paper, in a scientific journal projecting improbable future scenarios. It does not present new measurements showing imminent sinking or rapid sea level rise.

The map shown in the article depicts Louisiana under three meters of sea-level rise. That graphic is a model scenario based on SSP5-8.5, a high-emissions climate scenario combining fossil-fuel-intensive development with high level climate forcing by 2100. This worst-case scenario has no bearing in reality and is so bad that the IPCC recently removed it from all scientific consideration.

The rhetoric reads more like the trailer for a big-budget disaster film rather than an objective journalistic endeavor. โ€œTerminal condition.โ€ โ€œPoint of no return.โ€ โ€œTimebomb.โ€ These alarming trigger words and phrases donโ€™t reflect the reality on the ground in New Orleans, nor trends recorded by scientific instruments.

New Orleans has already invested billions of dollars in levees, pumps, and floodgates since Hurricane Katrina. Engineering solutions exist. The Dutch have defended land below sea level for centuries. To suggest that โ€œthereโ€™s no amount of moneyโ€ that can maintain protective infrastructure ignores modern coastal engineering reality.

Sea level is rising gradually. Wetlands are eroding due to river management and sediment starvation. Subsidence is measurable. These are real challenges. But they are not proof that relocation โ€œmust start now.โ€

Policy should be driven by measurements, not metaphors.

New Orleans faces engineering and land management challenges. It does not face a guaranteed watery extinction within decades based on current observed sea-level rise or hurricane trends. The Guardianโ€™s doomsday story is not sober risk assessment, rather it is junk journalism at its worst.

RCP8.5 Is Officially Dead: Climate Science Finally Retires Its Implausible Extreme Scenario

The RCP8.5 (and its close equivalent SSP5-8.5) has effectively been retired from the core framework for the next round of major climate modeling (CMIP7, feeding into IPCC AR7).

The RCP8.5 (and its close equivalent SSP5-8.5) has effectively been retired from the core framework for the next round of major climate modeling (CMIP7, feeding into IPCC AR7).

This is a meaningful course correction after years of criticism. Roger Pielke Jr. called it “the most significant development in climate research in decades” in his recent Substack post.

Representative Concentration Pathways (RCPs) were developed for CMIP5 (used heavily in IPCC AR5). RCP8.5 assumed a radiative forcing of +8.5 W/mยฒ by 2100 relative to pre-industrialโ€” the highest of the standard set. It implied very high greenhouse gas concentrations, often described (misleadingly) as “business-as-usual” or a no-new-policies baseline.

In practice, it became the most-cited scenario in thousands of impact studies (floods, wildfires, agriculture, health, sea level, etc.) because it produced the strongest “signal” for detecting climate effects amid natural variabilityโ€”useful for model diagnostics but problematic when treated as the default future.

A new paper by Van Vuuren et al. (2026) for the ScenarioMIP framework (guiding CMIP7) introduces seven updated scenarios and drops RCP8.5/SSP5-8.5 and SSP3-7.0 as core cases.

Reasons cited:

  • Falling costs of renewables (solar/wind).
  • Expansion of climate policies.
  • Actual emission trends and energy outlooks (e.g., IEA current/stated policies scenarios) that diverge sharply from the extreme high-coal pathway.
  • The high-end scenarios are now deemed implausible on socioeconomic and technological grounds.

Critics like Pielke, Justin Ritchie, and others had documented for years that RCP8.5 diverged from reality even in the near term: observed/post-2005 emissions, coal trends, and energy projections tracked much lower. It required assumptions (e.g., coal super-abundance ignoring reserves and economics) that were already strained by the 2010s. IPCC AR6 itself noted high-emissions scenarios had “low likelihood” and weren’t typical “no policy” baselines, though legacy use persisted.

For over a decade, RCP8.5 was over-weighted in research, media, and policy communicationโ€”often without clear probability labels or caveats that it was an extreme/high-risk pathway, not the expected one. This inflated perceptions of imminent catastrophe and justified aggressive mitigation timelines that downplayed trade-offs (energy reliability, costs, development in poor countries). Self-correction in science is good: dropping implausible baselines improves credibility.

CMIP7 (Coupled Model Intercomparison Project Phase 7) is the next major iteration of the international effort to coordinate Earth System Model (ESM) simulations for understanding past, present, and future climate. Its ScenarioMIP component defines the core future emissions/concentration/land-use pathways that drive these models. The key paper is Van Vuuren et al. (2026) in Geoscientific Model Development, which formalizes a new set of seven scenarios for CMIP7 (feeding into IPCC AR7 and broader research).

Roger Pielke Jr. is a political scientist and policy scholar (University of Colorado Boulder emeritus, now AEI senior fellow) specializing in the intersection of science, policy, disasters, and climate. He accepts the core physicsโ€”humans influence the climate via greenhouse gases, and the planet has warmedโ€”but has long criticized how climate science is communicated, how scenarios are used (or misused), the politicization of research, and the overemphasis on aggressive mitigation at the expense of adaptation and innovation.

_____________________________________________________________________________________

RCP8.5 is Officially Dead

The most significant development in climate research in decades

From The Honest Broker

By Roger Pielke Jr.

โ€œ[T]he high-emissions RCP8.5 scenario has long been described as a โ€œbusiness-as-usualโ€ pathway with a continued emphasis on energy from fossil fuels with no climate policies in place. This remains 100% accurate . . .โ€œ โ€” from 2021, Chris Field (co-chair of IPCC WG2 AR5) and Marcia McNutt (president of U.S. National Academy of Sciences, Engineering, and Medicine )

The international committee responsible for the official scenarios that feed into climate modeling that are the basis for most projective climate research and the assessments of the Intergovernmental Panel on Climate Change (IPCC) has just published the next generation of climate scenarios.

Big news: The new framework has eliminated the most extreme scenarios that have dominated climate research over much of the past several decades โ€” specifically, RCP8.5, SSP5-8.5, and SSP3-7.0. This is an absolutely huge development in climate science which will have lasting impacts across research and policy.

The future is not what it used to be.

Todayโ€™s post commends the researchers who have brought climate scenarios more in line with current understandings, but also raises some significant continuing issues with the scenarios.

Letโ€™s get started . . .

The new scenarios come from the Coupled Model Intercomparison Project (CMIP) โ€” a project of the World Climate Research Programme (WCRP), co-sponsored by the World Meteorological Organization, the International Science Council, and UNESCOโ€™s Intergovernmental Oceanographic Commission.

Under CMIP, now in its seventh iteration, sits another little-known committee with responsibility for developing the scenarios necessary for earth system models to project future climate.1 That committee โ€” called ScenarioMIP โ€” just published the new scenario framework that will underpin the IPCCโ€™s Seventh Assessment Report (AR7) and much of the research that it will draw upon.

In a paper released earlier this month, Van Vuuren et al. (VVetal26) introduce a new set of seven scenarios. The authors write of the obsolete high end emissions scenarios (emphasis added):

โ€œFor the 21st century, this range will be smaller than assessed before: on the high-end of the range, the CMIP6 high emission levels (quantified by SSP5-8.5) have become implausible, based on trends in the costs of renewables, the emergence of climate policy and recent emission trends.โ€

Read that again โ€” The high end scenarios are Implausible.2

I disagree that the implausibility of the high-end scenarios resulted from the falling costs of renewables or the emergence of climate policy, but that is a debate for another day.

What matters today is that the group with official responsibility for developing climate scenarios for the IPCC and broader research community has now admitted that the scenarios that have dominated climate research, assessment, and policy during the past two cycles of the IPCC assessment process are implausible: They describe impossible futures.

Tens of thousands of research papers have been โ€” and continue to be โ€” published using these scenarios, a similar number of media headlines have amplified their findings, and governments and international organization have built these implausible scenarios into policy and regulation.

We now know that all of this is built on a foundation of sand.

What changed

The new CMIP7 ScenarioMIP framework offers seven scenarios spanning a range from โ€œVERY LOWโ€ through โ€œHIGH.โ€ The current naming convention drops the radiative-forcing target labels of the SSP era โ€” there is no โ€œ8.5โ€ scenario, and no โ€œ7.0โ€ scenario, but as Iโ€™ll show below, each scenario has a radiative forcing level in 2100.

I ran the available new scenarios (HIGH, MEDIUM, LOW, and VERY LOW) through the FaIR calibrated and constrained ensemble that Sanderson and Smith (2025) used to characterize the CMIP7 set (FaIR v. 2.2.0 as described in their README file). I then ran each of the five tier-1 SSPs through the same emulator with identical parameters to ensure that the results are apples-to-apples. The full methodology, data, and code is in the appendix to this post.

The headline results follow.

COโ‚‚ emissions: fossil fuels and industry, 2000โ€“2100

The chart above shows fossil-fuel and industry COโ‚‚ emissions for four CMIP7 scenarios alongside the five tier-1 SSPs and the two main reference scenarios from the 2025 IEA World Energy Outlook.

Note the massive gap between the new HIGH and SSP5-8.5. The new HIGH reaches 71 Gt COโ‚‚/yr in 2100 โ€” far below SSP5-8.5 at 128 Gt in 2100. Nothing in the CMIP7 set comes close to SSP5-8.5. The new HIGH also sits below SSP3-7.0 by about 9% in terms of cumulative emissions to 2100. Note also the gap between MEDIUM (solid yellow) and SSP2-4.5 (dashed yellow), which Iโ€™ll return to below.

Both of the most recent IEA near term scenarios โ€” which run to 2050 โ€” fall below MEDIUM and SSP2-4.5.

The table below compares the CMIP7 scenarios to their closest AR6 analogues, showing that the overall range has constricted. The higher scenarios have come down and the lower scenarios have come up โ€” except VERY LOW, which moved down.

2100 effective radiative forcing and end-of-century temperature

The table below lists AR6 and CMIP7 scenarios from highest to lowest 2100 radiative forcing. The middle column shows the average global temperature change from an 1850-1900 baseline, under the climate emulator used by CMIP7. The right column shows the average temperature change for the SSPs as projected by the IPCC AR6.

Read the full story here.

Another Day, Another Model of Future Climate Doom

From theย Institute for Basic Scienceย and the โ€œweโ€™re all gonna dieโ€ department comes Episode #2971 of model madness via press release:

Earthโ€™s future climate at 9 km worldwide resolution

From Watts Up With That?

By Anthony Watts

From the Institute for Basic Science and the โ€œweโ€™re all gonna dieโ€ department comes Episode #2971 of model madness via press release:

Earthโ€™s future climate at 9 km worldwide resolution

Global Warming does not affect our planet evenly. Some areas such as the Arctic region or high mountain peaks warm faster than the global average, whereas others, including large parts of the tropical oceans, show reduced temperature trends compared to the mean. The heterogeneity of future rainfall patterns is even more pronounced. To adapt to future climate change, policymakers and stakeholders need detailed regional climate information, often on scales much smaller than the typical resolution (~100-200 km) of climate models used in the reports of the Intergovernmental Panel on Climate Change (IPCC).

A team of scientists from the IBS Center for Climate Physics (ICCP), Pusan National University in South Korea and the Alfred Wegener Institute, Helmholtz Centre for Polar and Marine Research (AWI), Bremerhaven, Germany has achieved an important breakthrough in climate modeling, providing unprecedented insights into Earthโ€™s future climate and its variability. Their research was published in the open access journal Earth System Dynamics.

Utilizing the AWI-CM3 earth system model, a novel iterative global modeling protocol, and two of South Koreaโ€™s fastest supercomputers (Aleph at the Institute for Basic Science and Guru at the Korea Meteorological Administration), the researchers have simulated climate change at scales of 9 km in the atmosphere and 4-25 km in the ocean. These extensive computer model simulations offer a more accurate representation of future climate conditions, enabling better planning for climate adaptation.

The AWI-CM3 high-resolution model accurately represents global climate, including small-scale phenomena, such as rainfall in mountainous regions, coastal and island climate processes, hurricanes and ocean turbulence (Fig. 1). By resolving more regional details and their interactions with the large-scale atmosphere and ocean circulations, the model demonstrates a superior performance compared to most lower-resolution climate models.

A snapshot of simulated climate conditions. Blue/red shading: sea surface temperature deviations from zonal mean; gray/white shading: low clouds; green/pink shading: 10m wind speed; blue/yellow shading in upper panels: hurricane precipitation. The figure illustrates the ubiquity of mesoscale climate phenomena, such as Tropical Instability Waves in the equatorial Atlantic and Pacific, hurricanes (making landfall in Hawaiสปi in this snapshot), ocean cold wakes generated by hurricanes, stratocumulus cloud decks and patchy day-time convection over the Amazon forest. Credit: Institute for Basic Science

A main product of the simulations is a set of detailed global maps of expected climate change (e.g., temperature, rainfall, winds, ocean currents, etc.) for an anticipated 1oC future global warming.

โ€œIt is important to keep in mind that Global Warming is spatially quite heterogenous. For a 1oC global temperature increase, the Siberian and Canadian Arctic will warm by about 2oC, whereas the Arctic Ocean will experience warming of up to 5oC. In high mountain regions, such as the Himalayas, the Andes and the Hindu Kush, the model simulates a 45-60% acceleration relative to the global meanโ€, says MOON Ja-Yeon from the ICCP, and lead author of the study. To ensure broad access to these high-resolution climate projections, the team has launched an interactive data platform, where users can explore future climate change on regional and global scales (Fig. 2). Normalized climate change data for a 1ยฐC Global Warming level can be downloaded and opened directly in the Google Earth application. These data can provide information on expected future changes in climate variables, such as windspeed and clouds, which are relevant for the future deployment of wind or solar farms, respectively.

Download data of climate change (e.g., temperature, wind speed, precipitation, etc.) per 1oC global warming from 9 km AWI-CM3 Global Warming simulations. Go to: https://climatedata.ibs.re.kr/data/papers/moon-et-al-2024-earth-system-dynamics. Credit: Institute for Basic Science

โ€œOur study also highlights the regional impacts of major modes of climate variability, such as the Madden Julian Oscillation, the North Atlantic Oscillation, and the El Niรฑo-Southern Oscillation, as well as their response to greenhouse warmingโ€ says Prof. Thomas JUNG from the AWI and co-corresponding author of the study. According to the AWI-CM3 simulations, the amplitude of both, the Madden Julian Oscillation and of the alternating El Niรฑo and La Niรฑa events will increase in the future, which will lead to intensified rainfall impacts in affected regions. โ€‹The simulations further indicate an increase in the frequency and intensity of extreme rainfall events (>50 mm/day) in areas such as eastern Asia, the Himalayas, the Andes, Amazonia, mountain-tops in Africa and the east coast of North America with significant implications for flooding, erosion, and landslides.

โ€œMost global climate models used in the assessment reports of the IPCC are too coarse to resolve small islands, such as those in the western tropical Pacific. These islands are already threatened by global sea level rise. Our new climate model simulations now provide new regional insights into what these regions can expect in terms of changes in ocean currents, temperatures, rainfall patterns and weather extremes. We hope that our dataset will be used extensively by planners, policy- and decision-makers and the public.โ€, says Prof. Axel TIMMERMANN, Director of the ICCP and co-corresponding author of the study.

The studyโ€™s findings offer critical information for assessing climate risks and implementing adaptation measures on regional scales.

Journal: Earth System Dynamics

DOI/Link : 10.5194/esd-16-1103-2025 

No, 170 Londoners Didnโ€™t โ€œDie of Climate Changeโ€ Last Week

According to Imperial College and the London School of Hygiene and Tropical Medicine, 170 Londoners died due to climate change in last weekโ€™s heatwave. But itโ€™s just more modelling make believe, says Ross Clark in theย Spectator.

From The Daily Sceptic

Byย Will Jones

According to Imperial College and the London School of Hygiene and Tropical Medicine, 170 Londoners died due to climate change in last weekโ€™s heatwave. But itโ€™s just more modelling make believe, says Ross Clark in the Spectator. Hereโ€™s an excerpt.

So, 260 Londoners died as a result of last weekโ€™s heatwave, of which 170 can be attributed to climate change. So claims Imperial College and the London School of Hygiene and Tropical Medicine.

Thereโ€™s just the one problem with this: the researchers havenโ€™t actually counted any deaths at all. The study rushed out this week is nothing more than a piece of modelling, which estimates the number of deaths which might be expected to have been caused by the hot weather, as well as trying to guess how much hotter last weekโ€™s weather was than it would have been without man-made climate change. We wonโ€™t know whether there really were any excess deaths during the hot weather until the Office for National Statistics (ONS) publishes its figures in a few weeksโ€™ time.

Why rush out a piece of modelling when we will shortly have some real-world data? The researchers will have to explain their reasoning, but it is as well to note that both the participants in this study have a bit of previous when it comes to modelling alarming numbers of deaths. 

Both were heavily involved in modelling during the Covid pandemic. Many of their predictions were not able to be tested against real data: we will never know, for example, whether 500,000 people really would have died of Covid were it not for social distancing measures โ€“ as Imperial College claimed in its paper of March 16th 2020 โ€“ because, of course, the government did impose a lockdown.

But towards the end of the crisis, one prediction was able to be tested against reality. On December 11th 2021, the London School of Hygiene and Tropical Medicine put out a paper claiming that 24,000 people would die as a result of the Omicron variant of Covid, with daily hospitalisations peaking above those in January 2021, unless the government introduced a return to lockdown -style measures. Perhaps it was counting on ministers taking its advice, but in the event the cabinet resisted โ€“ and the prediction was exposed for what it was: a gross exaggeration.

Worth reading in full.

Scientific American: AI is Power Hungry, but it Could Cut Emissions

The researchers claim โ€œbehavioural changeโ€ as a field where AI can help.

From Watts Up With That?

Essay by Eric Worrall

The researchers claim โ€œbehavioural changeโ€ as a field where AI can help.

JUNE 23, 2025

AI Could Be Harnessed to Cut More Emissions Than It Creates

Power-hungry AI and associated data centers could make the grid cleaner, eventually cutting more climate-change-causing emissions than they produce

BY SARA SCHONHARDT & E&E NEWS

CLIMATEWIRE | Artificial intelligence could cut global climate pollution by up to 5.4 billion metric tons a year over the next decade if itโ€™s harnessed in ways that would improve transportation, energy and food production.

โ€ฆ

โ€œThe key will be to channel practical AI applications towards key impact areas to accelerate the market adoption rate and efficiency of low-carbon solutions,โ€ the study said, noting that governments will have a vital role to play.

โ€œGovernments must regulate AI to minimise their environmental footprint,โ€ the study said, pointing to the need for energy efficient AI models and the use of renewable energy to power data centers.

โ€ฆ

The International Energy Agencyย projects that by 2030ย data centers will consume twice as much electricity as they do today. Growing energy demands are alreadyย challenging the U.S. grid, and oil companiesย are using AIย to find new areas to drill. BloombergNEF ย has said fossil fuelsย will provide most of the new power for data centers over the next decade, imperiling efforts to cut carbon pollution.

โ€ฆRead more:ย 

https://www.scientificamerican.com/article/ai-and-data-centers-could-cut-more-climate-change-causing-emissions-than/

The study referenced by the Scientific American article;

Green and intelligent: the role of AI in the climate transition

npj Climate Action volume 4, Article number: 56 (2025) Cite this article

Abstract

Artificial Intelligence (AI) can play a powerful role in supporting climate action while boosting sustainable and inclusive economic growth. However, limited research exists on the potential influence of AI on the low-carbon transition. Here we identify five areas through which AI can help build an effective response to climate threats. We estimate the potential for greenhouse gas (GHG) emissions reductions through AI applications in three key sectorsโ€”power, food, and mobilityโ€”which collectively contribute nearly half of global emissions. This is compared with the increase in data centre-related emissions generated by all AI-related activities.Read more:ย 

https://www.nature.com/articles/s44168-025-00252-3

One area where the researchers believe AI can help is โ€œnudging and behaviour changeโ€. From the study;

Nudging and behavioural change

Changes in lifestyle and consumer behaviour can reduce 40-70% of greenhouse gas emissions by 205013. Leveraging AI towards supporting more sustainable consumption patterns is important to enable a systemic shift. In the context of increasing global resource consumption (projected to go up 60% by 206023), optimisation of production will not be enough; demand must also adapt by promoting more sustainable lifestyles, conscious consumption and reducing overall environmental impact. However, despite growing awareness and willingness to act, consumers often struggle to identify the most climate-friendly options due to information asymmetry and inefficient market signals. Personalised recommendations can empower consumers to adopt low-carbon technologies by suggesting options that align with their needs while minimising their environmental impact.

The potential for AI to overcome psychological barriers and tailor interventions is also shown by examples in specific sectors. In the power sector, energy management is a key area where AI effectively drives sustainable consumer behaviour. Googleโ€™s Nest uses sensors, smart home systems, and AI-driven learning to optimise heating and cooling based on real-time weather and user preferences24. Similarly, Oracleโ€™s Opower combines AI with behavioural science to nudge energy savings through customer engagement25. By channelling complex data into clear, personalised recommendations, it helps to overcome cognitive limitations that hinder pro-environmental behaviour. The potential of technologies of this type is huge, as lowering thermostats by just 1 degree could save UK households ยฃ670 million annually and reduce CO2 emissions by 3.5 million tonnes26. โ€ฆRead more: same study as above

This theme is reinforced in the โ€œModelling climate systems and policy interventionsโ€ section.

โ€ฆ AI models can also be applied to better design and implement policies for climate action, by generating insights and predictions around complex climate policy scenarios or monitoring the effectiveness of policy implementation. The Climate Policy Radar, for example, uses AI to create open-source tools that assist governments in designing best-practice climate policies based on evidence from thousands of case studies30. A recent study used Machine Learning to analyse roughly 1500 climate policies implemented between 1998 and 2022 across 41 countries, to identify those that were able to reduce carbon emissions most effectively31.

Furthermore, AI can also contribute to developing new economic models that include โ€œBeyond GDPโ€ metrics (for a comprehensive review see Jansen et al.32). Policymaking has long focused on economic growth as measured by gross domestic product (GDP), diverting attention from other societal goals, such as sustainability, personal well-being and equality. Thanks to the ability of processing large and diverse types of datasets and running complex modelling tools, AI can help integrate โ€œBeyond GDPโ€ metrics into current macro-economic models. This could facilitate policymakers in making informed decisions that are directed towards shaping a sustainable and inclusive future. โ€ฆRead more: same study as above

To be fair, the examples the researchers gave were positive, about Winnow Visionโ€™s cameras helping commercial chefs to increase profits by reducing waste, and helping commuters find better routes to their destinations.

AI has the potential to help as much as it hinders regard to personal freedom โ€“ AI powered research tools could penetrate the fog of lies and help provide access to reliable information. This freedom AI concept at least has the potential to preserve the current status quo, if not improve consumer knowledge.

Of course, the central premise of the study, that AI has the potential to reduce emissions, seems utterly nonsensical given all the power plants which are springing up in response to the AI boom. If AI was reducing emissions, why would we need all the new power plants? Let me know when the power plant boom starts fizzling out, and we can re-evaluate whether AI is reducing the need for energy consumption faster than new AI data warehouses drive up demand for power.

BOMBSHELL: Study Reveals Climate Warming Driven by Receding Cloud Cover

The recent paper by Tselioudis et al., titled โ€œContraction of the Worldโ€™s Storm-Cloud Zones the Primary Contributor to the 21st Century Increase in the Earthโ€™s Sunlight Absorptionโ€, is a fascinatingโ€”and deeply problematicโ€”addition to the climate science canon. It offers yet another reminder that so-called โ€œsettled scienceโ€ in climate modeling is anything but settled. In fact, it inadvertently illustrates how fragile the predictive power of climate models is, especially when fundamental atmospheric processes like cloud coverage are shown to be both more dynamic and less understood than previously claimed.

From Watts Up With That?

From Charles Rotter

The recent paper by Tselioudis et al., titled โ€œContraction of the Worldโ€™s Storm-Cloud Zones the Primary Contributor to the 21st Century Increase in the Earthโ€™s Sunlight Absorptionโ€, is a fascinatingโ€”and deeply problematicโ€”addition to the climate science canon. It offers yet another reminder that so-called โ€œsettled scienceโ€ in climate modeling is anything but settled. In fact, it inadvertently illustrates how fragile the predictive power of climate models is, especially when fundamental atmospheric processes like cloud coverage are shown to be both more dynamic and less understood than previously claimed.

Not that any of this is news to WUWT readers. Dr. Roy Spencer has been noting almost identical observations for over a decade as noted here,

Now letโ€™s look at the broader scientific community catching up to Dr. Spencer.

Abstract

Recent Earth energy budget observations show an increase in the sunlight absorbed by the Earth of 0.45 W/m2 per decade, caused primarily by a decrease in cloud reflection. Here we decompose the solar radiative budget trends into general circulation and cloud controlling process components. Regimes representing the midlatitude and tropical storm zones are defined, and the trends in the areal coverage of those regimes which are potentially induced by circulation changes are separated from trends in the cloud radiative effect within each regime which are potentially induced by changes in local cloud controlling processes. The regime area change component, which manifests itself as a contraction of the midlatitude and tropical storm regimes, constitutes the largest contribution to the solar absorption trend, causing decreased sunlight reflection of 0.37 W/m2 per decade. This result provides a crucial missing piece in the puzzle of the 21st century increase of the Earthโ€™s solar absorption.

Key Points

  • Satellite observations show that in the past 24ย years the worlds storm cloud zones have been contracting at a rate of 1.5%โ€“3% per decade
  • This contraction allows more solar radiation to reach the Earthโ€™s surface and constitutes the largest contribution to the observed 21st century trend of increased solar absorption

Plain Language Summary

Analysis of satellite observations shows that in the past 24 years the Earthโ€™s storm cloud zones in the tropics and the middle latitudes have been contracting at a rate of 1.5%โ€“3% per decade. This cloud contraction, along with cloud cover decreases at low latitudes, allows more solar radiation to reach the Earthโ€™s surface. When the contribution of all cloud changes is calculated, the storm cloud contraction is found to be the main contributor to the observed increase of the Earthโ€™s solar absorption during the 21st century.

To understand the full implications of this study, we need to parse its findings in plain terms. The paper concludes that the Earth has absorbed significantly more solar radiation over the past 24 yearsโ€”0.45 W/mยฒ per decade. The primary culprit? A reduction in cloud cover, specifically a contraction of the midlatitude and tropical storm-cloud zones. This change has resulted in less solar radiation being reflected back into space and more being absorbed by the Earthโ€™s surface. Crucially, 0.37 W/mยฒ of this uptick is attributed solely to this contraction in cloud coverage, a result of large-scale atmospheric circulation changes:

โ€œThis cloud contraction, along with cloud cover decreases at low latitudes, allows more solar radiation to reach the Earthโ€™s surface. When the contribution of all cloud changes is calculated, the storm cloud contraction is found to be the main contributor to the observed increase of the Earthโ€™s solar absorption during the 21st century.โ€

Letโ€™s pause there. Climate science has long emphasized the role of anthropogenic greenhouse gasesโ€”especially CO2โ€”in trapping outgoing longwave radiation, contributing to surface warming. Yet here we have empirical satellite observations showing that changes in shortwave radiation absorption, due to cloud dynamics, dominate recent trends in Earthโ€™s energy imbalance. That revelation alone should be enough to shake the very foundations of climate policy, which has funneled trillions into carbon control with scant attention paid to cloud feedback mechanisms.

More damning still is the admission that these changes are likely tied to โ€œgeneral circulation shifts,โ€ specifically poleward movements of storm tracks and contractions of the Intertropical Convergence Zone (ITCZ). These are phenomena long suspected in model projections but never given such a central, quantifiable role in the planetary energy budget. And hereโ€™s the kicker: these circulation shifts are said to have emerged gradually, to the tune of 1.3% to 3% per decade:

โ€œIn all three zones, the area coverage of the Lโ€TCC regime shows statistically significant decreases with extremes of 1.84 ยฑ 0.38% to 3.20 ยฑ 0.97% per decadeโ€ฆ indicating a contraction of the midlatitude storm regions and a narrowing of the ITCZ region.โ€

These arenโ€™t theoretical projectionsโ€”they are based on hard satellite data from the MODIS and CERES instruments. Models, by contrast, have only roughly hinted at these changes, and often fail to reproduce them with consistency.

The paper outlines that most of the shortwave cloud radiative effect (SWCRE) changeโ€”the key measure of how much solar energy is reflected by cloudsโ€”comes not from changes in cloud properties themselves, but from the shrinking geographic area of major cloud regimes:

โ€œIn all zones, the dominant trend is the SW cloud radiative warming that is coming from the contraction of the Sโ€SWCRE regimes and the corresponding expansion of the Wโ€SWCRE regimes.โ€

Thatโ€™s the kind of subtle, high-leverage feedback mechanism that models tend to get wrong or underrepresent entirely. And thatโ€™s a problem. Because if your model canโ€™t accurately simulate cloud regime shiftsโ€”which appear to contribute more than 80% of the increase in solar absorptionโ€”then your forecasts for future warming are at best incomplete, and at worst, wildly misleading.

Tselioudis et al. even admit this shortcoming, noting:

โ€œIt is imperative to test the skills of climate models in simulating the observed stormโ€cloud area contraction, and to use both modeling and observational analyses to understand the interactions between atmospheric dynamics shifts and storm cloud changes.โ€

Thatโ€™s bureaucratese for โ€œwe didnโ€™t see this coming, and weโ€™re not sure our models can catch up.โ€ Itโ€™s reminiscent of NASAโ€™s Gavin Schmidtโ€™s recent handwringing over 2023โ€™s โ€œunexplainableโ€ heat spike, suggesting that โ€œwe could be in uncharted territory.โ€ Now, we have the chart. And it doesnโ€™t point toward CO2 aloneโ€”it points to dynamic, cloud-driven changes that no carbon tax will stop.

What this paper also inadvertently confirms is the unreliability of using long-term climate models to dictate aggressive, disruptive policies like Net Zero. The models are missing key physical processesโ€”cloud behavior, aerosol effects, and large-scale atmospheric shifts. As the paper notes:

โ€œThe general circulation shift component constitutes the dominant term of the recent increase in absorbed solar radiation and provides a crucial missing piece in the puzzle of the 21st century radiative warming and the large heat anomaly of 2023.โ€

Yet these shifts are only just beginning to be understood, and their driving forcesโ€”whether natural variability, solar activity, ocean cycles, or some interaction thereofโ€”remain far from nailed down.

Worse still, the authors openly speculate that low-latitude cloud reductions could be driven by aerosol changesโ€”particularly the decline in ship emissions:

โ€œThis component shows a significant cloud radiative warming of 0.21 W/mยฒ/decade that can be attributed to aerosol indirect effects on clouds including effects from the reduction of aerosol ship emissions.โ€

Thatโ€™s right: the same well-meaning efforts to reduce pollution from ocean-going vessels may have accelerated warming by allowing more sunlight to hit the surface. Climate mitigation whack-a-mole strikes again.

In sum, Tselioudis et al.โ€™s paper is a quietly revolutionary workโ€”not because it introduces a new alarmist narrative, but because it destabilizes the prevailing one. It shows that:

  • Cloud feedbacks, especially those driven by circulation shifts, have enormous and previously underestimated impacts on Earthโ€™s radiative balance.
  • These changes are driven by complex, poorly understood dynamics that current climate models struggle to replicate.
  • Policy decisions predicated on โ€œsettled scienceโ€ have been made in the absence of understanding a major component of the Earthโ€™s energy system.

If climate science were a functioning scientific discipline rather than a priesthood, this paper would trigger a major course correction. It would cast doubt on the simplistic link between CO2 and warming, redirecting focus toward cloud physics, ocean-atmosphere interactions, and circulation dynamics. It would foster humility in the face of atmospheric complexityโ€”not arrogance born from model outputs.

But donโ€™t expect that anytime soon. Instead, expect the usual suspects to spin this as evidence of โ€œeven worse than we thoughtโ€ warming, conveniently omitting the part where their models didnโ€™t predict it and their policies had nothing to do with it.

In the meantime, this paper should serve as ammunition for any skeptic pointing out the absurdity of building trillion-dollar policies on the backs of incomplete and overconfident simulations. The cloud regimes are shifting. The models arenโ€™t keeping up. And neither is the narrative.

Climate Clergy Livestreams the Sads

Itโ€™s not often one encounters a spectacle so rich in irony and unintentional comedy that it practically writes its own parody. Yet here we are, watching the โ€œWeather & Climate Livestreamโ€ (WCL)ย unfoldโ€”a 100-hour marathon of hand-wringing and bureaucratic bereavement that makes the average opera look stoic.

ChatGPT

From Watts Up With That?

By Charles Rotter

Itโ€™s not often one encounters a spectacle so rich in irony and unintentional comedy that it practically writes its own parody. Yet here we are, watching the โ€œWeather & Climate Livestreamโ€ (WCL)ย unfoldโ€”a 100-hour marathon of hand-wringing and bureaucratic bereavement that makes the average opera look stoic.

Launched with all the solemnity of a state funeral, the WCL is the alarmistโ€™s answer to QVC. Instead of selling miracle blenders, theyโ€™re peddling fear, nostalgia for the heyday of bloated climate budgets, and a heaping spoonful of institutional self-pity. The official pitch? A โ€œnon-partisanโ€ event dedicated to โ€œeducating the publicโ€ about the catastrophic consequences of proposed federal budget cuts to climate research. The reality? A long, monotonous group therapy session for government scientists afraid their gravy train has hit a fiscal cul-de-sac.

The pageantry of this livestream is nothing short of remarkable. With a tone oscillating between funeral dirge and telethon, theyโ€™ve assembled a lineup of federally funded forecasters, former agency heads, and token youth activists to warn of a future where hurricane forecasts are slightly less preciseโ€”unless, of course, Congress acts now to restore their budgets to previously unchallengeable levels. Itโ€™s like watching a PBS pledge drive hosted by Chicken Little and Greta Thunbergโ€™s ghostwriter.

Whether itโ€™s tomorrowโ€™s temperatures or the sea level in fifty years, Americans need to plan for our futures. For generations, the US government has invested in the science that helps us do so, building one of the greatest meteorology and climate science communities in the world.

https://wclivestream.com/

Take, for example, the session titled โ€œLive from the last hours in the NASA GISS lab.โ€

Youโ€™d think from the name that the building was literally collapsing under rising sea levels, not merely facing administrative restructuring. But for the GISS faithful, reduced funding is indistinguishable from Armageddon. Itโ€™s the end of the world, not because of climate change, but because their climate change funding is on the chopping block.

Former directors of the National Weather Service make appearances to share tales of days gone by when budgets were fat, forecasts were vague, and accountability was optional. โ€œPeople donโ€™t realize,โ€ one panelist intoned with practiced gravitas, โ€œthat this is about saving lives.โ€ No mention, of course, of the many billions already spent over the decades on climate modeling efforts that continue to beโ€”how to put this politelyโ€”spectacularly inconsistent with observed reality. No mention of the vast sums funneled into agencies that produce redundant data sets or spend years refining models that canโ€™t agree on whether your grandkids will need parkas or parasols.

This livestream extravaganza is being promoted as a grassroots movement, but like all good astroturf campaigns, itโ€™s deeply establishment. The message is clear: only by maintaining the current bureaucratic caste can Americans be kept safe from the wrath of Mother Nature.

Letโ€™s strip this to the studs. The underlying assumption of this whole production is that the American public owes eternal fealty to the climatariat. Never mind that private sector meteorology and open-source climate data analysis have made enormous strides. Never mind that redundancy, inefficiency, and mission creep are rampant within federal climate programs. The WCLโ€™s cast of worried scientists demands not only your attention but your unquestioning financial support.

But itโ€™s not too late to stop these cuts. Already, public pressure has helped to reopen shuttered weather data centers. To help keep this pressure building, meteorologists and climate scientists from across America want to fulfill our mission by sharing our science with you โ€“ so weโ€™re coming to your screens, speaking and answering your questions, for over 100 hours, in this science-filled, non-partisan event:

https://wclivestream.com/

You see, budget cuts are a threatโ€”not to the climate, but to their social status and sinecures. They claim these cuts could โ€œendanger livesโ€ during hurricane season. But what really endangers lives is blind faith in centralized planning, especially when itโ€™s masquerading as empiricism. The dirty little secret no one on the livestream wants to admit is this: weather forecasting and climate research are not going to disappear. They are evolving, often improving, and increasingly taking place outside the sclerotic confines of federal bureaucracy.

Still, the participants have latched onto the time-honored activist formula: crisis equals cash. Like a televangelist promising salvation for a donation, they urge viewers to โ€œcall your repsโ€ and demand the restoration of their preferred budget lines. Itโ€™s science, they insistโ€”just ignore the political theater, the emotional appeals, the relentless narrative-building. Ignore the fact that their models canโ€™t even retroactively predict the 20th century without massive fudge factors.

As a viewer, itโ€™s hard not to be struck by the theatrical nature of it all. The staging, the graphics, the sorrowful piano musicโ€”everything short of a candlelight vigil. But then again, this is the climate establishmentโ€™s version of a wake. The end of unquestioned funding is treated as a death. And like all good funerals, thereโ€™s a donation plate.

It would be funny if it werenโ€™t so tragically manipulative. These arenโ€™t starving scientists operating from a garage. They are some of the most institutionally entrenched figures in modern science. And yet, they present themselves as delicate visionaries under siege, whose only salvation lies in another congressional spending spree.

What makes this even more absurd is that the very same crowd has been telling us for decades that the climate crisis is โ€œexistential.โ€ That weโ€™re running out of time. That the tipping point is just five years awayโ€”forever. And now weโ€™re meant to believe the apocalypse hinges on whether a few federal jobs at NASA and NOAA are consolidated or defunded?

If the โ€œexistential threatโ€ can be averted by phoning your senator and asking for a $500 million line-item reinstatement, perhaps it was never so existential in the first place.

The truth is simpler: the climate industrial complex is adapting to a new political reality. One in which skepticism of bloated bureaucracies is growing, and where climate alarmism no longer guarantees a blank check. The WCL livestream isnโ€™t a cry for helpโ€”itโ€™s a tantrum. A carefully choreographed public meltdown meant to preserve the status quo under the guise of saving the planet.

So let them livestream the sads. Let them sing mournful songs for the climate programs of yesteryear. Meanwhile, the rest of us will continue demanding science over sentiment, cost-benefit over catastrophe theater, and reform over reflexive largesse.

Because unlike the WCL crowd, we understand that real climate resilience comes not from a 100-hour pity party, but from sober, empirical, and above all skeptical inquiry. And no amount of livestreaming can replace that.

Make sure to tune in.

Bloombergโ€™s $87 Trillion Carbon Fantasy: When Climate Modeling Meets Magical Thinking

Mark Gongloff, an opinion columnist at Bloomberg, recently wrote a piece titled โ€œCorporate America Owes the Rest of Us $87 Trillion.โ€ In it, he claims U.S. companies are causing carbon-related social damages worth 131% of all corporate equity and three times Americaโ€™s GDP. All based, of course, on models, not measurements.

From Watts Up With That?

By Charles Rotter

Mark Gongloff, an opinion columnist at Bloomberg, recently wrote a piece titled โ€œCorporate America Owes the Rest of Us $87 Trillion.โ€ In it, he claims U.S. companies are causing carbon-related social damages worth 131% of all corporate equity and three times Americaโ€™s GDP. All based, of course, on models, not measurements.

โ€œThe social cost of the carbon emissions of US companies will amount to a cool $87 trillion through 2050.โ€ โ€” Mark Gongloff, Bloomberg

Thatโ€™s not analysis. Thatโ€™s climate-themed performance art.

The core of this fantasy is the โ€œsocial cost of carbonโ€ (SCC), a figure so malleable it practically defines policy-based evidence. Gongloff acknowledges the controversy:

โ€œThat hasnโ€™t been easy or uncontroversial.โ€

Indeed. Under Trump, the SCC was $1/ton. Bidenโ€™s EPA pushed it up to $190/ton, conveniently aligning with Net Zero mandates. Gongloff prefers the high endโ€”naturally. The study he cites by Lubos Pastor and Wharton School colleagues simply plugs this inflated SCC into an economic model andโ€”presto!โ€”out comes a multi-trillion-dollar guilt trip for corporate America.

The trick is simple: pick a damage number, apply it across a long enough time horizon, assume compounding effects, and declare catastrophe. Thatโ€™s not economics. Itโ€™s speculation wearing a necktie.

Gongloff sets up skeptics as indifferent obstructionists:

โ€œModern deniersโ€ฆ fire back that the โ€˜do something about itโ€™ part is too hard, too expensive to be worth trying.โ€

This is the typical bait-and-switch. Skeptics arenโ€™t denying costsโ€”theyโ€™re questioning whether proposed solutions are worse. Germanyโ€™s disastrous energy transition, skyrocketing prices, and blackout risk demonstrate what happens when you ignore reality in favor of renewable fairy tales.

Gongloffโ€™s version of pragmatism?

โ€œBeing truly pragmatic means leaving fossil fuels behind as quickly as possible.โ€

Thatโ€™s not pragmatic. Thatโ€™s blind faith. Oil, gas, and coal still supply over 80% of global energy. The โ€œjust transitionโ€ isnโ€™t happeningโ€”because it canโ€™t without destroying the economy.

In a particularly deranged twist, Gongloff endorses holding companies responsible for emissions they donโ€™t even directly produce:

โ€œMost of that falls under the category of โ€˜Scope 3โ€™ emissionsโ€ฆ the gasoline burned in cars and the natural gas burned in homes.โ€

So now energy producers are to blame for how consumers use their product? This isnโ€™t justiceโ€”itโ€™s ex post facto criminalization. Under this logic, Ford is responsible for traffic, and McDonaldโ€™s for your waistline.

It also forms the foundation for climate lawsuits, which Gongloff promotes:

โ€œNew York state and other places are pushing for polluters to kick into โ€˜Climate Superfunds.โ€™โ€

This isnโ€™t accountability. Itโ€™s green Marxism, thinly disguised as reparative economics.

Gongloff writes:

โ€œ$192 trillion is a bargain relative to the potential costs.โ€

Only in a fantasy world where averted damages are based on inflated assumptions, infinite foresight, and zero economic friction. BloombergNEF, the source for this figure, assumes global coordination, endless spending, and perfect deployment of technologies still in the prototype phase.

Thereโ€™s no acknowledgment of risk, trade-offs, or unintended consequences. Just more money, more control, more modeling.

Gongloff even dusts off the IMFโ€™s infamous claim:

โ€œThe fossil-fuel industry gets $7 trillion in government largesse every year.โ€

This number is fake. It counts the absence of carbon taxes as a โ€œsubsidy.โ€ If governments donโ€™t charge you an imaginary fee, thatโ€™s now a handout. Itโ€™s like calling your paycheck a gift because the government didnโ€™t seize it.

Real direct subsidies to fossil fuels are minimal. But the green energy industry? Thatโ€™s a subsidy black hole, endlessly gorging on mandates, tax credits, and bailouts.

Gongloff sums it up:

โ€œAdd it up over 25 yearsโ€ฆ and $87 trillion starts to seem like a low bid.โ€

Of course it doesโ€”when the number is built on circular logic, unprovable assumptions, and the moral conviction of a missionary. This isnโ€™t journalism. Itโ€™s climate absolutism wrapped in pseudo-economics.

And the real danger isnโ€™t the carbon. Itโ€™s the crusade to control human behavior, dismantle prosperity, and punish the very systems that made modern life possibleโ€”all in the name of speculative models.


Let the marketsโ€”not modelersโ€”guide our energy future.