Global warming, climate change, all these things are just a dream come true for politicians. I deal with evidence and not with frightening computer models because the seeker after truth does not put his faith in any consensus. The road to the truth is long and hard, but this is the road we must follow. People who describe the unprecedented comfort and ease of modern life as a climate disaster, in my opinion have no idea what a real problem is.
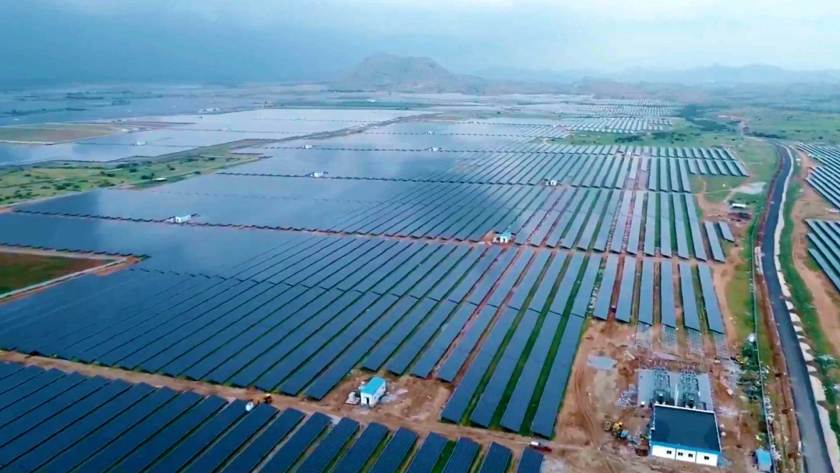
The recent demolishing of another Solar Farm, this time in Texas, means the meteorological community, if they had a lick of objectivity, should be pushing for temperature sensors as a requirement for the solar farms.
The recent demolishing of another Solar Farm, this time in Texas, means the meteorological community, if they had a lick of objectivity, should be pushing for temperature sensors as a requirement for the solar farms. This illustration:
from a Twitter handle, True Science illustrates precisely the concern. That we are creating a version of Heat Island on steroids with absolutely no regard for the impact. Have studies been done? They can’t be complete since the sample size has been so small. Yet it makes sense that if you want to replace the natural environment with an artificial one, there are going to be consequences.
It is akin to rushing forward with a vax with no long-term study or proof. There are going to be unintended (or perhaps, in this case, intended, since these things increase warming) consequences. See yet another COVID/ Climate link.
I propose that it be REQUIRED that weather stations be established at a height of 6 feet above the paneling to find out exactly what is going on with these. In an effort to “save” the environment”, it is entirely possible such large farms are harming it, or at the very least, the area that was once likely home to some form of vegetation and wildlife, if not an entire field of crops is being disrupted if not destroyed.
I recently went by car to Kansas City for the NCAA wrestling tournament and was alarmed at the number of open spaces paved over with panels. Why not just plant trees, given that each tree gets rid of 50 lbs of CO2? Trees have a cooling, not warming, effect. It’s the opposite of what these large farms do.
I don’t care what your stance on CO2 is, paving over large areas of what was open land subject to whatever nature had to provide and replacing it with what are urban heat islands on steroids IN RURAL AREAS is not being a good steward of the environment. It contributes extra warmth and is likely a magnet for enhanced severe weather. And I have to wonder if that is an intentional side effect. Of course, severe weather chasers may be dancing in the streets, but one has to wonder what is going to happen if insurance companies pick up on what might go on, that the very thing they are insuring these places from acts to increase the frequency of that occurrence.
One place we should never put these solar farms is anywhere near airports, given how they can impact the area. Airports with all their concrete now do so, but changing vertical velocity patterns on runway approaches is an invitation for problems.
Has anyone even done an environmental impact study on all this? If so, why is the lack of sensors and data-gathering instruments on these farms not a major issue?
As if we don’t have enough problems, we have people creating ways to fix a problem that isn’t there and, by doing so, creating problems. Where have we seen that before?
I am not anti solar panel. I like the idea of putting them on houses, for instance, as it empowers the individual to use that source for energy and cut down on his bills. And if you want to say you are lowering your carbon footprint, have at it.
But it’s another case, like my whole geothermal argument, where there is an avoidance of gathering data needed to see exactly what is going on. By ignoring that, it gives them a way to plausibly deny ( where have we heard that?) the source region of the real problem. And it is all because of a phony climate war.
Arctic sea ice extent as recorded by Germany’s Alfred Wegener Institute (AWI) in Bremerhaven, Germany, looks at the situation in January 2024. Despite the record temperatures reported, the ice in the Arctic has recovered somewhat.
The slight recovery trend since the Arctic minimum was reached is continuing at the beginning of 2024, with the sea ice extent at the beginning of the year below the average value for the years 1981 – 2010, but in the lower range of the extreme values (minimum / maximum) of this international climate normal period (Figure 1).
If we look at the new reference period 1991 – 2020 introduced by the World Meteorological Organization in 2021, January 2024 is roughly in line with the mean value of this period (see interactive graphic). The average Arctic sea ice extent in January was 13.99 million square kilometers, around 400,000 square kilometers greater than the ice cover in January over the last 20 years (Figure 2). During the month, the extent increased by approximately 29,000 square kilometers per day, which was slower than the average increase from 1981 to 2010.”
Image: Screenshot Meereisportal.de
Among highest in past 20 years
The above chart indeed shows a stable trend over the past 2 decades. According to the AWI:
This year’s maximum sea ice extent most likely occurred on February 27, at 14.94 million square kilometers. The monthly average ice extent in February was 14.65 million square kilometers.”
That makes it higher than 15 of the past 20 years.
Compared to the long-term average for the years 2003 – 2014, it is noticeable that the sea ice cover in the northern Barents Sea is lower, but the Greenland Sea and the northern Baltic Sea in the Gulf of Bothnia and the coastal zones of the Barents Sea have more extensive sea ice areas. This indicates lower and longer-lasting cold periods in these regions.”
Between 2019 and 2022, industries charged with generating U.S. electricity reduced their CO2 emissions by 85.3 million tons (4.7%), dropping them from 1830 to 1745 million tons (EPA eGRID Data Explorer).
Was this reduction attributable to the large-scale installation of solar panels and wind turbines?
Between 2019 and 2022, industries charged with generating U.S. electricity reduced their CO2 emissions by 85.3 million tons (4.7%), dropping them from 1830 to 1745 million tons (EPA eGRID Data Explorer).
Was this reduction attributable to the large-scale installation of solar panels and wind turbines?
Holding geothermal, biomass, hydro, and nuclear generation constant, there are three ways to reduce grid CO2 emissions:
by generating less power, as France, Germany, the United Kingdom, and Japan have done;
by replacing coal generation with natural gas or, in theory, and
by increasing renewables while proportionally reducing fossil fuel-based generation.
The first method does not apply to the US because, during this period, the nation increased electricity consumption by 100 TWh (0.6% per year).
The second method does apply, as coal-fired generation emits about 2.5 times more CO2 than natural gas per MWh, and while coal-fired generation declined by almost 20%, gas-fired generation increased by more than 6%.
The third method – adding wind and solar power to the grid – should be regarded with suspicion. It is not necessarily true that replacing 1 MWh of renewable generation by 1 MWh of fossil fuel-based generation will reduce CO2 emissions from the grid. Depending on the technology and fuels used for backup, emissions may even increase significantly, which is the exact opposite of what was intended. Promoters of wind and solar power usually attribute any reduction in grid CO2 emissions solely to windmills and solar panels, which emit no CO2 at the point of use. However, wind and solar power require thermal generation backup at all times, so there will still be electrical power when the wind drops or the sun sets.
However, apart from being costly and inefficient, thermal sources that are kept running at continuous spinning reserve so they can ramp up when needed will emit more CO2 than when operating normally. It is, thus, necessary to account for the emissions from backup generation, whereupon wind and solar power cease to be zero-emission power sources.
Table 1 shows US CO2 emissions reduction attributable to wind and solar generation on the idealized assumption that only natural gas generation (the most efficient source) is used as a backup. Emissions abatement is CO2 emissions with the current renewable generation fraction (table 3 below), less emissions without renewables (shown here in tons as well as in percentages of US grid emissions, US emissions from all sources, and global emissions from all sources). US emissions are based on data provided by the EPA.
It turns out, however, that in the US, not only natural gas in combined-cycle plants but also simple-cycle gas turbines, as well as oil and even coal, have been used to back up the grid. Therefore, emissions are much less than that produced by combined-cycle gas backup alone since CO2-output emission rates for the other forms of thermal backup are significantly higher than those of natural gas in combined-cycle plants. Table 2 shows the actual outcome:
It is remarkable that hundreds of billions of dollars in expenditure on wind and solar power over a 20-year period have cut U.S. CO2 emissions by only 0.3% and global emissions by 0%.
What is worse is that for the period from 2019-2022, for every 1 TWh of coal-generation capacity dismantled in the US, China and India have added 5.6 TWh of coal-fired generation.
Furthermore, there is a limit above which any additional wind and solar power will be lost, thereby ceasing to reduce CO2 emissions, unless absurdly expensive lithium-ion batteries or green hydrogen absorb the surplus generation. That limit is reached when the fraction of total grid output generated by wind and solar power exceeds the annual weighted-average- capacity factor, that is when the installed nameplate capacity of unreliables matches the annual mean hourly demand on the grid.
Table 3 shows two different renewable-generation fractions. The first, the ratio of annual wind and solar generation to total US annual generation from all sources, is usually used to show the degree of progress towards net zero. Thus, the US should still have plenty of room to continue plaguing its territory with unreliables because it seems to be far from its green generation limit of, erroneously imagined, 100%.
For technical reasons, coal, geothermal, biomass, run-of-the-river hydropower, and nuclear power are largely used for baseload generation. Therefore, to establish how far a national grid is from its limit on wind and solar generation, the correct generation fraction is the ratio of annual wind and solar generation to total thermal generation suitable for backup, that is, oil and natural gas.
Although highly expensive reservoir-hydropower stations are well-suited for this purpose, they were designed to satisfy demand rather than backup unreliables. Besides, from 2019 to 2022, U.S. hydropower generation dropped by 12%.
In any case, if used as such, from where would the missing generation come when backing up solar panels rather than supplying for demand? Oh yes, from oil and gas generation. Thus, in Table 3, one must consider renewable generation as a percentage of oil and gas generation (row 2) rather than that of total generation (row 1). On that basis, the US almost reached the limit on generation by unreliables in 2022. It is very likely that that limit was exceeded in 2023. The US, like Europe, may as well have joined the grid-killing unreliables’ club.
What happens next?
While in 2019, there was still some slack for increasing wind and solar generation, from 2023, there will no longer be any. Hence, on the US grid, there will be no further reductions in CO2 emissions. The cost of electricity will continue to rise, aggravated by the introduction of costly and damaging European-style market interferences, such as cancellation, curtailment, or constraint orders that have the effect of subsidizing wind and solar generators for non-existent additional power at the expense of customers.
The worst is yet to come, however. If reliable and affordable thermal generation, essential for backup, continues to be foolishly dismantled without regard to the renewable generation limit, from here on, we face the likelihood of nationwide, Texas-like blackouts.
As a direct result of the enormous cost of net-zero policies in the US, including the dismantling of sound, coal-fired power stations and the installation of windmills and solar panels, coupled with the large on-costs to the rest of the grid, domestic electricity prices in the US are already double those in China and India, two-and-a-half times those in Russia, and triple those in Pakistan.
Meanwhile, China permitted 43 new, 2-GW coal-fired power stations in 2023 alone to add to its existing fleet, which is now approaching 1,200 power stations. Russia has almost no wind or solar generation. India is increasing its coal-fired fleet by 60% and Pakistan by 300%.
When Donald Trump described Biden’s electric vehicle mandates as leading to a “bloodbath” for the auto industry, the liberal media went nuts, declaring his use of the term was to warn of riots if he were to lose the 2024 election.
When Donald Trump described Biden’s electric vehicle mandates as leading to a “bloodbath” for the auto industry, the liberal media went nuts, declaring his use of the term was to warn of riots if he were to lose the 2024 election.
Rather, he was referring to a different sort of mass bleeding that will involve auto workers and suppliers who will lose good-paying jobs through layoffs.
Anticipate a public revolt as EV mandates force auto manufacturers to produce cars and trucks they want to be more expensive to subsidize economic losses on vehicles that cost more and do less.
Consider a consumer uprising as a politically weaponized EPA with bleeding-heart climate delusions interferes with the great American automotive love affair with free-market choices that match requirements and preferences.
And that’s already happening.
On March 20, the Biden EPA issued a vehicle tailpipe rule, which amounts to a coerced 70% phaseout of gasoline-powered cars by 2032.
This forced “transition” to all-electric plug-ins comes at a time when the U.S. market for EVs has tanked following an early burst of enthusiasm.
Nevertheless, the government’s push-through regulations, and pull by taxpayer subsidies and purchaser credits, forced automakers to either immediately get into the EV game with huge change-over investments or lose out to competitors who did.
Whereas admittedly lacking an adequate national recharging infrastructure to meet schedule requirements EPA had initially proposed in April 2023, the end goal remains the same.
According to the new rules, an estimated 31% to 44% of new light-vehicle sales would need to be electric for model year 2030, rather than the 60% mark originally set.
The total percentage of EVs required to be sold would then depend upon total tailpipe exhausts from all vehicles, including gas-electric hybrids along with traditional gasoline and diesel models.
By comparison, 84% of all cars sold in America are powered by internal combustion engines.
Another Biden administration term will restrict that share to 64% by 2027.
Keep in mind that “the Biden plan,” which affects only the U.S. with 12% of the global fleet (0.36% total), swapping out a gasoline engine for a battery eliminates, at best, only half of lifetime emissions (0.18%).
Even that small benefit assumption is dubious since as experienced in Norway, every electric vehicle doesn’t displace a conventional one, and every electric mile driven doesn’t displace a gasoline mile.
According to observations by Morgan Stanley, the country saw no decline of oil consumption related to EVs, though users receive thousands of dollars in annually recurring subsidies, and EVs accounted at the time for 64% of new-car sales.
And whereas it was once cheaper to fuel up an EV than a gas-powered car, this is no longer true either.
With no thanks to the Biden administration’s other force-fed “green renewable” transition, which has raised electricity prices, fueling a Ford F-Series truck now costs about $17 per 100 miles on average compared to $17.75 for an F-150 Lightning with primarily home-charging — and $26.39 with primarily commercial chargers.
In many cases, EVs make absolutely no utility sense at any price.
Don’t count on them to get you anywhere under bitter cold Wisconsin, Minnesota, or Alaska winter conditions.
Forget them as an essential means to work a Kansas farm, haul horses on a Texas ranch, tow a boat to the lake, or go remote off-road camping.
Little wonder that when pollster Scott Rasmussen recently asked how respondents viewed new “regulations that would effectively outlaw the manufacture and sale of gasoline-powered cars,” only 14% were strongly in favor.
Nearly 60% of those surveyed were opposed, with a slight majority of Democratic voters (53%) favoring the idea and 59% of independents and 76% of Republicans against it.
Auto dealers don’t like the ban either.
Decrying the EPA rule as “completely unrealistic,” more than 5,000 of them signed letters to Biden in an organized campaign to back off on emission targets due to insufficient EV customer interest.
EVs are now some of the slowest sellers on dealership lots.
Last September, it took retailers over two months to sell a plug-in, compared with around a month for gas-powered vehicles and only three weeks for a gas-electric hybrid.
Lower sales will hemorrhage jobs for Detroit auto and supply chain parts workers, with lower revenues additionally bleeding employee profit-sharing bonuses.
EVs also make U.S. carmakers heavily dependent upon rare earth materials from China — an unthinkable national security and economic hazard.
Republicans brought two car-freedom Preserving Choice in Vehicle Purchases Act bills to the House floor last fall, picking up eight Democratic supporters in one and five in the other.
So, let’s hope for a real bloodbath in November White House and congressional elections — a ballot revolution against all big-government-knows-best assaults on free market choices.
It is more than a little disturbing when a major regional newspaper (the Seattle Times) provides demonstrably inaccurate and deceptive weather and climate information.
But yesterday, the infamous Seattle Times ClimateLab did it again.
The first lines of the article describe the past year in apocalyptic terms:
Virtually every aspect of life in Washington suffered during last year’s drought.
Groundwater wells ran dry, fields produced fewer crops, trees died in greater numbers, fish faced disease and famine
And the next paragraph paints a very dark picture of our future:
Now those sectors are bracing for yet another poor water year as El Nino conditions, compounded by climate change, produced well below normal snowpack. The state also has recently hit record-high temperatures for this time of year.
The state’s water woes will continue, even worsen, in the decades ahead.
Has the state been in a terrible drought that has seriously impacted agriculture, causing fish to face famine, and causing regional water shortages? And are other claims of this article true, such as high temperatures causing terrible losses in the State’s cherry crops?
Most of the claims are factually wrong.
The article was accompanied by a picture of a Rattlesnake Lake, which looked like a scene from the moon. They did not mention that this is an artificial lake controlled by Seattle Public Utilities.
So are we in some terrible drought that caused state agriculture to fail?
Absolutely not. The 2023 state apple crop was huge under near-perfect conditions (28% above 2022). Apples are the state’s number one crop.
The number two WA crop is milk and 2023 tied the record-breaking amounts in 2022.
The number three WA crop is potatoes, which had a 9.5% increase over 2022.
Doesn’t sound like agriculture took too much of a hit from the Seattle Times’s drought.
But what about the cherry crop you ask? The Seattle Times states:
sudden melt-off (of snow in May 2023) sent the state’s sweet cherry growers into an early harvest, causing perhaps $100 million in losses.
It turns out the truth was a bit different. The Washington State cherry crop was very large and high quality. The problem was the cool, wet weather resulted in a bumper, late crop in California that suppressed prices.
So low that Washington cherry farmers left a lot of the crop on the trees. So it was the OPPOSITE of drought in California that caused problems for Washington State farmers. Lots of snow and rain in the “Golden State”
The Seattle Times describes famine times for fish, but salmon returns were UP for all areas of Washington State.
So are we in a drought right now?
The accumulated precipitation at Seattle for the past year is nearly normal (green is this year, brown is normal):
Portland was wetter than normal.
What about Yakima on the eastern Cascades slopes? Near normal.
Doesn’t look like much of a drought. Yes, the snowpack is less this year because temperatures were warmer than normal for a while (due to El Nino, NOT climate change).
But the amount of water falling from the sky was near normal and many reservoirs stored more water than usual.
Seattle’s reservoirs are above normal (see below)
And the same is true for Everett’s large Spada Lake reservoir:
Surely, if the Seattle Times is correct, river levels would be at very low “drought” levels.
Maybe not. The streams on the “dry” eastern slopes of the Cascades are running high (see below). Nearly normal streamflow conditions on the western slopes of the Cascades. The only streams running low are around the South Sound area.
In summary, Seattle Times ClimateLab articles are not doing anyone a favor by telling tall tales about drought and climate change. El Nino conditions are evident right now, with low snowpack but near normal precipitation. Agriculture is not collapsing. Precipitation is near normal.
“Angry and frustrated” parents say their young children are going cold as heating costs on an Isle of Wight housing estate skyrocket to ‘unaffordable’ rates.
“Angry and frustrated” parents say their young children are going cold as heating costs on an Isle of Wight housing estate skyrocket to ‘unaffordable’ rates.
Residents of Bluebell Meadows and St George’s Gate claim they have been ‘lied to’ and feel ‘let down’, having been promised cheap bills and houses which were economical to run.
Residents faced soaring costs Despite the estate using a unique biomass heating system — a centralised system which burns wood chippings to provide heat and hot water to homes — those living there say they have faced soaring costs in recent months.
Those responsible for the estate — Barratt David Wilson Homes, the Isle of Wight Council and Sovereign Network Group, which together form the Pan Management Company — say the surge in prices “reflect the handover of the biomass centre” to the estate management company.
In a joint statement, they said they were looking at the fuel supply arrangements to try to help reduce costs.
Lack of proper answers Residents claim there has been a lack of “proper answers” and a meeting for residents arranged earlier this year was cancelled.
Mum-of-one, Amy, 28, is among those who have been calling for accountability.
In December, she said she was “mortified” to see her bills more than double, from £38 to £100 a month.
“There is only so much wrapping up in clothes and blankets you can do” Amy said residents were ‘trapped’ and could not switch energy providers.
She said,
“Like many others on the estate, one of the main reasons I purchased a new build Barratts home was because of their unique selling point – the homes were economically efficient to run and now I can certainly say that is not true.
“I understand bills are going up, I expected them to, but not this much. Me and my little one have been really ill this past winter and there is only so much wrapping up in clothes and blankets you can do.”
Another resident, Louise, says she has had to buy electric heaters for her house but still has to pay her standing charge, which like other prices, has risen.
She said,
“I just want to heat my house without having to worry how I would have to pay for it.”
Told biomass system was the “most economical choice” Meanwhile, resident Tina said when she moved in four years ago she was told the biomass system was the “most economical choice”.
Now it is ‘just ridiculous’, she said, as there is no protection for residents as Pan Energy is not regulated with Ofgem, meaning there is no price capping.
The discovery of a hole in the ozone layer high above Antarctica in the 1980s turned into one of the first great climate and environmental scares. Blame was placed on the effect of chlorofluorocarbons (CFC) which were used extensively at the time in refrigerators and aerosols, and their use was banned by the Montreal Protocol from 1989.
The discovery of a hole in the ozone layer high above Antarctica in the 1980s turned into one of the first great climate and environmental scares. Blame was placed on the effect of chlorofluorocarbons (CFC) which were used extensively at the time in refrigerators and aerosols, and their use was banned by the Montreal Protocol from 1989. Climate activists learnt the lesson from this example and have been whipping up global fear ever since. Over the years, constant war has been waged on numerous industrial and agricultural products and processes with calls to ban some of the food we eat to demands we restrict our movements. But at least we saved the ozone layer. Actually, we didn’t. Since 2002 there has been a significant ozone reduction amounting to a 26% loss in the core of the ozone hole.
A recently published science paper by three New Zealand-based physicists notes that the three years 2020-22 have witnessed the re-emergence of large, long-lived holes over Antarctica. The scientists note that in the eight years to 2022, five of the years showed similarly large temporary holes occurring in the spring months. In 2023, the European Space Agency said the hole over Antarctica was one of the biggest ever recorded, measuring 26 million sq kms. This was noted to be roughly three times the size of Brazil. All this is despite the fact that CFCs have been slowly declining in the atmosphere for nearly 30 years.
It is beyond the scope of this article to investigate whether the banning of CFCs has had any positive effect on ozone, although the data we now have might suggest an over-egging of the climate pudding. What we do know is that the CFC ban was totemic for climate activists. It gave a green light for launching multiple scare campaigns. The claimed global success in stopping CFC emissions and repairing the ozone hole was the template for promoting all the changes that will be required to complete the Net Zero collectivist project. Speaking in 2020, the UN Secretary-General Antonio Guterres said the ozone treaties were “inspiring examples” of political will. “Let us take encouragement from how we have worked together to preserve the ozone layer and apply the same will to healing the planet and forging a brighter and more equitable future for all humanity,” he added.
Needless to say, the continued presence of the ozone hole, in reality a thinning of the layer, is not much discussed these days in the mainstream media. In fact the lessons from the ozone scare were well learnt in these quarters as well, and an almost daily diet of climate catastrophisation is fed to readers. So perish the thought that banning CFCs didn’t actually work – perish the thought that the same outcome might await impoverished global populations once industrialisation is dismantled by banning all hydrocarbons.
It would seem that more valuable lessons can be learnt about the effect of natural variation. The discovery of ozone layer thinning in the late 1970s was a dramatic event, and the ‘hole’ was almost immediately attributed to the use of CFCs. Little work has been done to discover whether this was a one-off problem specifically caused by the effect of CFCs, or if ozone thinning is a largely natural and regular event. Using data, admittedly sparse, from a number of weather sources, the independent researcher Michael Jonas has plotted the following graph.
According to Jonas, the South Pole data for the peak time around October shows there were ozone holes before 1979. The figures on the left are Dobson units, used to measure ozone concentrations. The average around the planet is about 300 Dobsons, while anything less than 220 is considered a hole. The thinning episodes before 1979 may have been less pronounced than in recent years, concludes Jonas, but they occurred in 1964, 1966, 1969, 1974 and 1977.
It is reasonable speculation to suggest that ozone thinning has long been a feature in this part of the southern hemisphere. The thinning is a temporary event in the Antarctic spring, and normal levels resume by December. The New Zealand scientists identify numerous natural forces that seem to affect ozone depletion. Springtime temperatures and wind patterns are said to “greatly impact” ozone hole development, along with aerosol loading from wildfires and volcanic eruptions as well as changes in the solar cycle. Dynamic changes from the higher reaches of the atmosphere within the polar vortex are also noted.
CFCs can remain in the atmosphere for a number of years, but steadily reducing levels seem to have had little or no effect on the recent regular appearance around October of massive holes, some of the largest in almost 50 years of recording. Scientists have been pushing back the ‘recovery’ of the hole until 2065, but the New Zealand researchers suggest that in the light of their work there may be further delays.
In other words, it is anyone’s guess.
Chris Morrison is the Daily Sceptic’s Environment Editor.
President Biden’s EPA is working to accelerate the shutdown of coal plants across the U.S. and to force the demise of Internal Combustion Engine. This is about as Un-American as anything I have ever heard or read.
“Thank you Hawaii Electric for providing this outstanding example of applied renewables. My state of South Carolina and neighboring states are planning similar renewables plus battery storage. Your experiences are helpful.”
President Biden’s EPA is working to accelerate the shutdown of coal plants across the U.S. and to force the demise of Internal Combustion Engine. This is about as Un-American as anything I have ever heard or read.
On the issue of shutting down coal plants and replacing with renewables, Hawaii comes to mind as an outstanding experiment. In 2020 I wrote how this would be a “Glimpse Into the Future of the ‘Green New Deal’.” Well, now we are there. The last coal plant in Hawaii was shut down, they installed much generation capacity in renewables and added the largest, or at least one of the largest, Battery Storage Systems in the world. How has it worked out? Here is an update of my June 2020 Blog.
——————
“Huge Kapolei Battery Plant Replaces Coal at Hawaii Electric“
That is the headline of the Canary Media in December 2023. Here is the background as reported in an American Civil Engineering Society article, by Jay Landers:
Among U.S. states, Hawaii has some of the most ambitious mandates for shifting from fossil fuels to renewable energy sources to generate electricity. To achieve these mandates, the state aims to rely heavily on battery energy storage systems to provide backup power when intermittent sources such as solar and wind are insufficient or unavailable. On the Hawaiian island of Oahu, a large and sophisticated battery energy storage system recently came online, marking a key point in the state’s efforts to move toward a future of 100% renewable energy.
December startup
Situated on eight acres of industrial land, the Kapolei Energy Storage project comprises 158 Tesla Megapack 2 XL lithium iron phosphate batteries, which are about the size of a shipping container. All told, the KES project provides 185 MW of total rated power capacity, or the largest possible instantaneous discharge, and 565 MWh of energy capacity, or the maximum amount of stored energy.
The system can meet 17% of Oahu’s electricity demand for three hours at peak load or six hours at half load, Brandon Keefe, the executive chair of Plus Power — the company that developed the project — told USA Today. Plus Power “develops, owns, and operates standalone battery energy storage systems that provide capacity, energy, and ancillary services, enabling the rapid integration of renewable generation resources,” according to the company’s Jan. 11 news release announcing the start of operations at its KES facility.
As a percentage of the electricity system that it serves, the KES project is larger than any other battery storage project in the world, Colton Ching, the senior vice president of planning and technology for the Hawaiian Electric Co. Inc., told USA Today that Hawaiian Electric serves 95% of Hawaii’s 1.4 million residents on the islands of Hawaii, Lanai, Maui, Molokai, and Oahu. Each of the islands has its own independent power grid. On Oahu, Hawaiian Electric serves approximately 307,000 customers.
Back in mid-2020 I wrote…
Hawaii is a model of the impact of applying carbon free electricity generation policies before storage technology catches up. “Green Policies” do not necessarily result in “Green Power” as I will close with the actual power generation in real time. As an engineer specializing in efficient and clean coal power generation for five decades, whenever a coal plant shutdown is in the news, it catches my attention. So, when I read about the plans to shut down the 180 MW, AES Barbers Point Coal Plant near Honolulu, it caught my eye.
The title of the article in the Honolulu newspaper sums it up nicely: “Our Cheapest Power Is About to Go Away……. In 2016, HECO paid AES Hawaii an average of 5 cents per kilowatt hour. During the same period, wind was about 20 cents per kilowatt hour, solar about 21 to 23 cents.”
Hawaii is a perfect laboratory to show the effect of implementing extreme green policies on electric generation. Why? Because as islands, they are not connected to the US Grid. Therefore, the policies as implemented will create a fairly swift impact on electricity prices. According to the EIA, the highest retail electricity price in the U.S.A.: Hawaii at $0.3099/kWh.
I continued:
Digging a little deeper the plans for the future are for 52% Renewables by 2021 and 100% Renewables by 2045. As the Democrats in congress push for the new Green Deal, Hawaii offers an example of the adverse impact on electricity prices. Later, when Barbers Point is shut down, reliability could also become an issue.
If you are interested in the fuel mix for generation on the island of Oahu, here is a link for the real time power generation. As this is written (3/24/2020), I checked and 86% of the power was Fossil Fuels and of the 14% Renewables, they include 9% from the thermal waste to energy facility, 5% wind and because it was early morning, 0% solar.
I have always advocated a “Balanced Portfolio of Generation.” A plan to include LNG, Coal, Renewables, Oil and Waste to Energy would have been wiser, in my opinion.
Update!
Here is the update on electric rates by the EIA, Residential rate, $0.416/kWh, a one-third increase. Yes, Hawaii Electric remains the highest cost electricity provider in the U.S. This did not need to happen to Hawaii and there is time to stop the Climate Policy madness for the rest of the states.
Many of my knowledgeable friends have suggested that if the U.S. was to try to apply 100% Renewables, it would be a very good idea to first apply this to one electric supply system, rather than force green energy on all of the states. Well, here we have a completed experiment. Hawaii has passed the test of being the first experiment of applying the “Green New Deal.” Thank you Hawaii Electric for providing this outstanding example of applied renewables. My state of South Carolina and neighboring states are planning similar renewables plus battery storage. Your experiences are helpful.
Power generation expert Richard “Dick” Storm writes at Thoughts on Energy, Education, Prosperity & Environment. He describes his career as follows:
God Blessed me with good health to work a long career in power generation. I was fortunate to work all around the world in both Developed and Developing Countries. Over the years I gained an interest in the importance of energy and electricity and the affect that reasonable cost, abundant and reliable electricity has on any society. Thus, after retiring from full time work my main passion is to share my knowledge and experiences with others and to do my best to help educate all of the non energy trained people that I can, to teach in classrooms and lecture halls and spread the true facts on energy and power generation.
I had about 57+ years of total experience in electric power generation with coal power after graduating from Williamson in 1962. My first exposure to large coal plants was experience as a B&W Results Engineer, 1965-1969, Service engineer with Riley Stoker Corp., 1969-1972, Senior Engineer, Principal Engineer and Operations Supt. at Carolina Power and Light Company, 1973-1977. Began the Technical Services Group at Flame Refractories, Inc. 1977 -1992. This group specialized in applied solutions to improve large high pressure boiler performance, reliability and reduced emissions. Founded Storm Engineering and Associates, Inc. and Storm Technologies, Inc. 1992 and 1994.
Over the years I have written articles for POWER Magazine, published numerous technical papers, and given presentations based on my experiences.
The single biggest problem with the Left’s “climate” agenda is that the proposed response to the alleged crisis — replacement of fossil fuels in the energy system with intermittent wind-and-sun-based electricity generation — is not going to work.
The single biggest problem with the Left’s “climate” agenda is that the proposed response to the alleged crisis — replacement of fossil fuels in the energy system with intermittent wind-and-sun-based electricity generation — is not going to work. This is obvious to anyone who considers the subject seriously for any amount of time. Yet any mention of this issue has been almost completely banished from the mainstream media, from academia, from government, and from social media. It remains to a few lonely voices (such as, here in New York, myself, Roger Caiazza, and Ken Girardin of the Empire Center) to keep the subject in the public consciousness.
As small and lonely as our voices may be, somehow we must be getting under their skin. We know that because increasingly officialdom feels a need to respond publicly to our criticisms. But how can they give a plausible response, given that we are absolutely right and a wind-and-sun-based electricity system is never going to work? Easy! — Just treat the public like morons. Give answers that don’t make any sense while appealing to apparent authority, and expect the public to accept the answers without asking probing questions.
On March 17, Ken Girardin of the Empire Center think tank picked up on a press release just issued from an agency called NYSERDA (New York State Energy Research and Development Agency — the people in charge of the transition to “renewable” energy in New York) requesting proposals for what are described as “Public Relations Services” to assist “in developing a narrative around New York State’s clean energy and climate priorities.” In the next breath, NYSERDA discloses that a focus of the public relations effort will be “being able to rapidly respond to negative viewpoints and perceptions about the State’s climate and clean energy goals under the Climate Act, the costs associated with the Climate Act, and challenges to particular policies and programs.” Funny how these negative “viewpoints and perceptions” keep popping up. NYSERDA indicates that it is initially putting up $500,000 of taxpayer money to fund this effort, although it “reserves the right to extend and/or add funding to the Solicitation should other program funding sources become available.” Responses are due April 8.
You may already know that solar panels convert the sun’s free and abundant light into electricity. Pretty great, right? So, we thought we’d give you a quick quiz to test your solar smarts.
The Solar Quiz consists of six questions, of which only the first two go to substantive issues of whether this is a viable source of electricity to power the grid. Here is question number one, with the full answer:
Q: Do solar panels work on cloudy days? A: Yes! Because the panels collect light, they still function on cloudy days even though efficiency is somewhat reduced.
I like the exclamation point after the “Yes.” But is the reduction in electricity output from solar panels on a cloudy day a little or a lot? And does it make any difference to whether you can match supply to demand to make the grid function? Don’t expect answers to those kinds of questions here. This quiz is for dummies.
Caiazza helpfully supplies a photograph of a weather station in Buffalo on March 23 at 10:15 AM, plus a graph of weather data from the same site for the seven days leading up to noon on the same date. The weather station is situated in the midst of a large array of solar panels, so you can get an idea what the conditions were like for the generation of electricity on that day (the third day of spring!):
And here is Caiazza’s graph of data from the weather station:
The red and green lines are temperature and dew point, while the harder-to-see yellow line, showing “insolation,” is the one we are interested in. Although it is faint, it looks like the yellow line didn’t even make it up to 200 at noon on March 23, compared to maxing out at over 800 on the sunny days of the 17th, 20th and 21st. So the “somewhat reduced efficiency” alluded to by NYSERDA can easily be a reduction of 75% or more. And note that reduced “insolation” is not the only thing degrading the performance of these particular solar panels. How about the fact that they are covered in snow? From the photograph, it looks highly doubtful that these panels were producing any meaningful amount of electricity after that snowstorm.
Question number two in NYSERDA’s Solar Quiz is even more insulting to the intelligence of the reader:
Q: If I have solar panels, will my house still have energy at night? A: Yes. Solar-powered homes collect excess energy and pass it to the grid for future use, and if you don’t have excess energy stored you pull energy from the grid at any time, like when it’s dark. Another option for night-time energy use is on-site battery storage, which collects excess energy and saves it for when it’s needed.
This is George Kamburoff-level critical thinking. Caiazza comments:
This is egregious misinformation. . . . In my opinion the worst subsidy for residential solar is the unacknowledged cost to provide grid energy when the sun does not shine. Somebody else is paying for the infrastructure (storage or alternative sources) necessary so that solar-equipped residences can “pull energy from the grid at any time”. Inevitably the “net-metering” rules will have to be changed so this subsidy is reduced or eliminated. The mention of on-site battery storage is a start, but the reality is that the largest reliability cost is associated with extreme conditions and providing enough solar panels and energy storage to start to address that problem is uneconomic for an individual.
Nothing complicated there. But NYSERDA either is treating the public like morons, or alternatively they are morons themselves and don’t understand why what they are proposing can’t work. (Of course, it could be both.)
While we wait to see how our new professional spin-meisters are going to up the game of the New York energy propaganda machine, let’s check in with similar efforts from the other side of the globe. In Australia, the state-run Australian Broadcasting Corporation has an official “fact-checking” service called CheckMate. From the information on their web page, they seem to have two mottos: “Your inoculation against misinformation,” and “Fearlessly follow the facts no matter where they lead.”
In their fact check of March 22, CheckMate addresses the question “Can a country run entirely on renewable energy?” It seems that an Australian businessman named Dick Smith appeared on a Sydney radio station called 2GB earlier this week, and was quoted as saying “Look, I can tell you, this claim by the CSIRO that you can run a whole country on solar and wind is simply a lie. . . . It is not true. They are telling lies. No country has ever been able to run entirely on renewables — that’s impossible.” (CSIRO is the official government-supported scientific groupthink agency. The acronym stands for Commonwealth Scientific and Industrial Research Organization.). So, ABC, is there anything to Mr. Smith’s assertion?
Here’s their answer:
[E]xperts consulted by RMIT ABC Fact Check suggested Mr Smith’s statement doesn’t hold up.
Oh, really? What experts, exactly? And how do they back that up?
Mark Diesendorf, an expert on sustainable energy and energy policy from the University of New South Wales, labelled Mr Smith’s assertions as “incorrect”. “Several countries (and Tasmania) already run their electricity systems on 100 per cent renewables,” he said in an email, noting that such places relied heavily on hydro power.
Sure, a handful of tiny-population countries, like Albania, Bhutan and Iceland, that happen to have lots of hydro or geothermal power can run on that. But Smith said the thing that was impossible was running on “solar and wind.” What’s the response to that? ABC goes to its next “expert”:
Andrew Blakers, a professor of engineering at the Australian National University’s Institute for Climate, Energy and Disaster solutions, told Fact Check: “Several detailed studies show that [getting to] 100 per cent renewables based mostly on solar and wind is quite straightforward, provided that enough transmission and storage is built.”
“Detailed studies” show that it can work. So you say. But what is the country that has been able to run 100% on solar and wind, thus refuting Smith? He can’t name it. It doesn’t exist.
And then ABC resorts to the ultimate charlatan, Professor Mark Jacobson of Stanford:
When it came to regions with a comparable or greater population size to that of Australia, Professor Jacobson pointed to the US state of California, which has a population of around 39 million. As of Tuesday this week, he said, the state, which is aiming for 100 per cent carbon-free electricity by 2045, had “been running on more than 100 per cent WWS for 10 out of the last 11 days for between 0.25 and 6 hours per day”.
Aha! So it counts as “running a whole country on wind and solar” if you can accomplish the feat for between 0.25 and 6 hours per day on 10 of 11 cherry-picked days? This is how they refute Mr. Smith.
I know that neither the American nor Australian public pays much close attention to the details of how the electricity grid works. But I also don’t think the respective publics are at nearly the level of idiocy that officialdom would place them. It is truly shocking that they have no better answers than these, even as they press forward to transform the energy systems without any indication that the transformation will work. Show us the working demonstration project!
An article in the Ohio Capital Journal claims that it’s time to link violent weather to climate change for the state. This is false. There is no real-world evidence showing climate change is weirding the weather in Ohio or anywhere else.
An article in the Ohio Capital Journal claims that it’s time to link violent weather to climate change for the state. This is false. There is no real-world evidence showing climate change is weirding the weather in Ohio or anywhere else. Even the latest report from the Intergovernmental Panel on Climate Change (IPCC) does not link changes in severe weather to climate change, or more particularly changes in tornado patterns which the story focuses upon.
For two years running, Ohio has seen what used to be rare February tornadoes, followed by a deadly outbreak just last week. But news coverage of the twisters almost completely omitted any mention of climate change.
With climate scientists overwhelmingly agreeing that human-caused warming is happening and last year having the hottest average global temperature on record, is it time to start linking that to the weird weather we’ve been seeing?
Had Schladen bothered to look at data and the climate science literature, he would have discovered that they show no link between climate change and shifts in the timing or frequency of extreme weather.
First, Schladen errs in believing that two consecutive years of what he considers to be abnormal weather in February is significant. This is not a long enough trend to be considered climate change. It is well established by the World Meteorological Organization that climate change is measured over thirty years not two.
He compounds that error by using one year of warmer than normal temperatures (2023) as the basis for the claim that warmer weather is driving more tornadoes in February. However, data from the National Oceanic and Atmospheric Administration (NOAA) Storm Prediction Center (SPC) indicates that since 1998, there has been a zero trend in Ohio tornadoes for February:
If, in fact, gradually warming temperatures in Ohio due to climate change were driving more tornadoes you would see it in the trend data, but no trend is evident. The February 2023 and 2024 tornadoes in Ohio were rare, but not unique historically. In fact, 17 tornadoes have been recorded in February in Ohio between 1950 and 2016, including some occurring during the period when the Earth was cooling on average from the 1950s through the 1970s. Nor are tornadoes in Ohio becoming stronger. The last F5 tornado recorded in Ohio was in 1985, nearly 40 years of modest warming ago. Data do not support claims that climate change is causing a long-term trend of earlier tornadoes or more extreme tornadoes in Ohio, or anywhere else.
Climate change does not affect individual states like Ohio, it is a much broader phenomenon. Looking at the entire United States over the past 50 years, which has seen a gradual warming, there is also no upward trend for violent tornadoes as seen in Figure 2 below.
Figure 2. This figure shows the frequency of strong to violent tornadoes (tornadoes registering EF3 or stronger) has been declining since the early 1970s. Sources: Graph by Anthony Watts and David Burton using official NOAA/Storm Prediction Center data.
Climate at a Glance: Tornadoes reports that the United States has been experiencing a record low number of violent tornadoes in the past decade:
The number of tornadoes in the United States, as well as in other countries, has been slowly declining for the past 45 years. At the same time, the number of strong to violent tornadoes, EF3 or higher, has been dramatically declining for the past 45 years. (See Figure 1.) In fact, the United States set a record in 2017–18 for the longest period in recorded history without a tornado death, and it set a record for the longest period in history (306 days) without an EF3 or stronger tornado.3,4 The two record-low years for tornado strikes in the United States both occurred this past decade, in 2014 and 2018.5
Not only that, a recent peer-reviewed paper, Time trends in losses from major tornadoes in the United States, published in Science Direct in September 2023, shows that U.S. tornado damage & strong tornado incidence are both sharply down. If warming by climate change was driving more tornadoes you would see it in the tornado damage record, but it’s not there.
There is simply no evidence in the data or in climate research supporting the claims made by Schladen. However, if you read the entire piece by Schladen, it becomes obvious that he strays from analysis into opinion, especially when he starts blaming other journalists for not doing their homework, saying:
For journalists covering weather events, it’s easier not to wade into the subject of Earth’s changing atmosphere and whether that has anything to do with the tornado or flood or hurricane or wildfire that they’re trying to cover. In fact, NPR reported in November, weather experts in the Midwest said that talking publicly about global warming brought them threats.
Not mentioning climate in such coverage is also easy to rationalize. No one weather event can be definitely attributed to global warming, many climate scientists have long said.
If Schladen had simply stuck with the last sentence in that excerpt he would have been on target. Instead he lambasts other journalists for being cautious in linking instances of extreme weather events to climate change. They are avoiding, to Schaleden’s displeasure, the error he commits.
The Ohio Capital Journal story is just another instance of sloppy, irresponsible journalism by a reporter promoting his preconceived views on climate change, and the climate catastrophe narrative, over data and facts which don’t fit the narrative.




You must be logged in to post a comment.