Net Zero Fails Science, Math andย People

I think [Net Zero] is insane. It is pointless to pursue it because it will make no difference to the climate or to climate change. The climate will change as it wants to change, no matter how much CO2 we put in the air. So, itโ€™s a pointless thing to do. It is unachievable. And in the end, as always, itโ€™s the poorest among us that will pay the highest price proportionally.

A deserted urban landscape in ruins under a dramatic sunset, featuring the text 'NET ZERO 2050' prominently displayed.

From The Science Matters

Byย Ron Clutz

A cartoon unicorn silhouette with a rainbow tail, featuring the text '100% renewable?' inside.

In the video above, Ron Barmby joins Angela Wheeler to discuss Sunset on Net Zero and the why green energy schemes fail.ย  He questions the scientific, economic, and engineering basis of global net-zero policies. Drawing on physics, real-world observations, and decades of experience, he argues that CO2โ€™s warming effect is small and diminishing. He also challenges climate models that rely on unverified assumptions.ย  Barmby warns that many green energy solutions are impractical and that net-zero policies disproportionately harm the poor.

For those preferring to read, I provide below a lightly edited transcript in italics with added images.  AW refers to Angela Wheeler and RB to Ron Barmby.  H/T Climate Change Dispatch.

I think [Net Zero] is insane. It is pointless to pursue it because it will make no difference to the climate or to climate change. The climate will change as it wants to change, no matter how much CO2 we put in the air. So, itโ€™s a pointless thing to do. It is unachievable. And in the end, as always, itโ€™s the poorest among us that will pay the highest price proportionally.

AW:  This is Climate Debrief, brought to you by the CO2 Coalition. Iโ€™m Angela Wheeler. Thereโ€™s a recently published book, Sunset on Net Zero, a heretics guide to the futile CO2 target.  Youโ€™re going to hear from the author, CO2 Coalition member Ron Barmby. Ron is a professional engineer with a masterโ€™s degree from the University of Alberta and a four-decade career thatโ€™s taken him to over 40 countries across five continents. Ronโ€™s adventures have shown him firsthand how societies really are adaptable to shifting climates.

Thank you for taking the time, Ron. Thank you for having me, Angela. Part one of your recent book is titled How I Learned to Stop Worrying and Love Carbon Dioxide.  Did you have a moment of clarity where this all made sense or did this happen over a period of time?

RB:ย It sort of happened over a period of time when the Al Gore movie came out. At first, I was impressed with it, and I thought, well, this all makes sense. And then as other writers started pointing out the flaws in that movie, I decided I should look into this more too.

A speaker presenting on stage, with a graph displayed behind showing variations in temperature over time, while an audience observes attentively.
Al Gore with a version of the Hockey Stick graph in the 2006 movie An Inconvenient Truth

And as an engineer, I have a background in physics and I realized that a lot of the physical characteristics that Al Gore was talking about simply arenโ€™t true. So it developed over time. And as it developed over time, some of my friends said, Ron, you should write this down. And so I did. And that was my first book. The second book, the one that you just mentioned, is sort of an update of whatโ€™s happened since 2020 when the first book was published.

Political cartoon depicting a character holding a Nobel Prize and pointing out nine scientific errors identified by a British judge in Al Gore's film 'An Inconvenient Truth' related to global warming.

AW: What is your analysis of this global effort to reach net zero?

RB: Well, I think itโ€™s insane. Thatโ€™s what I think. It is pointless to pursue it because it will make no difference to the climate or to climate change.

I now declare the Paris Agreement for Climate Change open for signature. More than 170 countries signed the Paris Agreement. They are pledging to take steps to limit the rise of global temperatures to well below two degrees Celsius.
โ€“Ban Ki-moon, UN Secretary-General

The climate will change as it wants to change, no matter how much CO2 we put in the air. So, itโ€™s a pointless thing to do. The second part of it, it is unachievable.

A graphic featuring a circular arrow design with a yellow and gray color scheme, alongside the text 'ZERO CO2 SUICIDE' in bold yellow and white letters on a gray background.

And thatโ€™s where my engineering background comes in and many of the engineers that are part of the CO2 coalition. What they want to achieve simply canโ€™t be done in a reasonable time frame at a reasonable cost, and it canโ€™t be done globally. And the third thing about it is the whole thing is unfair because it punishes those that are trying to reduce CO2 emissions to the benefit of those who are only paying lip service to CO2 emissions. And in the end, as always, itโ€™s the poorest among us that will pay the highest price proportionally.

A portrait of Steven Koonin with a quote about moral issues related to the treatment of the Developing World and concerns for the younger generation, set against a colorful green background.

AW: Your book sums it up well in stating that warming from future CO2 is too trivial and too gradual to justify drastic policy. Could you explain that?

RB:ย Well, there was a paper written in 2019 by two coalition members, Dr. ย Wijngaarden and Dr. Happer.
That paper explained from physicist to physicist how we can actually measure the amount of CO2 warming that has happened. And by measuring that amount, it confirmed the equations that would predict what would happen if we doubled the CO2 emissions again or came to a complete doubling. And looking into that paper, I tried to explain in everyday terms how valid it is and what it means. And so, in that investigation, I came to the conclusion that this is understandable by many, many people. And if we got the word out, that might help shift the view on the alarmism of carbon dioxide induced global warming.

[From Wijngaarden and Happer study: My synopsis is Climate Change and CO2 Not a Problem

Graph depicting Earth's surface temperature calculation at 60ยฐF without greenhouse gases, showing areas under various gas concentration curves (N2O, H2O, CO2) with corresponding energy values in W/mยฒ, accompanied by images of Max Planck and Karl Schwarzschild.
โ€œRight in the middle of these curves, you can see a gap in spectrum. The gap is caused by CO2 absorbing radiation that would otherwise cool the Earth. If you double the amount of CO2, you donโ€™t double the size of that gap. You just go from the black curve to the red curve, and you can barely see the difference. The gap hardly changes.โ€]

AW: Is it your position that the push for net zero stems from political exaggeration, followed by media amplification and not empirical science? Is that a fair assessment?

RB:ย I think thatโ€™s a fair assessment. And Margaret Thatcher is one person that I like to quote on that. Many people donโ€™t realize that Margaret Thatcher was trained in Oxford as a chemist, as a research chemist. So, she was one of the big people behind pushing for the Paris Agreement. And she wanted to reduce CO2 emissions because she was concerned. But she knew how the scientific method worked because she was trained in it. And when she saw the first reports come out, she changed her mind.

And she said, kind of paraphrasing Hamlet, that there isnโ€™t method in their madness, there is actually madness in their method. And what Margaret Thatcher pointed out was that the desire to control CO2 emissions worldwide is something that would require a worldwide organization to organize and enforce. And so, she saw it in that perspective, that it was a grand multinational global socialist effort to control the economy.

Logos of the International Monetary Fund and World Bank with a headline about Oxfam's report on unaccounted climate funds.

She was not far off. But I do think that on the other end of the spectrum, capitalists have found a way to exploit this energy transition and make money that they would otherwise not be able to make.

AW: Regarding net zero, your compelling argument cites the work of two other CO2 coalition members, our chairman, Dr. William Happer, and Dr. William Don Wingarden. Their work, as you mentioned, initially a series of academic papers by physicists for physicists, focuses on measuring thermal radiation transfer and had a truly profound effect because it undermines net zero. For one, they use real observations, not models. Can you please explain the difference and why is it worth noting?

RB: The scientific method is a way to make sure that weโ€™re not fooling ourselves, that we think we understand something that we donโ€™t really understand. And it was one thing that another CO2 member, Dr. Clauser, pointed out in his talk to Korean physicist students a couple of years ago. You have to go into science with an open mind and an unbiased mind. And you have to report faithfully what you observe. And itโ€™s the observations of physical reality that is the link to truth in science.

A cartoon depicting scientists by a large machine labeled 'Climate Earth 1.0' with various control knobs, emphasizing the influence of oceans on global temperatures. One scientist enthusiastically points to a knob related to 'water vapour'.

So, the computer models that the IPCC relies on arenโ€™t based on observations that are linked to reality. Theyโ€™re based on biases that the computer programmers put into their own models. And the brilliance behind the Van Wingarden and Happer study is that they found an existing public domain database that contained the observations needed to show that the effect of CO2 warming was very small and itโ€™s diminishing rapidly.ย  Another important thing to mention is that Dr. Happer and Dr. Van Wingardenโ€™s math matches real world data from space. This follows the scientific method, observe, predict, test, repeat.

AW: What youโ€™re saying, and especially in your book, that the scientific method is so important, do you feel it is being neglected and perhaps not followed at the university level today?

RB:ย Unfortunately, I think, Angela, itโ€™s worse than that. Itโ€™s not followed, maybe not at the university level, but I think itโ€™s the elementary, junior high, and high school level where it needs to be brought back into the curriculum and taught. Itโ€™s when 10- and 12-year-old students come home and theyโ€™re convinced that CO2 is something to be afraid of. Thatโ€™s where the problem starts.ย  And I think thatโ€™s where the problem has to be fixed.

A cartoon depicting two characters on a bridge discussing a sign that claims 'Earth will be uninhabitable in X years'. One character expresses confusion about the urgency while the other holds various protest signs related to climate change.

AW: Regarding the paper by Dr. Happer and Dr. Van Wingarden, they didnโ€™t just claim CO2 impact is small. They measured it, verified it, and anyone can check their data. They replaced alarmist models with hard, observable facts. How can anyone argue that?

RB:  Angela, I donโ€™t think anyone has argued with that. I think the mainstream media and the IPCC have simply ignored it. They havenโ€™t addressed it. Coming out in the United States is a presidential directive that all science backed by the federal government must meet the scientific method standards. And I think thatโ€™s going to be a huge change worldwide when organizations, both federal and international organizations, when they are held to the standard of the scientific method, I think their karmic alarmism is just going to melt away.

AW: As a former teacher and also as a mother and now a GG, I was gratified to see your chapter Stop Scaring the Children. What compelled you to write this chapter?

RB:ย Iโ€™m a grandfather, and my grandkids are very concerned about CO2. And so, it takes me a long time to explain to them that thereโ€™s nothing to worry about. And unfortunately, in a more of a millennial generation, thereโ€™s been a lot of extreme anxiety among that generation about climate change. And unfortunately, thereโ€™s been some tragedies that have resulted because of that. So, I think itโ€™s important to stop scaring the children. If you want to deal with a scientific methodology or a proposition you want to promote, bring it forward to trained people who can discuss it intelligently with you. Donโ€™t bring it into the classroom of an elementary school and scare children with it.

Billboard displaying the message 'Sleep Well... There is No Climate Crisis' along with a website link 'CO2coalition.org' and an image of a sleeping woman.

AW: Ron, the second part of your book is Engineering 101 is the doomsday book for net zero. Why is that?

RB: Well, because there are all of the green energy sources and the green machines that run on them, and many of them just simply fail when you try to build them. And I think I quote in my book, it was James Michener who said scientists dream of great things, but engineers build them. Well, you can have great dreams. You can dream of creating a solar guidance star like Dr. Hapur did, but itโ€™s up to the engineers to build them. And everyone is crossing their fingers until the thing actually works.

A landscape featuring multiple wind turbines with a mountain range in the background, accompanied by a large text overlay discussing energy production and manufacturing costs.

And a lot of the propositions that are out in the mainstream media, how we can avoid or reduce our CO2 emissions are either uneconomic or they hurt the environment more than they help, or they simply donโ€™t work. And thatโ€™s my engineering perspective coming into play.

AW: I see. And that makes me think of models, climate models. For example, you can create the model, but from an engineering standpoint, and with regard to net zero, is it impossible to come up with the conclusions that they do with models?

RB: In the case of climate, yes, it is. Now in engineering we use models for a number of things, because we have verified that the equations weโ€™ve put into the model are correct, and they can predict what might happen. And you can see that in flight simulators.

In my own background, reservoir engineering models are based on the Darcy equation, and theyโ€™re quite good at predicting what will happen, because those equations stand up to the scientific method. And so, when your equations can predict what happens in the future, and it actually happens, then you verified the equation, then you verified the model. The IPCC models, they have equations in there and assumptions that simply arenโ€™t verified, and they donโ€™t predict accurately.

Infographic showing the logarithmic temperature rise associated with higher levels of CO2, detailing the global temperature increase for different CO2 concentrations represented in parts per million (ppm). It includes a graphical representation of the relationship between CO2 levels and temperature rise.

One thing that came out of the Van Wintergaarden and Happer paper, and other papers that are associated with members of the CO2, is that the CO2 warming from the IPCC models has to be at least doubled, and some would claim quadrupled, in order to get the alarmist levels of warming that they predict. And so that factor of two or four just thrown in to cause more anxiety, thatโ€™s not science, thatโ€™s scare tactics. And itโ€™s important to point out that the IPCC is a government organization, itโ€™s not a science organization.

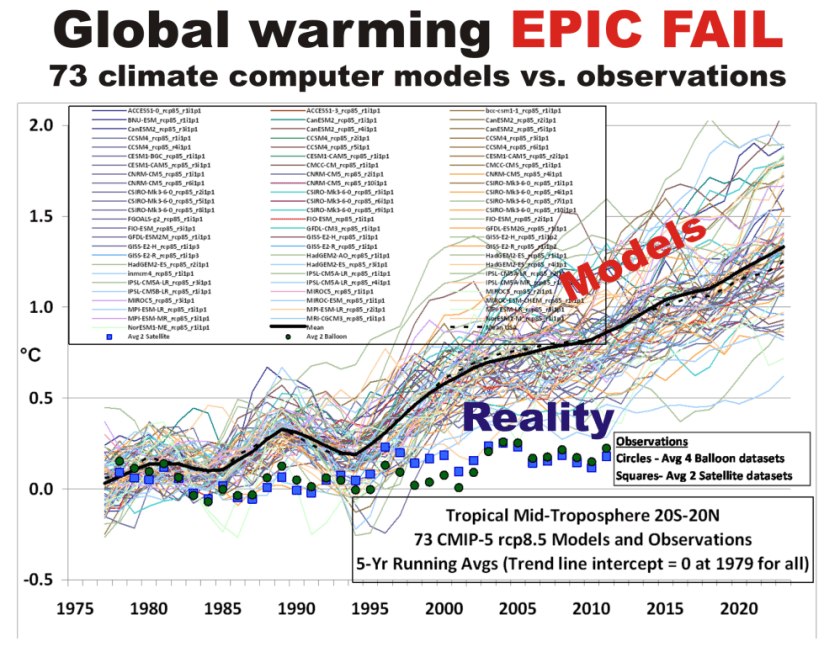
Graph showing the discrepancy between 73 climate computer models and actual temperature observations from 1975 to 2020, labeled 'Global warming EPIC FAIL'. It features lines representing model predictions, highlighted areas for observed data, and annotations for model and reality sections.

AW:ย And the other thing is, they say carbon dioxide is the control knob for temperature, and thatโ€™s not the case, correct?

Diagram illustrating Earth's energy budget, showing the distribution of incoming solar energy, including how much is reflected, absorbed, and radiated back into space.

RB:ย Youโ€™re absolutely correct. We run on an energy balance, and that energy balance coming from the sun has part to do with the climate on earth. And as Gregory Wrightstone pointed out in his book, 90% of the global warming effect of CO2 is already behind us. So, the next 10% is going to be minimal. So, the next 10% is not the control knob of temperature on earth. Now, if there was no CO2 on earth, as there is no CO2 on the moon, the first amounts of CO2 added would have a dramatic effect on temperature. But thatโ€™s way, way behind us.

AW: Well, in concluding our conversation, I would like to let our viewers and listeners know that they can get your new book, Sunset on Net Zero, A Hereticโ€™s Guide to the Futile CO2 Target at Amazon. Ron, there are many excellent points in your book we didnโ€™t get to. I hope you will join us again soon on Climate Debrief. Iโ€™d love to, Angela. Thank you very much.

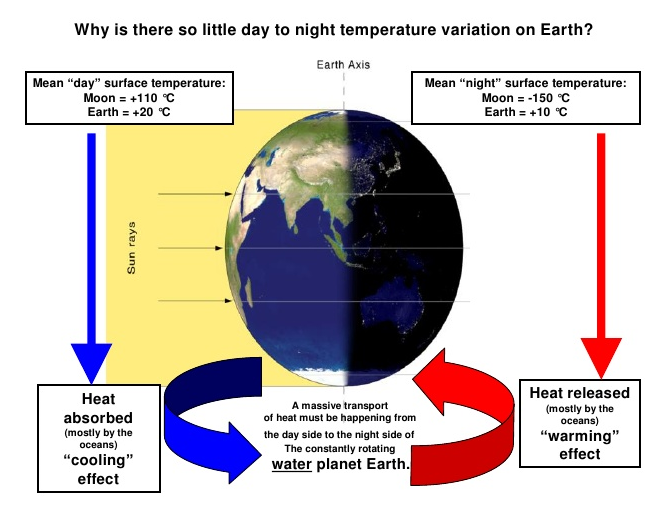
Infographic explaining the minimal temperature variation between day and night on Earth, illustrating heat absorption and release processes, with comparisons to the Moon's temperatures.

New Research Finds โ€˜No Statistically Significant Accelerationโ€™ In Global Sea Level Rise

Aย new statistical analysisย of global sea level rise patterns suggests that, as of 2020, approximately 95% of the 204 PSMSL tide gauges reliably contributing to estimates of global sea level rise show there has been no statistical acceleration in the modern rate of rise.

A digitally created image depicting the Statue of Liberty amidst a flooded, post-apocalyptic cityscape with towering skyscrapers and debris in rough waters.

From NoTrickZone

Byย Kenneth Richard

An underwater scene depicting a submerged city with skyscrapers partially submerged in water, featuring a shark and various other fish swimming among the ruins.

There has been no sea level acceleration consistent with the alarmist global warming narrative.

A new statistical analysis of global sea level rise patterns suggests that, as of 2020, approximately 95% of the 204 PSMSL tide gauges reliably contributing to estimates of global sea level rise show there has been no statistical acceleration in the modern rate of rise.

The 5% of gauges that do indicate acceleration cannot be attributed to โ€œglobal warmingโ€ or climate change, but to local or geologic factors (i.e., vertical land motions).

So, there has effectively been no acceleration consistent with the view that sea level rise is driven by a mechanism such as โ€œglobal warming.โ€

โ€œThe statistical procedure detects accelerating sea level rise in a few isolated locations. This pattern is inconsistent with sea level acceleration driven by global phenomena.โ€

Furthermore, the global sea level rise rate today, in 2020, is only 1.5 mm/year. The IPCC models project sea levels should be rising at a rate of about 3.5 mm/year. Thus, the rate of rise projected by the IPCC is โ€œbiased upward with approximately 2 mm per year in comparison with the observed rate.โ€

A histogram illustrating the median long-term rate of sea level rise for 2020, derived from PSMSL data, showing a range of rates with a median of 1.5 mm/year.
Image Source:ย Voortman and De Vos, 2025

New Study: No Acceleration in Sea Level Rise Detected Worldwide

A new peer-reviewed study published in theย Journal of Marine Science and Engineeringย challenges a key claim of climate science: that global sea level rise is accelerating. An analysis of more than 200 long-term tide gauge records shows no evidence of such acceleration, while IPCC models systematically overestimate local sea level rise.

Aerial view of a remote sandbar surrounded by turquoise waters and coral reefs, with a clear blue sky in the background.

A new peer-reviewed study published in theย Journal of Marine Science and Engineeringย challenges a key claim of climate science: that global sea level rise is accelerating. An analysis of more than 200 long-term tide gauge records shows no evidence of such acceleration, while IPCC models systematically overestimate local sea level rise.

An analysis of more than 200 tide stations around the world shows that there is no evidence of a global acceleration in sea level rise.

That is the surprising conclusion of the paperย A Global Perspective on Local Sea Level Changes, published this week in the Journal of Marine Science and Engineering. It is a unique study by two Dutch researchers, Hessel Voortman and Rob de Vos. Clintel has the story.

The paper also shows that IPCC models significantly overestimate local sea level rise in 2020.

This new publication is a follow-up to anย earlier paper from 2023ย in which first author Hessel Voortman demonstrated that sea level rise along the Dutch coast was not accelerating.

These two paragraphs are the opening of a press release sent out on August 29 by engineer Hessel Voortman. Voortman spoke about his sea level research at the Clintel conference last year. Together with Rob de Vos (blogger at klimaatgek.nl), he has now published a scientific paper in which they demonstrate that sea levels are not rising at an accelerated rate worldwide.

This is a spectacular result because climate scientists have been crying wolf about accelerating sea level rise in recent years. We will see whether this paper will receive as much media attention as the University of Utrecht modelling work earlier this week, which was used to make claims about the stagnation of the Atlantic Meridional Overturning Circulation (AMOC).

The climate is a sensitive subject. Since the IPCC appropriated the subject of โ€˜climate changeโ€™, what was once a hypothesis now seems to be an unshakeable โ€˜factโ€™: the climate is changing, CO2 is the culprit, and humans are to blame. The fact that it is all a bit more complicated and that consensus (if it even exists) in science is meaningless are slowly gaining ground. This is difficult, because the opposing forces (one-sided scientific research, political pressure, constant one-sided reporting, etc.) are strong.

One of the โ€˜crown jewelsโ€™ of what I call the IPCC narrative, is rising sea levels. Now, rising sea levels are nothing unusual. Since the end of the last ice age (about 15,000 years ago), sea levels have risen by about 120 meters. It was not so long ago that โ€˜weโ€™ could reach England on foot (across what is now the bottom of the North Sea). A thick coat was desirable, because at the end of the most recent ice age, the Weichselian glaciation, our region had a tundra climate.

Graph illustrating post-glacial sea level rise over thousands of years, including data points for various locations.
Fig. 2ย ย  Source:ย Wikipedia

Rising temperatures from around 15,000 years ago caused ocean water levels to rise, initially rapidly and then more slowly, as shown in Figure 2. The graph is based on data from three publications byย Fleming et al. 1998ย andย Milne et al. 2005. The main causes of this sea level rise were the melting of two ice caps in Scandinavia and North America and the expansion of ocean water as a result of warming.

In the modern era, sea levels are still rising, at an average rate of 1.7 ยฑ 0.4 mm/year between 1901 and 2022 (Deltares). In recent years, there have been reports of an acceleration in sea level rise due to the enhanced greenhouse effect. Inย its latest report from 2021, the Intergovernmental Panel on Climate Change (IPCC) stated that sea levels have been rising at an increasing rate since 1900, in other words, that there has been a global acceleration in sea level rise.

Graph showing annual average sea level measurements in centimeters for the Netherlands, including trend lines for low and high emission scenarios, with data points from 1900 to projections for 2100.
Fig. 3ย ย  Source:ย KNMI

Based on this, sea level models were developed that predicted fairly extreme sea levels for 2100.

Figure 3 shows the forecast of KNMI for sea levels on the Dutch coast up to 2100. According to KNMI, these could rise with more than 120 cm by 2100 (relative to the 1995-2014 average).

Inย an article from 2024, I calculated for the five Dutch coastal stations, that the relative sea level rise from 1900 to 2022 was 1.92 mm/year. If you subtract the average land subsidence along the coast from this, you arrive at an absolute sea level rise on the Dutch coast of 1.45 mm/year.

Read the full story here.

A dramatic comic-style illustration of six concerned men shouting in front of a flooded cityscape, holding a sign that reads 'The end is nigh!' with dark stormy skies and lightning in the background.

What about sea level?

Weโ€™ve all heard the question. We point out there is no evidence that current climate changes, whether man-made or natural, are dangerous or unusual. Then we are asked, but โ€œWhat about sea level rise? Isnโ€™t that dangerous?โ€ There are many very good technical arguments why the current rate of sea level rise will not threaten humans, New York City, Miami, or Tuvalu. These are urban legends that spawn from silly IPCC models as explained by Ole Humlum in Chapter 10 of our latest book (Crok & May, 2023). How are these myths dismissed quickly in clear language? This is my best attempt in ~600 words. Let me know how I did.

From Watts Up With That?

By Andy May

Weโ€™ve all heard the question. We point out there is no evidence that current climate changes, whether man-made or natural, are dangerous or unusual. Then we are asked, but โ€œWhat about sea level rise? Isnโ€™t that dangerous?โ€ There are many very good technical arguments why the current rate of sea level rise will not threaten humans, New York City, Miami, or Tuvalu. These are urban legends that spawn from silly IPCC models as explained by Ole Humlum in Chapter 10 of our latest book (Crok & May, 2023). How are these myths dismissed quickly in clear language? This is my best attempt in ~600 words. Let me know how I did.

The current rate of global sea level rise is below the accuracy of our current ability to measure it as discussed in Kip Hansenโ€™s Chapter 5 in Crok & May. Figure 1 shows three respected estimated rates. The sea levels are shown as reported and they have different zero points. The Jevrejeva, et al. estimate in blue is 2 mm/year (ยฑ ~0.3), the one below that is the Church and White estimate of 1.7 (ยฑ ~0.3) mm/year. These estimates are both from tide gauges, although the Jevrejeva estimate does try and include the satellite data from 1993 to 2009. Due to the overlap of the authorโ€™s estimates of uncertainty, the two estimates are statistically equivalent.

Figure 1. Three respected estimates of the rate of sea level rise in mm/year. Sources: (Jevrejeva, Moore, Grinsted, Matthews, & Spada, 2014), (Church & White, 2006), and (Beckley, Callahan, Hancock, Mitchum, & Ray, 2017). Jevrejeva, 2014 only discusses their reconstruction through 2009, so they do not include the sudden rise in 2010 shown in their dataset.

The lower estimate, shown in gray, uses all the NASA satellite data since 1993. It shows a rate of 3.3 mm/year (Beckley, Callahan, Hancock, Mitchum, & Ray, 2017). The satellite record is too short to be meaningful, we need at least 60 more years of data before we can derive a meaningful rate from satellites. The satellite data only covers the upward part of a ~60-year cycle or oscillation that began in 1991.

Global mean sea level has been rising for the past 170 years, but the rate is cyclical. The cycle shows up prominently in Figure 1 from about 1930 to 1991 in the Jevrejeva et al. reconstruction. It is also seen, albeit in a more subdued fashion, in the Church and White reconstruction. Thus, any estimate of the rate of rise based on a reconstruction (satellite or tide gauge or combined) that is shorter than 90-120 years is erroneous. Sea level fell during the Little Ice Age until about 1861 when it began to rise.

All the rates (since 1900) are projected to 2100 in the upper left box and show sea level rises between 5 and 10 inches by 2100. These increases are much less than the average daily tidal range of over one meter. Such a small rise in 76 years is unlikely to be noticed. It should be noted here that sea level is not the same in all oceans as one might expect. In Panama, sea level is 20 cm (~8 inches) higher on the Pacific side of the country than on the Atlantic/Caribbean side, this is about the global sea level rise expected between now and 2100. Even more important, the tidal range on the Pacific side is much larger than on the Caribbean side.

Measuring global mean sea level is made extraordinarily difficult by the changes in mean sea level from ocean to ocean and the related changes in the daily tidal range. Jevrejeva points out that tide gauges are confined to continental and island margins and most of them are in the Northern Hemisphere, the tide gauge records donโ€™t all cover the same time period, and they are attached to land that sometimes rises and falls itself. Jevrejeva points out that it is not easy to combine the various records into a single global sea level curve.

In a like fashion, any estimate of acceleration in the rate with any of this data, or any combination of it, is little more than a guess. Polynomial fits to all these series can show some acceleration, but the fit to the polynomials is statistically no different than a linear fit to the same data.

As many of my regular readers know, I often throw ideas out there for comment. I want to know what the best arguments against my ideas are. Or did I miss a better argument? So positive or negative, give me your best shot. Am I right, or wrong? Is there a better argument than what Iโ€™ve offered?

Works Cited

Beckley, B. D., Callahan, P. S., Hancock, D. W., Mitchum, G. T., & Ray, R. D. (2017). On the โ€œcal-modeโ€ correction to TOPEX satellite altimetry and its effect on the global mean sea level time series. Journal of Geophysical Research: Oceans, 122, 8371โ€“8384. doi:10.1002/2017JC013090

Church, J. A., & White, N. J. (2006). A 20th century acceleration in global sea-level rise. Geophys. Res. Lett., 33. doi:10.1029/2005GL024826

Crok, M., & May, A. (2023). The Frozen Climate Views of the IPCC, An Analysis of AR6. Andy May Petrophysicist LLC.

Jevrejeva, Moore, J., Grinsted, A., Matthews, A., & Spada, G. (2014). Trends and acceleration in global and regional sea levels since 1807. Global and Planetary Change, 113, 11-22. doi:10.1016/j.gloplacha.2013.12.004

Fifty years after the 1973 oil crisis, the EU is at risk of another one

On 6 October 2023, 50 years ago, the Yom Kippur War began between Israel and the Arab countries. It lasted only a few days, but it was used as a pretext to revolutionise the oil market, as Arab countries decided to punish Western countries that supported Israel.

From ย Friends of Science Calgary

Originally published in European Scientist โ€“ republished here with permission of the author.

By Samuel Furfari โ€“ ยฉ 06.10.2023

On 6 October 2023, 50 years ago, the Yom Kippur War began between Israel and the Arab countries. It lasted only a few days, but it was used as a pretext to revolutionise the oil market, as Arab countries decided to punish Western countries that supported Israel. The first oil crisis had far-reaching consequences. We will analyse the situation that led to the Arab countries to revolt against an unfair situation, since the beneficiaries of their production were the Western countries. We will see how the European Commission organised itself to withstand this shock. But the most interesting thing is the parallel with the current situation which, if it continues, would lead to a new oil crisis.

SEVEN SISTERS FOR THE GOOD OF THE WEST โ€ฆ AND THEIRS TOO

When Western countries realised the strategic importance of oil at the end of the First World War, it was a development as extraordinary as digitalisation today. The bankers of the day understood that oil would revolutionise mobilityโ€‰โ€“โ€‰a basic human needโ€‰โ€“โ€‰so they invested heavily and the oil industry flourished. Big oil companies were born and developed, just like GAFA today. They became so powerful that the โ€˜Seven Sistersโ€™ formed a cartel. The Achnacarry Agreement (in the Scottish Highlands) established a method for setting the world price of oil and strengthened the position of the signatories by setting percentage increases for the future. It also streamlines the global oil industry to the benefit of consumers and producers, as other provisions establish product standardisation. As at present, both producers and consumers are winners, the latter because petroleum products radically improve their living conditions and make work less arduous. But the former are getting richer and investing more and more in innovation. The losers are undoubtedly the oil-producing countries, mainly east of the Suez, which receive only baksheesh for their crude oil. 

The Second World War confirmed the crucial importance of what would become black gold. At the end of the war, the oil companies continued to dominate the oil world in the free world, with the support of the United Kingdom and the United States. Attempts were made to reverse the situation. In Iran in 1951, the government of Dr Mohammad Mossadegh nationalised oil, but Iran had to back down. In 1956, a skirmish over the Suez Canal caused a crisis that lasted only a few days. 

In the 1960s, Enrico Mattei, the Italian president of Agip (now ENI), tried to persuade oil-producing countries to accept a โ€˜fifty-fiftyโ€™ deal, but he died in a plane crash before he could implement his project. Mattei had the genius to understand before anyone else that the world of oil was going to be taken over by governments. As this resource became so important for the economic development of the whole world, not just Western countries, the oil-producing states could no longer be content with the crumbs that fell from the table of the seven sisters. They will have to negotiate with the owners of the reserves and give them half of the revenues! 

THE SITUATION BEFORE 1973

With the outbreak of the Six-Day War in 1967, oil gradually became a key political weapon in the third Arab-Israeli conflict. In 1968, the countries of the Organisation of Petroleum Exporting Countries (OPEC), founded in 1960, declared for the first time their intention to nationalise their oil wells before the scheduled expiry of their concessions (often until the end of the century), thus removing them from the control of the Anglo-Saxon oil companies. In 1970, the dominance of the big companies began to waver. 

However, there is no need to panic, as new hydrocarbon deposits were discovered in Nigeria, Libya and Malaysia in the 1960s. In the Netherlands, natural gas was discovered in Groningen, where production ceased on 1 October 2023. In particular, oil and gas have been discovered in the North Sea, including the large Norwegian Ekofisk field. Few Member States of the European Community (as the EU was then called) had an oil policy, despite the huge sums of money and efforts that all European countries had invested in coal (the subject of the ECSC Treaty) and nuclear energy (the subject of the Euratom Treaty).

Through their representatives in OPEC, the seizure of power by Colonel Muammar Gaddafi in Libya and the Shah of Iran, and the โ€˜agreementsโ€™ imposed on the major companies in Tehran in January 1971 and Tripoli in March 1971, the producing countries succeeded in shifting the balance of power. They now set the prices and quantities produced. They were in a strong position to negotiate the conditions for acquiring a majority stake in the operating companies within increasingly tight deadlines, and they threatened or carried out nationalisations (Iraq, Algeria).

THE CLUB OF ROME MODELS HAVE GOT US INTO ALL KINDS OF TROUBLE! 

In 1972, the Club of Rome published the โ€˜Meadows Reportโ€™ (written by a father and daughter) โ€˜The Limits to Growthโ€™. With 30 million copies printed and translated into thirty languages, this book shaped a generation. Based on models (it was the beginning of computers), it predicted that oil reserves would run out by the year 2000. Everyone believed it, including me, which enabled me to do a PhD in the field. This report โ€˜toโ€™ the Club of Rome is still praised by the degrowth movement, even though all its predictions have turned out to be wrong. Even Ursula von der Leyen told the European Parliament on 15 May that the Club of Rome had warned us to stop economic and demographic growthโ€ฆ

The Libyan Colonel Muammar Gaddafi rejoiced in the fear of the end of oil in 2000. Three years earlier, on 1 September 1969, he and Marshal Haftar, who now controls part of Libya, had overthrown King Idriss of Libya. Once in power, the young colonel nationalised the oil industry and created the National Oil Corporation. The unfair tax regime he imposed on foreign companies did not encourage major American companies to stay in the country. Today, as in the past, the first condition for producing oil is stability in the country, but in Gaddafiโ€™s Libya the opposite is true. Libyan production is falling and has never returned to its pre-1969 level of 3.5 million barrels a day. The revolution has run out of cash. Oil prices need to rise to consolidate the power of the new regime.
Since the useful idiots believe the catastrophist models of the Club of Rome, the Colonel will exploit the fear of the end of oil and convince others to follow him in order to drive up the price of crude oil. The Club of Rome gave the Arab-Muslim countries a powerful weapon by making them believe, on the basis of models that turned out to be false, that the end of oil was near. It was the perfect opportunity for the OPEC countries, under the impetus of the Libyan colonel, to use their reserves to influence Western policy towards Israel.

YOM KIPPUR WAR TRIGGERS THE FIRST OIL SHOCK

On 6 October 1973, the Jewish holiday of Yom Kippur, while the whole of Israel was celebrating the โ€˜Great Pardonโ€™, Egypt and Syria attacked Israel to force it to return to the territories conquered in the 1967 Six-Day War. The price of oil skyrocketed. To force the Western countries to put pressure on Israel, the Arab oil-producing countries, OPAEC (not OPEC), meeting in Kuwait City ten days after the start of the war, raised the price by 70% and reduced the rate of oil exports to Europe and America by 5%. Supported by the Sovietsโ€‰โ€“โ€‰the Communists never miss an opportunity to oppose freedomโ€‰โ€“โ€‰the Arab countries of OPEC caused the price of crude oil to soar, triggering a global energy crisis that is still being felt today. They set the price of oil at 5.75 dollars a barrel, compared with 3 dollars the day beforeโ€ฆ

But OPECโ€™s oil production is essential to balance the worldโ€™s demand for oil. Oil has become a political weapon in the international struggle against Israel and its allies. Production is cut by 5% a month and embargoes are imposed on countries deemed unfriendly and directly dependent on the outside world for almost two thirds of their imports: the United States, the Netherlands, Portugal and South Africa โ€˜until Israel has completely withdrawn from the Arab territories occupied in 1967 and the Palestinian people have been restored to their rightsโ€™.

At the end of the conflict on 23 October, OPEC cut its production by 25%. The consequences were immediate. On 25 December 1973 (!), at a meeting in Tehran, the Shah of Iran announced that the compromise between Saudi Arabiaโ€™s position of $7.5/b and that of the other OPEC members, who wanted $14.5/b, was $11.7/b. It should therefore be noted that Saudi Arabia is defending a minimalist position, a consequence of the Quincy Pact sealed between Saudi King Ibn Saud and US President Franklin Roosevelt on 14 February 1945, on Rooseveltโ€™s return from Yalta in the Crimea, where he had taken part in the post-World Warย II โ€˜division of the worldโ€™..

OAPEC PUNISHES WITH OILโ€ฆ

At the end of the meeting of OAPEC ministers in Kuwait on 25 December 1973, they bluntly announced that the rise in oil prices was intended to punish Israel.

โ€˜The Ministerโ€™s meeting took into consideration the real objective of the oil measures which they had adopted, which was to make international opinion aware, without permitting the economic collapse which could affect one or more peoples in the world, of the unjust situation of the Arab nation as a result of the occupation of its territories and the expulsion of an entire Arab people, the Palestinian people. They wished to reaffirm once again what they have been saying since 17 October about the measures taken, which should in no way affect friendly countries, thus drawing a very clear distinction between those who support the Arabs, those who support the enemy and those who observe a neutral positionโ€ฆโ€™

THE AFTERMATH OF THE 1973 CRISIS

OPEC found the secret of driving up the price of oil: simply turn off the Gulf spigot to drive up prices and try to influence political decisions.

The most tangible signs of the consequences of this first oil shock, which triggered the economic crisis, were a worrying rise in inflation and a global economic recession. The recycling of petrodollars partially offset these drawbacks. Energy spending accelerated the economic crisis that hit the EU, first in the form of a recession that abruptly ended the economic growth of the post-war boom. Industrial production fell, traditional sectors such as textiles, shipbuilding and steel were directly affected and bankruptcies multiplied. Developing countries had to go into debt in order to avoid the stagnation of development that had set in after decolonisation. They are still paying a heavy price today.

Much more than Mattei expected, the OPEC countries have taken control of the prices and quantities of oil produced. Before the crisis, 80% of oil was produced by private companies and only 20% by national companies. The way is clear for further increases, which are not far off. 

It looks like 2023!

THE EU ORGANISES ITSELF TO WITHSTAND THE SHOCK

But the reaction was not long in coming. The consumer countries organised themselves and quickly created the International Energy Agency, a success of Henri Kissinger and the Belgian ร‰tienne Davignon when he was at the OECD. States also reacted to reduceโ€‰โ€“โ€‰rationโ€‰โ€“โ€‰the consumption of petroleum products by declaring the famous car-free Sundays, the first of which took place on 18 November 1973. First it was for everyone, then it was for odd and even number plates. We began to talk about rational use of energy, and the slogan โ€˜In France, we have no oil, but we have ideasโ€™. Energy management became a major public issue, long before man-made climate change. They also revived the old idea of winter time from the 1930s, which then had an agricultural objective; this time it was in the hope of using less energy for lighting, but in practice it turned out that the result was insignificant.

These circumstances have led to an intensification of oil exploration, with fierce competition for new oil concessions around the world. At the same time, the cost of exploration has risen sharply with the emergence of service companies (oil and gas sector) that perform a variety of tasks (seismic, drilling, supply vessels, etc.). Despite this increase in the price of exploration, a major exploration campaign has been launched in many countries by both traditional and non-traditional producers. Across Europe, including the North Sea, but also in Argentina, Chile, Bolivia, Brazil, Colombia and Malaysia, drilling is multiplying and discoveries are continuing. In the United States alone, there are some 4,000 drilling rigs in operation. All this, of course, is accompanied by a sharp increase in the number of people involved in this activity.

At the same time, we are witnessing the search for alternatives to oil: ethanol from sugar cane in Brazil, the production of gasoline from the large Maui methane deposit in New Zealand, but also the conversion of coal into liquid or gaseous hydrocarbons; it is in this last area that I wrote my doctoral thesis, funded by the European Commission, which has been at the forefront of all these activities in order not to succumb to OPECโ€™s stranglehold on oil. But the area that has responded best to the threats from certain producing countries is North Sea production. The Commissionโ€™s Oil and Gas Demonstration Programme for technological development has made North Sea production possible (I devote several pages to this success story in my bookย Energy insecurity: The organised destruction of the EUโ€™s competitiveness). This initiative made it possible to succeed in the oil shock of the mid-1980s by bringing oil prices back to reasonable levels, both for producing countries and for Western consumers. The ecologists in the European Parliament were quick to kill this programme as soon as they came to power in Brussels-Strasbourg.

The oil counter-shock has had serious consequences for oil-producing countries. No one can control the global market. We are all interdependent, much more so today than fifty years ago. Vladimir Putin should remember that. So should Joe Biden. But what is most disappointing is that the EU team of Ursula von der Leyen and Frans Timmermans, with the help of their chief of staff Diederik Samson (a member of Greenpeace), have forged a Green Deal thatย contradicts everything we have learned in fifty years. Unless this Green Deal is radically reformed by the next European Parliament, which will be elected on 9 June, OPEC will return more powerful than it was fifty years ago.

In 1979, the second oil shock was worse, this time because of the strategic error of Jimmy Carter and Valรฉry Giscard dโ€™Estaing, who wanted to overthrow the Shah of Iran, Reza Pahlevi, and replace him with Ayatollah Khomeini, who hastened to create an Islamic state and drive out the West. But we will talk about it again in six yearsโ€™ time, on the fiftieth anniversary of the second oil shock.2023 like 1973?What can we learn from the oil crisis? Firstly, do not believe the models: a computer cannot predict the future. Why define punitive and radical policies on the basis of these projections, even if the scientists want you to believe them? Think of the models that predict the temperature in 2100. They have been proven wrong so far, but many people โ€“ fewer and fewer โ€“ continue to believe them and are pushing the EU to adopt a policy of voluntary or involuntary decarbonisation (the subject of my latest book, mentioned above). At university I know well, there are plans to penalise researchers who travel to share their work and exchange ideas with other researchers. Research has always worked this way, but based on the IPCC models, research must now stop travelling in order to decarbonise.Secondly, technological research must continue, including in the field of hydrocarbons, which will remain unavoidable because โ€“ after 44 years of multiple subsidies and support โ€“ the primary energy produced by wind turbines and photovoltaic solar panels represents only 3% of the total and will not be able to approach 100% either in 2050 or later; to pretend otherwise is as implausible as saying that the oil companies have plans for a water engine in their drawer. It was the new technologies of the day โ€“ hydrocarbon extraction and nuclear power โ€“ that silenced the geopolitics of fear. There is no need to despair of the ability of engineers to find solutions to the problems we will continue to face.

More worryingly, EU banks are reluctant to finance conventional energy projects for fear of incurring the wrath of environmental NGOs. They are reducing or even stopping funding for projects that are vital for the future, as is the case with BNP and Sociรฉtรฉ Gรฉnรฉrale, which like to show off their green credentials. On the other hand, banks outside the EU are investing heavily in the vital oil and gas sectors because they are not subject to the scrutiny of environmental NGOs.

If Brussels-Strasbourg does not change its position after the elections on 9 June 2024, we will fall into a trap similar to that of 1973. We did not know then that the Club of Rome was wrong. Today we do. There are enough energy experts to say that decarbonisation is a red herring. It is time to act if we want to avoid a shock, but this time it will not be global as in 1973, but confined to the green EU. And this shock will be far more severe than the one 50 years ago, as the rest of the world, encouraged by the BRICS+, rushes enthusiastically into conventional energy.

โ€œOil is ninety per cent politicsโ€ said the Belgian Henri Simonet in 1973, when he was European Commissioner for Energy. That was true then. It is still true, but the technological revolution that has taken place since then, and not just with shale oil and gas, means that many countries now have abundant reserves and can look to the future with more confidence than in the past, at least outside the EU. But politics remains important, as shown by the current European Commissionโ€™s aversion to  oil and nuclear energy (although the latter is improving), which is in stark contrast to the European Commissioners of 1973. As far as Iโ€™m concerned, fifty years on, โ€œoil is 50% politics, the rest is technologyโ€. 

By David Falconer, Photographer โ€“ This tag does not indicate the copyright status of the attached work. A normal copyright tag is still required. See Commons:Licensing., Public Domain, https://commons.wikimedia.org/w/index.php?curid=3575687

SAMUEL FURFARI
Samuel Furfari is an engineer, a Professor of Political Science and Applied Science at the University of Brussels. For 36 years he was a senior official in the European Commissionโ€™s Directorate-General for Energy.

Scientists: Nearly 4 Decades Of Climate Model Failure Undermines Confidence In Future Predictions

If the observations of the AMOC are wrong and the multi-model mean of the CMIP6 ensemble
members does represent the twentieth century AMOC, the only problem with the models is
that there is a large range of trends in the CMIP6 ensembles.

From NoTricksZone

By Kenneth Richard on 9. November 2023

IPCC models rooted in assumptions that we humans can and do control the Atlantic Oceanโ€™s circulation with our daily-activity CO2 emissions have been wrong since the mid-1980s. Why should we still believe in them?

The latest IPCC report continues to say it is โ€œvery likelyโ€ the Atlantic Meridional Ocean Circulation (AMOC), a fundamental climate parameter, will weaken (and unleash cooling, catastrophic storms, drought, floods) in the 21st century.

But, as the authors of a new study note, since the mid-1980s the 84 (CMIP5) and 56 (CMIP6) AMOC models have been contradicted by observations in both magnitude and sign. The AMOC has not been declining in response to increases in atmospheric CO2. There is even evidence of trend increases.

โ€œ[W]e find that neither the CMIP5 nor the CMIP6 ensemble mean are successful at representing the observational AMOC data. โ€ฆ We show that both the magnitude of the trend in the AMOC over different time periods and often even the sign of the trend differs between observations and climate model ensemble mean, with the magnitude of the trend difference becoming even greater when looking at the CMIP6 ensemble compared to CMIP5.โ€

So, as the scientists ask, why should we trust future modeled predictions?

โ€œ[I]f these models cannot reproduce past variations, why should we be so confident about their ability to predict the future?โ€

Image Source: McCarthy and Caesar, 2023

Zharkova on Solar Forcing and Globalย Cooling

The following interview will show โ€“ if there were still the need to show it โ€“ thatย the climate systemย is quite far to be well understood, thereby it isย quite far fromย the truth any claim according to which on the matterย โ€œscience is settledโ€,ย as Al Gore and the IPCC have been claiming for 20 years.

From Science Matters

Byย Ron Clutz

The Grand Solar Minimum is Coming.

Interview of Prof. V. Zharkova  by Franco Battaglia  for the Italian newspaper La Verita Excerpts in italics with my bolds and added images.

The following interview will show โ€“ if there were still the need to show it โ€“ that the climate system is quite far to be well understood, thereby it is quite far from the truth any claim according to which on the matter โ€œscience is settledโ€, as Al Gore and the IPCC have been claiming for 20 years. Valentina Zharkova is an outstanding Ukrainian scientist: she graduated from the University of Kiev in Applied mathematics, first, and then completed her PhD studies in Astrophysics from the Main Astronomical Observatory in Kiev. For the past 30 years she worked in the UK Universities of Glasgow, Bradford and Northumbria, since 2005 as a Professor of Applied Mathematics. At the present she is Professor Emeritus at Northumbria University (Newcastle, UK) and Director of ZVS Research Enterprise Ltd. (London UK).

Q. Prof. Zharkova,ย people say that the Earth is warmingย since the beginning of the Industrial revolution and that this isย due to human activities. Do you have any comment on that?

A. Actually the Earth is warming since 1690, the minimum of the Little Ice Age. In 1976, Prof. John Eddy established that the terrestrial temperature follows solar radiation deposition during solar activity cycles, increasing during the solar cycle maxima and decreasing during solar minima. Then, in 1995, prof. Judith Lean and collaborators discovered and later in 2016 Prof. Don Easterbrook confirmed that the input of solar radiation to Earth was decreased during the Maunder minimum in 1645-1710 by about 3 W/m2 leading to a decrease of terrestrial temperature during what is now called the Little Ice Age. Since 1700 and the recovery of the Maunder minimum the solar radiation deposition to Earth restored to previous level and terrestrial temperature followed solar activity cycles.

Q. Has then the solar activity been increasing during the last few decades?

A.ย No. Actually the solar activity has beenย decreasing since the 80โ€™s of the last century.

Q. This is why IPCC has concluded that the present warming is due to humans?

A. Exactly, the warming is present but it is not due to humans. They make a mistake: they assume that solar radiation is essentially constant, thereby attributing the warming to CO2โ€™s enhanced concentration in the terrestrial atmosphere.

Q. Could you clarify?

A. Within solar activity there are two important cycles: one โ€“ the small solar cycle โ€“ with a 11-year period and the other โ€“ the grand solar cycle โ€“ with a 350-year period. The grand solar cycles are separated by grand solar minima (GSMs), the most recent of them occurred during Maunder minimum (1645-1710). The GSM acts on the terrestrial environment via the cold air jets coming from Arctic and Antarctica because of the reduction of solar UV radiation and ozone abundances in the terrestrial atmosphere.  Now there is a current solar cycle (cycle number 25) is showing to have the largest numbers of spotless days than any other cycles of the last 280 years of observations. During the modern GSM, similar to Maunder minimum, the solar radiation is expected to decrease by about 3 W/m2. The terrestrial temperature is then expected to decrease in the next three decades by about 1C. This was recorded during the Maunder Minimum and the same is expected in the modern GSM (2020-2050).

But the further change of solar irradiance deposited to the Earth can be caused by other effects.

Q. Namely?

A. By orbital effects. There are well known Milankovitch cycles caused by various variation of the earth orbit eccentricity, inclination of its axis to the ecliptics, aberrations. These periods vary from 15K to 100K years and well protocolled in the terrestrial biomass. There is a shorter period of solar radiation changes with a period of about two millennia: Hallstattโ€™s cycle. It reflects medium-scale variations of the solar radiation level whose origin comes not from the dynamo activity inside the Sun but from the Sunโ€™s position with respect to the orbit focus, or barycentre, where it supposed to reside according to Kepler motion, or so called, solar inertial motion (SIM). This means that the Sun is shifted, or wobbling from its focus/barycentre position on two millennial scale, so that Sun-Earth distance has to change on the two millennial period.

Basically, this happensย because of the gravitation from Jupiter, Saturn, Neptune and Uranus, the Sun does not sit in the focus of the ellipse of the Earth orbit,ย but performs the motion called SIM (wobbling on smaller orbits) about this focus. This principle of wobbling stars is used to search for exoplanets becauseย wobbling star proves that it has a planetary system attached.ย In fact, the official ephemeris of the Sun-Earth distance taken from Paris-Meudon observatory and NASA JPL sites show that in the millennium 1600-2600 the Sun in February-June of every year is closer to the Earth orbit when the Sun is closer to the point of the spring equinox of the Northern hemisphere, leaving the Earth to be further from the Sun in August-December than in the usual elliptical orbit when the Sun is in its focus.

This SIM leads to an increase of the solar radiation deposited to the Earth every year during the first half of a year and, thus, to the increase of the terrestrial temperature in March-July of every year by approximately 10-12 W/m2 for each hemisphere. With the exchange of solar heating via the ocean the terrestrial atmosphere is heated to higher temperatures owing this SIM, and this extra heating occurs since the Maunder Minimum to last until 2600. The SIM provides the extra-solar heating of terrestrial atmosphere, which is not considered in the IPCC models.

Hence, the solar irradiance is not a constant, but changes on a scale
of 11 and 350 years, as induced by the solar dynamo action,
and on a two-millennial scale as induced by the solar inertial motion.

Q. In other words, you are saying that IPCC found in the CO2 the wrong source of increasing terrestrial temperature?

A. Yes. In fact the increase of CO2 abundances is a consequence of the temperature increase but not its reason as Patrick Moore of Canada has shown in his book. The main part of solar radiation energy is stored in the Ultraviolet (UV) region, much less in the visible spectrum and even less in the infra-red spectrum where molecules of CO2 emit. CO2 molecules only re-scatter the UV solar emission in much weaker infrared part of solar spectrum. CO2 does not have the emission energy to heat anything because its radiation is the in low energy infra-red range! The abundances of CO2 molecules increases every year, this is correct, but because the Sun deposits more radiation to Earth and other planets owing to SIM.

The IPCC models calculate the emission from the layer containing increased number of CO2 molecules by simply adding all the emission by each extra CO2 molecules appeared in the past 200 years. This is not correct! Because the emission from a thick layer of CO2 is locked inside this layer by radiative transfer effects, so that the emission emitted outside this layer has a saturation effect independent on the abundance of CO2 inside the layer!

Instead, I have shown that owing to SIM, the increase of solar radiation in this millennium will be about about 10-12 W/m2 per hemisphere and per year, until around 2600.  This means that the temperature increase will continue by further 2.5-3.0C until 2600 independently of any actions on the Earth and other planets. If this extra-solar heating is included then the whole temperature increase since Maunder Minimum is provided by the solar radiation because of SIM as it should because it is the only heating we have in the solar system.

In conclusion, the real reason of the current heating of terrestrial atmosphere since
the Maunder minimum is this extra-solar heating caused by the orbital motion of the Sun.
And currently the Sun is already visibly closer to the Earth (and other planet orbits)
during the springs and summers.

Q. Is there a way to test your theory?

A. Sure, it is. In the next 30 years it will be shown what is heating the Earth atmosphere: the Sun or human activity. Currently, the Sun is approaching the grand solar minimum (GSM) predicted by us in 2015, when the Sun itself is going into hibernation as all the observations of sunspots show, producing less and less active regions, flares, sunspots and coronal mass ejections. This should cause a steaming decrease of the terrestrial temperature by up to 1C in cycle 26 (2031-2042). This decrease should happen in spite the Sun already closer to Earth and increased by 2020 its temperature by 1.2C since the Maunder minimum.

If AGW were in action, then we would not observe any decrease
of the terrestrial temperature, only its increase.

However, this year and a few previous years show clearly that the Earth is on the course to a decrease of terrestrial temperature. We will see the terrestrial temperature to decrease and rather dramatically decrease in the next decade or two because of the reduced activity, or GSM, of the Sun.

Q. I imagine that the whole issue, including your finding, is still quite controversial. Would you then agree that it is safe to say that the matter is quite far from being settled?

A. Definitely!

Well, in the medieval age the settled model of the solar system was Ptolemyโ€™s model where the Sun and planets revolve about the Earth. They invented two circles for each planet to explain their strange jumps on the sky. The church considered the science settled then.

So settled that when Copernicus proposed in 1532 the heliocentric system, where the Sun is the main central star and all planets revolve about it, they considered it as heresy. We know what happened to Giordano Bruno and led to Galileo to deny Copernicus model to survive.

Until nearly a century later, in 1610-1620 Kepler formulated three laws of the planets revolving about the central star. But only in 1665 or 1666 Isaak Newton discovered the gravity, which was only roughly (via central star-planets) included into Keplerโ€™s laws.

And only in 1965 Jose calculated the gravity effects not only of the central star on its planets but also of the planets on the central star, thus discovering the starโ€™s motion, naming it SIM.

Maybe it is the time to progress correctly with the orbital effects
of solar and planetary motion!