How Aligned Climate Cycles Triggered Droughts That Helped Topple Bronze Age Civilizations

The Late Bronze Age Collapse (roughly 1200โ€“1150 BCE) was a dramatic period when many interconnected civilizations in the Eastern Mediterranean and Near Eastโ€”such as the Mycenaean palaces in Greece, the Hittite Empire in Anatolia, Ugarit in Syria, and othersโ€”experienced widespread disruption, destruction, or decline.

The Late Bronze Age Collapse (roughly 1200โ€“1150 BCE) was a dramatic period when many interconnected civilizations in the Eastern Mediterranean and Near Eastโ€”such as the Mycenaean palaces in Greece, the Hittite Empire in Anatolia, Ugarit in Syria, and othersโ€”experienced widespread disruption, destruction, or decline.

Major powers saw palace economies collapse, trade networks break down, cities get destroyed or abandoned, and populations shift. Egypt survived but faced invasions (e.g., by the “Sea Peoples”), while Assyria endured with contractions. It was not a total “dark age” everywhere but marked the end of the Bronze Age palatial system and a transition toward the Iron Age.

Role of Climate: Not the Sole Cause, But a Major Stressor

Climate changeโ€”specifically severe, prolonged droughts (sometimes called a “megadrought”)โ€”is one of the leading factors discussed by researchers. It likely exacerbated other vulnerabilities like economic interdependence, over-reliance on agriculture, political fragility, invasions/migrations (Sea Peoples), possible earthquakes, and social unrest. No single cause explains everything; it was likely a “perfect storm” or systems collapse.

Key evidence for drought:

Pollen records, lake sediments (e.g., Sea of Galilee), speleothems, and tree rings (e.g., juniper in Anatolia) show a shift to drier, more arid conditions around 1250โ€“1100 BCE, one of the driest periods in the Bronze/Iron Age transition.

A particularly acute multi-year drought hit ~1198โ€“1196 BCE (ยฑ a few years), coinciding with the Hittite collapse. Tree-ring data from Anatolia indicate unusually low growth, pointing to failed crops and famine.

This aridity affected rain-fed agriculture in the Levant, Anatolia, and Aegean, leading to crop failures, food shortages, and societal strain. River-based systems (Nile, Tigris-Euphrates) were more resilient.

Droughts likely triggered or amplified migrations, resource conflicts, and the breakdown of trade-dependent economies.

Recent Study (2026): Using EC-Earth to “Unravel” the Climate Mechanisms

A new study from Stockholm University (published in Science Advances, July 2026) used the EC-Earth Earth System Model to simulate Mediterranean climate over the past ~8,000 years. It provides deeper insight into why droughts were so severe then.

Main findings:

  • A long-term gradual drying trend over millennia, driven by slow changes in Earth’s orbital parameters (Milankovitch cycles), set the background.
  • Severe droughts (including those around the Late Bronze Age) occurred when multiple shorter-term natural climate cycles aligned and reinforced each other. These involved variations in the Atlantic Ocean (e.g., circulation patterns) and atmospheric dynamics.
  • This “coincidence” pushed the region past a hydroclimatic threshold, causing more intense aridity than the long-term trend alone would suggest. It reduced moisture from African monsoons and shifted rainfall patterns.

The study links these compounded effects to the pressures on agriculture and societies during the collapse period. It notes the Eastern Mediterranean as a climate “hotspot,” with lessons for modern risks: future droughts may depend on how human-caused warming interacts with natural Atlantic variability.

EC-Earth – A European community Earth System Model

EC-Earth is a state-of-the-art Earth System Model (ESM) developed collaboratively by a European consortium of national meteorological services, research institutes, and universities.

It simulates the Earth’s climate system, including interactions between the atmosphere, oceans, land surface, biosphere, cryosphere, and biogeochemical processes. Researchers use it to study climate variability, climate change, feedbacks, and future projections.

Background and Development

  • The consortium started in 2006.
  • It builds on the ECMWF (European Centre for Medium-Range Weather Forecasts) Integrated Forecasting System (IFS), leveraging expertise from weather prediction for climate modeling (the “seamless prediction” concept).
  • EC-Earth has contributed to major international efforts like CMIP5 and especially CMIP6 (Coupled Model Intercomparison Project Phase 6).

EC-Earth3 (the third generation, used for CMIP6) represents a significant advancement over earlier versions, with improved physics, new Earth system components, better performance, and flexible configurations.

_____________________________________________________________________________________

Holocene ocean-atmosphere coupling and Mediterranean sensitivity to Atlantic circulation: Lessons from the Late Bronze Age collapse

“Holocene ocean-atmosphere coupling and Mediterranean sensitivity to Atlantic circulation: Lessons from the Late Bronze Age collapse” is a 2026 paper by Katherine Power (lead author) and colleagues, published in Science Advances (DOI: 10.1126/sciadv.aed5439).

It uses climate modeling to explore long-term Mediterranean climate dynamics and their relevance to the societal stresses during the Late Bronze Age Collapse (~3200 years ago / ~1200 BCE).

Core Approach and Methods

Researchers employed the EC-Earth Earth System Model (a European community model) to simulate Holocene climate evolution (~last 8,000 years). This allowed reconstruction of ocean-atmosphere interactions, precipitation patterns, and drought variability in the Eastern Mediterranean.

The study focuses on:

  • Long-term orbital forcing (slow changes in Earth’s orbit affecting insolation and seasonality).
  • Internal variability, especially in the Atlantic Ocean (e.g., circulation patterns like aspects of the AMOC or related modes) and atmospheric teleconnections.
  • How these interact across timescales to produce hydroclimatic extremes.

Key Findings

The Eastern Mediterranean experienced a gradual drying trend over the Holocene, driven primarily by orbital changes. This created a background of increasing aridity.

Extreme droughts, including those implicated in the Bronze Age period, arose when multiple natural climate cycles (operating on different timescales) aligned in phase. This reinforcement amplified drying far beyond the long-term trend, pushing the region across critical thresholds for water availability.

Processes involved weakening of moisture transport (e.g., from African monsoons) and shifts in atmospheric circulation linked to Atlantic conditions.

This provides a mechanistic explanation for why droughts around the Late Bronze Age were particularly severe and impactful on agriculture-dependent societies.

The paper frames the Late Bronze Age as a case study (“lessons from”) for understanding Mediterranean climate sensitivity. It highlights the region’s vulnerability to compounded natural variability.

Relevance to the Late Bronze Age Collapse

The modeling supports paleoclimate proxy evidence (tree rings, pollen, sediments) of severe aridity ~1250โ€“1100 BCE. It suggests that aligned climate modes contributed to multi-year to multi-decadal droughts, stressing rain-fed agriculture, causing crop failures and famines, and amplifying societal vulnerabilities (trade disruptions, migrations, political instability).

This aligns with but deepens prior work by offering dynamic explanations rather than just describing the droughts.

Broader Implications

Paleoclimate insight:

Demonstrates the importance of ocean-atmosphere coupling and phase relationships in generating extremes, beyond simple external forcing.

Modern relevance:

The Mediterranean is a climate change hotspot. The study implies that future drought risk depends on the interplay between anthropogenic warming and natural Atlantic variability. Understanding these interactions can improve projections of hydroclimatic extremes.

Data and code are likely available via Zenodo (accompanying dataset mentioned in searches).

This is a strong example of interdisciplinary work bridging high-resolution modeling with archaeology and history.

Journal information: Science Advances

DOI: 10.1126/sciadv.aed5439. www.science.org/doi/10.1126/sciadv.aed5439

Provided: Stockholm University

Authors: Katherine Power and Qiong Zhang

Abstract

Climate variability has profoundly influenced societies in the semiarid Eastern Mediterranean. Proxy records indicate progressive mid-Holocene drying culminating in severe droughts โˆผ1250 BCE, coincident with the Late Bronze Age collapse (1300 to 900 BCE). Using the EC-Earth3-Tr8K transient Holocene simulation, we reconstruct regional hydroclimate evolution and its underlying mechanisms. The model reproduces a gradual orbitally driven aridification, spatially heterogeneous across the region, with persistent drying in the Levant but enhanced effective moisture in parts of the Balkans and Anatolia due to cooling-induced evapotranspiration decline. Superimposed on this long-term trend are extreme drought events, which arise from the alignment of Atlantic internal variability across centennial to millennial timescales, amplifying drying on an already arid background state. These results provide model-based evidence of how evolving amplitude and phase structure of Atlantic internal variability reshaped Eastern Mediterranean hydroclimate through the mid-to-late Holocene. We demonstrate that oceanic variability can manifest as abrupt regional crises when ecological and societal thresholds are crossed.

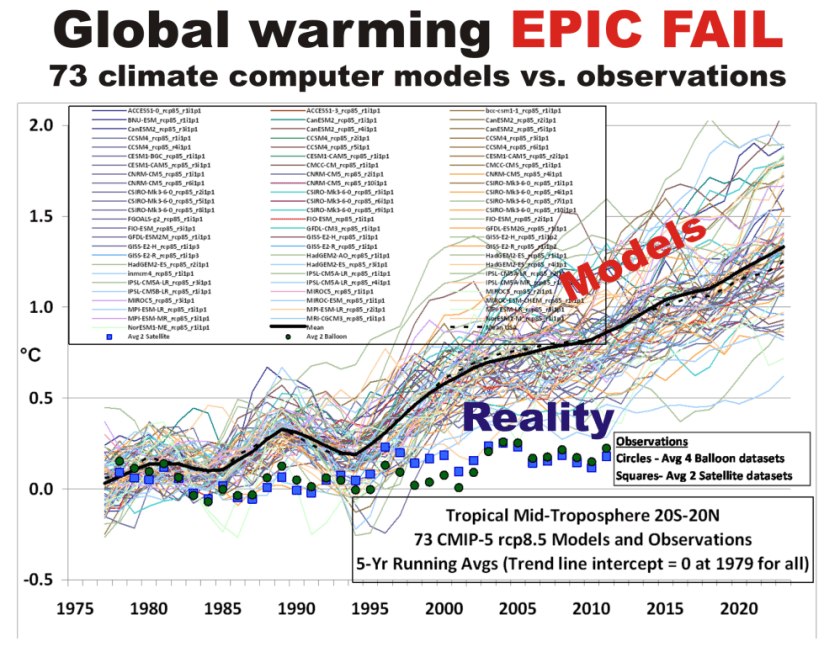
Scientists: Nearly 4 Decades Of Climate Model Failure Undermines Confidence In Future Predictions

If the observations of the AMOC are wrong and the multi-model mean of the CMIP6 ensemble
members does represent the twentieth century AMOC, the only problem with the models is
that there is a large range of trends in the CMIP6 ensembles.

From NoTricksZone

By Kenneth Richard on 9. November 2023

IPCC models rooted in assumptions that we humans can and do control the Atlantic Oceanโ€™s circulation with our daily-activity CO2 emissions have been wrong since the mid-1980s. Why should we still believe in them?

The latest IPCC report continues to say it is โ€œvery likelyโ€ the Atlantic Meridional Ocean Circulation (AMOC), a fundamental climate parameter, will weaken (and unleash cooling, catastrophic storms, drought, floods) in the 21st century.

But, as the authors of a new study note, since the mid-1980s the 84 (CMIP5) and 56 (CMIP6) AMOC models have been contradicted by observations in both magnitude and sign. The AMOC has not been declining in response to increases in atmospheric CO2. There is even evidence of trend increases.

โ€œ[W]e find that neither the CMIP5 nor the CMIP6 ensemble mean are successful at representing the observational AMOC data. โ€ฆ We show that both the magnitude of the trend in the AMOC over different time periods and often even the sign of the trend differs between observations and climate model ensemble mean, with the magnitude of the trend difference becoming even greater when looking at the CMIP6 ensemble compared to CMIP5.โ€

So, as the scientists ask, why should we trust future modeled predictions?

โ€œ[I]f these models cannot reproduce past variations, why should we be so confident about their ability to predict the future?โ€

Image Source: McCarthy and Caesar, 2023

AMOC: A Non-Tipping point

From Watts Up With That?

Gabriel Oxenstierna, Ph.D

The Atlantic Meridional Overturning Circulation (AMOC) is one of Earthโ€™s major ocean circulation systemsโ€”it redistributes heat on our planet and is a key driver of climate variability. There is a northward transport of heat throughout the Atlantic, comprising one quarter of the global heat flux (reaching a maximum of 1.3PW at 25ยฐN).

Figur 1.ย AMOC is the Atlantic section of the global Meridional Overturning Circulation (MOC). One part of it is the Gulf stream, that transports heat northwards from the tropics.

The heat transport is a balance of the northward flux of the warm Gulf Stream, Ekman pumping, and southward fluxes of cooler thermocline, and cold North Atlantic deep water. The circulation is completed after a very long time as the deep waters rise to the surface again in the Southern Ocean. The turnover period of AMOC is many hundreds of years.

Forecasts of cascading tipping points

Several studies have found evidence that both the Gulf stream and the AMOC have weakened during the last 40 years or so.[1][2][3] One highly publicized report warns that a continued weakening would have โ€œsevere impactsโ€ and increase the risk of โ€œcascading problemsโ€ for other major Earth systems, โ€œsuch as the Antarctic ice sheet, tropical monsoon systems and Amazon rainforestโ€ โ€“ see the figure below illustrating the major climate crisisย teleconnectionsย related to AMOC.[4] Climate crise effects would occur in many other areas as well. Stormier weather, more floods, collapsed plankton production, and widespread oxygen death in the oceans (anoxia) are forecast. The issue of AMOCโ€™s whereabouts is therefore of great interest.

Figur 2.ย AMOC is a centerpiece in the cascades of tipping points thought up by alarmist researchers.[4]

What the IPCC says

The IPCC AR6 report highlights AMOC as a main building block in the climate and that it potentially is one of the most important โ€˜tipping pointsโ€™.[5] Over the years, the IPCC has had dramatic projections for the AMOC. In the latest climate report (AR6) they claim that the AMOC currently is at its weakest for the last 1600 years and forecast a dramatic future decline.

Figur 3.ย AMOC-flow anomalies according to IPCC model simulations. The thick grey and black lines are the history as simulated by the two latest model generations. The colored lines are forecasts from the models according to selected emissions scenarios. Flows are in Sverdrups (Sv, million cubic meters per second). Source: AR6 WG1 fig. 9.10, which is taken from [3]

The IPCC claims that AMOC is โ€œvery likelyโ€ to weaken over the 21st century under all emission scenarios.[ch 4.3.2.3] An almost monotonous reduction by 25 to 50 percent in 2100 is predicted, depending on which scenario is chosen.

IPCC only has โ€œmedium confidenceโ€ that there will not be an โ€œabrupt collapseโ€ before 2100. If it collapsed, the worldโ€™s weather patterns would be dramatically impacted.

Model fudging begets a history revisionโ€ฆ

For the historical part, figure 3 is model based.[3] Comparing the modelled history in the older CMIP5 and the newer CMIP6 computer model ensembles, we see that AMOC is bumped up in CMIP6, especially during the second half of the 20th century up until 1990. As a result of this history revision in the models, the CMIP6 models now show a much more pronounced weakening from around 1980.

The revised history neatly fits the narrative that a decline in the AMOC is mainly caused by increased levels of greenhouse gases, i.e., that it is caused by anthropogenic global warming (AGW).

โ€ฆbut no decline seen in recent data from the Atlantic

Recently, we got an update from the measuring stations calledย RAPID, which directly measure the various flows that together constitute AMOC. RAPID measures AMOC at a series of stations, located at 26.5 N. The flows are measured in the Gulf Stream, another part is the Ekman transport, and finally the southbound return flow of different layers of cold water. These three components together form AMOC, see the red time series in the figure below (copied from the RAPID website).

Figur 4.ย Readings of the AMOC flows in Sverdrups (Sv). (A)MOC is the red curve with a flow of 16.8 ยฑ4.6Sv. It comprises the Gulf stream (green, 31.3 ยฑ3.1 Sv), the Ekman transport (black, 3.7 ยฑ3.5 Sv), and the cold, deep southbound flow (lila, -18.2 ยฑ3.4 Sv). The latest data are up until March 2022. Source:ย RAPID.

As can be seen from the figure, the AMOC did have a certain decrease at the very beginning of the RAPID measurement period, from 2004 until 2010, but after that AMOC is trend-stable. The Gulf stream shows a slight decrease, in line with the above-mentioned research, whereas the other components are stable. Volatility is also stable over time within a fairly large short-term variability.

Data collected directly in the Atlantic Ocean thus do not provide any support for the IPCCโ€™s forecasts of an ongoing collapse of the AMOC.

IPCCโ€™s forecasts disputed by field research

In recent years, a number of research reports have been published that put the IPCC forecasts into question.[6][7] Some of the researchers behind RAPID write that they canโ€™t find any signs of a weakening AMOC during the last 30 years.[6] This is the very period where the revised history from IPCC claims there is a steep decline, due to their climate models. Reality vs. fiction.

The researchers write that AMOC rather seems to be โ€œa decadal oscillation, which is superimposed on a multidecadal cycleโ€. Paleoclimatic records also show distinct multidecadal variability of the AMOC.

Which are then the dominant feedbacks and their associated timescales in AMOCโ€™s natural variability? Is AMOC variability periodic, or quasi-periodic? The timescales, as well as the mechanisms behind these natural variations remain unexplained. This is no wonder, given the currentโ€™s extended turnaround time (100โ€™s of years). The IPCC itself is not too sure about the state of the AMOC: โ€œGiven the large discrepancy between modelled and reconstructed AMOC in the twentieth century and the uncertainty over the realism of the 20th century modelled AMOC response (Section 3.5.4.1), we have low confidence in both.โ€ (p. 9-32)

Summing up

  1. The model makers have managed to create an impression of a steeper decline in the AMOC from 1990 and onwards by manipulating the models from the CMIP5 to the CMIP6 model generations. This manipulation of the history fits the climate crisis narrative that a decline in the AMOC is caused by greenhouse gas emissions and AGW.
  2. The IPCC is not too convinced and gives a โ€œlow confidenceโ€ to the models. This doesnโ€™t stop the IPCC from forecasting a sharp and monotonous decrease of the AMOC as โ€œvery likelyโ€œ. They promote a climate crisis narrative entirely built on models they themselves give a low confidence rating.
  3. The issue of natural variability is pertinent to all discussions on the AMOC, but remains unresolved. This doesnโ€™t stop the IPCC from giving the primary role in AMOC developments to the effects of greenhouse gas emissions and AGW.
  4. The empirical data on the water flows in the various strands of the AMOC in the Atlantic show no decline in the last 30 years. The AMOC is stable and doesnโ€™t show any sign of decline.

References

[1] Robust Weakening of the Gulf Stream During the Past Four Decades Observed in the Florida Straits, Piecuch and Beal, 2023, https://doi.org/10.1029/2023GL105170

[2] Observation-based early-warning signals for a collapse of the Atlantic Meridional Overturning Circulation, Niklas Boers, Nature 2021, https://doi.org/10.1038/s41558-021-01097-4

[3] Aerosol-Forced AMOC Changes in CMIP6 Historical Simulations, Menary and 13 co-authors, 2020, https://doi.org/10.1029/2020GL088166

[5] IPCC SROCC โ€œExtremes, Abrupt Changes and Managing Risksโ€, Chapter 6.7, https://www.ipcc.ch/site/assets/uploads/sites/3/2022/03/08_SROCC_Ch06_FINAL.pdf

[4] Exceeding 1.5ยฐC global warming could trigger multiple climate tipping points, Armstrong McKay and 5 co-authors, Science 2022, https://doi.org/10.1126/science.abn7950

[6] A 30-year reconstruction of the Atlantic meridional overturning circulation shows no decline, Worthington and 5 co-authors, 2021, https://doi.org/10.5194/os-17-285-2021

[7] A stable Atlantic Meridional Overturning Circulation in a changing North Atlantic Ocean since the 1990s, Fu and 4 co-authors, Science 2022, https://doi.org/10.1126/sciadv.abc7836

Gabriel Oxenstierna is a PhD at Stockholm University and one of the Clintel signatories.

Sun, Temperatures, and Models

The question naturally arisesโ€”just how much does the surface temperature go up for each additional W/m2 of absorbed radiation at the surface?

From Watts Up With That?

Guest Post by Willis Eschenbach

PART THE FIRST โ€“ REAL WORLD

Well, my monkey mind started thinking about the relationship between how much sunshine is absorbed at the surface and the surface temperature. Hereโ€™s the CERES satellite data showing the relationship:

Figure 1. Surface temperature and how much solar radiation is absorbed at the surface. Radiation is in watts per square meter (W/m2).

As weโ€™d expect given our daily experience, more sunshine raises the temperature and less sunshine lowers the temperature.

The question naturally arisesโ€”just how much does the surface temperature go up for each additional W/m2 of absorbed radiation at the surface?

We can approach this question in three different ways. First, hereโ€™s a scatterplot of the monthly values shown in Figure 1, along with the trendline.

Figure 2. Scatterplot, monthly surface temperature versus how much solar radiation is absorbed at the surface. Because there is uncertainty in the monthly averages, I have used Deming regression rather than standard linear regression.

The second way to calculate the relationship between the surface temperature and surface absorbed sunshine is by linear regression on a gridcell basis, weighted by the area of the gridcells. This gives us the same answer, 0.22 ยฐC per each additional W/m2 of absorbed solar radiation.

The third way to examine the relationship looks at the long-term averages of both temperature and absorbed solar radiation as a scatterplot on a gridcell-by-gridcell basis. This allows us to see what is happening at different temperatures.

Figure 3. Scatterplot, gridcell averages, temperature versus average absorbed solar radiation. The slope of the red line shows the trend of temperature with respect to absorbed solar radiation at various temperatures.

There are several interesting things about this graph. First, over most of the earth (central region above), the relationship between absorbed solar and temperature is pretty linear, with an average trend (slope of the red line) being 0.21 ยฐC per W/m2.

To assist in understanding this, hereโ€™s a graphic showing how much solar radiation is absorbed at the surface.

Figure 4. Surface absorbed solar radiation (downwelling radiation minus reflected radiation)

You can see the effect of the nearly continuous clouds at the Intertropical Convergence Zone (ITCZ) as a yellow stripe just above the equator.

To return to Figure 3, in the areas where there is little sunlight, the temperature increases very rapidly with increasing sunshine. Here is a map of where those areas are.

Figure 5. Parts of the world where the annual average absorbed solar radiation is less than fifty watts per square meter.

And at the right-hand end of the scale in Figure 3, surprisingly, in areas where average absorbed solar is above about 210 W/m2, increasing the absorbed sunlight doesnโ€™t warm the surface much at all. The average response in the colored areas shown below is 0.03ยฐC per W/m2. Go figure. Here are those locations.

Figure 6. Parts of the world where the annual average absorbed solar radiation is greater than two hundred ten watts per square meter.

The horizontal dotted lines above and below the Equator on the map in Figure 6 show the limits of the tropics. Note that most of the tropical oceans donโ€™t warm much further in response to absorbed solar radiation increasing byond 210 W/m2.

And at the end of that, we have three different estimates of how much temperatures go up when solar goes up and go down when solar goes down. All three of them are on the order of a 0.2 ยฐC temperature change for each 1 W/m2 change in absorbed sunshine. And all three show that temperature varies with absorbed sunshine, going up with more sunshine and down with less sunshine, just as we see every day.

PART THE SECOND โ€“ MODELWORLD

After I looked at what is actually happening, I thought Iโ€™d take a look at what the models say is happening. The model data is available at the marvelous KNMI website by selecting โ€œMonthly CMIP5 scenario runs. These are from the Fifth Computer Model Intercomparison Project (CMIP5). The surface air temperature is identified as โ€œTASโ€ (temperature air surface). Downwelling solar at the surface is โ€œRSDSโ€ (radiation shortwave downwelling surface), and reflected surface solar is โ€œRSUS (radiation shortwave upwelling surface). The absorbed radiation is the downwelling solar minus the reflected solar.

I started with the temperature data. I was interested in the historical data, which is essentially identical for the four โ€œScenariosโ€, yclept RCP26, RCP45, RCP60, and RCP85. I used the RCP26 data. The historical data ends in 2012. Hereโ€™s the CMIP5 mean global historical surface temperature reconstruction compared to the Berkeley Earth global surface temperature.

Figure 7. Berkeley Earth and CMIP5 model temperatures compared.

Well, thatโ€™s pretty respectable. The models have done a decent job of emulating the major changes in the historical temperature. (It does bring up the question of how different models with widely differing climate sensitivities can all hindcast the temperature so well, a question I discussed in โ€œDr. Kiehlโ€™s Paradoxโ€ โ€ฆ but I digress.)

Having done all of that, I went to look at the modeled absorbed solar radiation โ€ฆ and my eyes bugged out of my head. Hereโ€™s that modeled result. As with temperature, the solar results are basically identical for the four scenarios, so Iโ€™m showing RCP26.

Figure 7. CMIP5 RCP26 historical surface absorbed solar radiation anomaly.

YIKES! Temperatures are going up and absorbed sunlight is going down? Say what? How unbelievable is that?

But wait, as they say on TV, thereโ€™s more! Hereโ€™s the same RCP26 solar data, this time including their projection of absorbed solar at the surface out to the year 2100.

Figure 8. CMIP5 RCP26 historical and projected surface absorbed solar radiation anomaly.

Itโ€™s โ€ฆ curious. Modeled surface absorbed solar is decreasing over the historical period all the way right up to 2012, and then it immediately turns around and starts increasing.

Probably just a coincidence.

But consider โ€ฆ if they somehow get rising historical temperatures with falling historical absorbed solar radiation, think of how high their future projections will be with rising absorbed solar radiation. Itโ€™s a win-win situation for the alarmists!

And how come Iโ€™m the guy who notices these things and not the good folks running the models or the people at CMIP5?

Always new questions.


Here on the northern California coastal hillside where I live, we are in the midst of an all-too-frequent occurrence โ€ฆ Pacific Gas and Electric, aka PG&E, canโ€™t keep the electricity on. Once again, weโ€™re out of power. Sigh. I just fired up my reliable fossil-fuel-powered Honda i2000 generator, strung the extension cords, and Iโ€™m back in business.

But never fear, the geniuses running California have a brilliant solution for the endless outages, brownouts, rolling blackouts, and power shortages.

You ready for their plan? Here it is:

  • Increase even further the amount of unreliable, intermittent renewable wind and solar electric generation
  • Jack the already outrageous ($0.34/kWh) electrical prices even higher to discourage demand
  • Increase the grid load by banning the sale of gas-powered lawnmowers, leaf blowers, garden tractors, chainsaws, etc. by 2024
  • Increase the grid load further by banning the sale of gas-powered generators like mine shown above by 2028
  • Close the one remaining nuclear power plant, and
  • Drive the load on the grid through the roof by forbidding the sale of gas-powered vehicles after 2035 โ€ฆ

Yeah, thatโ€™s the ticket. Thatโ€™ll reduce the brownouts, rolling blackouts, and total outages. Plus it will screw the poor today, but hey, weโ€™re helping the poor in the year 2050 and saving the world, so itโ€™s all for the best in this best of all possible worlds โ€ฆ

Buncha frickenโ€™ rocket surgeons, alright.

My best to all,

w.

You know it but I still gotta say it: When you comment, please quote the exact words you are referring to. This makes everything clear, and avoids the misunderstandings that seem to proliferate on the intarwebs.

Is the Antarctic-driven abyssal ocean overturning doomed in 2050?

Probably not, in spite of the recent headlines.

From Climate Etc.

by Frank Bosse

Probably not, in spite of the recent headlines.

A recent article in Nature Abyssal ocean overturning slowdown and warming driven by Antarctic meltwater by England et al. (hereafter E23) caused quite a stir in the media.  The BBC wrote:Antarctic Ocean currents heading for collapse โ€“ report.

E23 built a model to describe the formation and behavior of abyssal water masses around Antarctica.  The Antarctic abyssal waters are important due to its impact on the overturning circulation (AOC) โ€“ the lower cell of the Meridional Overturning Curculation (MOC) โ€“ which overturns heat, freshwater, oxygen, carbon and nutrients in the abyssal ocean.  The AOC directly influences warming and the availability of nutrients to support marine life near the surface of the ocean.

Here is a schematic of the global MOC:

Fig.1.: The global MOC, a reproduction of Fig.1 of Marshall / Speer (2012).  The Antarctic Bottom Water (AABW) is shown on the left side in descending blue arrows.

E23 concludes:

โ€œIn particular, a net slowdown of the abyssal ocean overturning circulation of just over 40% is projected to occur by 205โ€

According to E23, this would also have some impact on the Atlantic Meridional Overturning Circulation (AMOC), which is responsible for the vast majority of the northward heat transport on earth:

โ€œAs the meltwater release from Greenland and Antarctica increases over time, the AABW overturning and AMOC strength both weaken by 2050.โ€ (AMOC by 19% shows Fig. 2).

The cause is the additional meltwater from the Antarctic ice shelves, which has a widespread impact on the Antarctic Bottom Water (AABW):

โ€œFirst, the projected addition of Antarctic meltwater causes an anomalous freshening . . . which produces fresher and less dense AABW, and eventually reduced AABW volume, after the 2030s.โ€

The key figure of E23:

Fig.2: A reproduction of Fig. 3a, b in E23. The Antarctic melting will lead to a reduction under the influence of the anthropogenic forcing (aka โ€œClimate Crisisโ€) of the AABW of 42% (a) in 2050, shown in red. In black: without this forcing.

In Fig. 2 (b) the AMOC shows a robust downward trend over 2004-2020; this is not the case in the observations of โ€œRapidโ€ at 26.5N; ย there is much internal variability, with a dip in 2010 and thereafter a slightly recovery.

Figure:  Observations of the AMOC 2004 to 2020 of โ€œRapidโ€ at 26,5ยฐN:  Source.

Letโ€™s now have a look how the authors calculated the melting up to 2050, which is a crucial input of the described model for the AABW. From the Methods section of E23:

โ€œโ€ฆand the multi-model ensemble mean of CMIP6 models under a high- anthropogenic-emissions scenario, Shared Socioeconomic Pathway 5-8.5 (SSP5-8.5), for the future climate component from 2020 until 2050.โ€

In a twitter thread the lead author stated (and provided a โ€œSharedItโ€ link to read the full paper, thanks for this):

โ€œโ€ฆour projections were run under a โ€˜business as usualโ€™ scenario. Deep and urgent emissions reductions will give us a chance of avoiding an ocean overturning collapse.โ€

Is SSP5-8.5 (or RCP 8.5 in IPCC AR5) โ€œBusiness as usualโ€? Not so, stated this comment, also in โ€œNatureโ€:

โ€œStop using the worst-case scenario for climate warming as the most likely outcomeโ€.

Its projections of future greenhouse gas emissions are generally acknowledged to be unrealistic even on pessimistic assumptions.

Furthermore: is the Multi -Model Ensemble mean (MME) of the CMIP6-models appropriate for this approach? No, the MME mean is skewed high owing to a high climate sensitivity due to some models running much too hot. Gavin Schmidt:

โ€œThe default behavior in the community has to move away from considering the raw model ensemble mean as meaningful.โ€

This leads to an urgent need of a discussion of the choice of SPS5-8.5 and the CMIP6 ensemble mean in E23. Unfortunately the paper doesnโ€™t do this, so I will do it in this blog post.

What effect does the choice of the projected temperatures in the Antarctic for 2020 to 2050 have, which in turn influences the expected melting?

With the help of the KNMI Climate explorer I investigated the expected trends, first for the settings used in E23:

Fig.3: The linear temperature trends in and around Antarctica for SPS5-8.5 and the MMM of the CMIP6โ€™s, as it was estimated in E23.

In comparison, the not-so-skewed CMIP5โ€™s MME mean for the more likely RCP4.5 scenario:

Fig.4: The linear temperature trends for RCP4.5 in and around Antarctica.

Note that the trend slopes in the crucial melting areas of the western Antarctic (including the Ross Sea and the Weddell Sea) are nearly 50% steeper in the Fig. 3 than in Fig. 4. This results in a warming in this area from 2020 to 2050 of 0.6 K (Fig.4) based on RCP 4.5 and the CMIP5 MME mean; in Fig. 3 it results in 1.3 K based on SSP5-8.5 and the CMIP6 MME mean.

However, these are climate model simulation results. Letโ€™s compare the spatially resolved linear trends of grid cells for the area 60ยฐS to 90ยฐS in the time span 1990 to 2021, virtually the same length as the 30 years long time span 2020 to 2050 in E23 for the observations (GISS) and the โ€œnot so hot caseโ€ of Fig.4:

Fig.5: The spatial trend slopes of the gridded data for the CMIP5 models with the scenario RCP 4.5 (left) and observations, GISS (right) for the time span 1990-2021 (โ€œHindcastโ€)

Not only do the simulations warm far too quickly in Antarctica and its environs over the last 30 years,
but the modeled warming is poorly correlated with observed warming in most grid cells (Fig.5)

In wide and crucial areas for the forming of the AABW especially on the coastlines (with the exception of the Ross Sea on the bottom) the observed and modelled trends are quite different โ€“ in the observations the trends are near zero.

The more realistic scenario CMIP5 RCP4.5 shows a twice as fast warming in the Antarctic (60ยฐS-90ยฐS) as the observations, and the CMIP 6-SSP5-8.5 mean scenario shows an almost 3 times faster warming in the โ€œhindcastโ€ period 1990 to 2021 despite the fact that there is relatively little difference in greenhouse gas emissions and changes in other drivers of climate change between the SSP5-8.5 and RCP4.5 scenarios and observations during that period.

In the light uncertainty of the spatial resolved trends in the observations, I use the relation of the trends of the entire Antarctic region, estimating that the warming bias in models will persist to 2050. This would lead to an additional warming of only 0.3K for 2020 to 2050 in the Western Arctic, 23% of the estimation in E23.

Conclusion

Neither the sole warming scenario nor the multi model CMIP6 ensemble mean used by E23 to estimate the melting in Antarctica up to 2050 is appropriate. The resulting MME mean heavily overestimates the likely surface warming and hence the melting, making it โ€œnot meaningfulโ€ (see Gavin Schmidtโ€™s citation) as input for the AABW-model used in E23.

For the crucial regions, the trend slopes 1990 to 2021 in the observations are only about one third of the simulations used by E23. Moreover, projected future greenhouse gas emissions and levels are unrealistically high in SSP5-8.5 scenario used by E23. This suggests that future surface warming in and around Antarctica is likely to be far lower than E23 assumes, which in turn means ice melting and hence the slowing of the abyssal ocean overturning would be much less than E23 projects.

E23 moreover concluded that the ocean freshening due to melting near parts of the western Antarctic (namely Ross Sea and Weddell Sea) will lead to the described reduction of the AABW within 30 years to 2050. I had a look at the observational โ€œArgoโ€ data, provided by the โ€œMarine Atlasโ€. Until December 2021 there is no trend in the salinity data, here shown for the average 0-2000 m depth in the Weddell Sea:

Fig. 6: โ€œArgoโ€ observations of the ocean salinity near the Weddell Sea. In the area of the Ross Sea, there is also no trend (not shown) . The figure was generated with the โ€œMarine Atlasโ€.

The problems with this paper are: reliance on the implausible SSP5-8.5 emissions scenario, use of the CMIP6 multi-model ensemble mean which is running too hot, and failure to critically evaluate the model simulations using recent observations.  Further failures by Natureโ€™s review and editorial process, combined with uncritical and amplified media promotion,  have unnecessarily confused the science and public.

Acknowledgement: I thank Nic Lewis for very helpful comments on earlier draft versions.