Sun Rules Earthย Climate

Today weโ€™re talking again aboutย Grand solar minimum, but I also speak about a little bit of solar radiation and verification of the new solarย activity index we discovered with the existing one which is derived by averageย Sunspot number.

From Science Matters

Byย Ron Clutz

On February 12, 2025, Tom Nelson conducted the above interview with solar physicist Valentina Zharkova:ย Grand solar minimum is underway.ย Below is my synopsis of lightly edited transcript excerpts from the closed captions along with key graphics in her presentation. H/T Chiefio

The full content of the video is:

Timeline of segments:
0:00 โ€“ Introduction to Valentina
0:35 โ€“ Understanding the Solar Cycles
4:25 โ€“ Challenges In Measuring Sun
5:10 โ€“ Discovering The Background (magnetic fields)
6:00 โ€“ Analyzing Magnetic Waves
7:50 โ€“ Predicting Solar Activity
14;45 โ€“ Grand Solar Minimum
27:25 โ€“ Implications of the Grand Solar Minimum
37:55 โ€“ CO2 and Temperature Correlation
39:10 โ€“ Solar Cycles and Earthโ€™s Temperature
42:45 โ€“ Solar Inertial Motion and Climate
48:30 โ€“ Future Climate Predictions
1:05:20 โ€“ Volcanic Activity and Climate
1:07:30 โ€“ Earthโ€™s Magnetic Field
1:12:10 โ€“ Concluding Thoughts

Transcript Excerpts

Today weโ€™re talking again aboutย Grand solar minimum, but I also speak about a little bit of solar radiation and verification of the new solarย activity index we discovered with the existing one which is derived by averageย Sunspot number.

Understanding the Solar Cycle and Sunspots

The solar activity cycle is about 11 years and on the Sun, it occurs that in the start of the cycle on the left image the sun has Southern polarity. ย And during the cycle this polarity slowly migrates in the opposite direction and so the next solar minimum you have polarity changed and this happens approximately every 11 years. so basically, what is happening the loops appear in the Solar surface and the occurring as the active region for forming coronal mass injections flares and different fluxes towards the Earth and other planets.

So, in the past we were dealing with the sunspots.ย ย In the 18th century Wolff discovered that this Sunspot appears on this latitude 30ยฐ and migrates slowly towards the equator and basically this is the basic Solar activity index using daily average Sunspot numbers.

Why we love sunspots and why we support this for a couple of centuries is because sunspots actually are Roots which are embedded into the Photosphere (the surface layer of the Sun that gives off light).ย  And we see them from outside with the naked eye but basically, they are the places where magnetic Loops are embedded.

The problem with Sunspots is that we see only a few of them. ย Even with this Solarย maximum thereโ€™s only aย small part of the solar surface covered with them. Whatever we use to detect them, always the Sunspot index is defined by people manually. ย They agreeย from different observatories what number of sunspotsย which configuration Etc. ย So, the Sunspotย number changes during 11-year cycle.

Discovering The Background (magnetic fields)

So, we decided to look at the background field in which these sunspots are embedded so on the top is the B is the background magnetic field measured at solar observatory in Stanford with orange. So you see clearly that the leading polarity of Sunspot always opposite to the polarity of the background magnetic field in that hemisphere. ย It was not only us who detected this it was others as well, so it was very encouraging. We decided we can detect solar activity with much better accuracy.

The black curve is our summary modulus summary curve, and the red is a sunspot number, and you see that a Vector summary Eigen vector will represent this Solar, remembering that our index represents the magnetic field of the background Sun. In 2022 we added Cycle 24 and discovered that our curve still represents Sunspot index. ย At the bottom is the summary curve modulus summary curve cycle 25 where we are now. Here we see our prediction that the maximum will be actually year 23-24 and now there will be a very sharp drop of the activity, and we have two little Maxima before the minimum between cycle 25-26. ย Cycle 26 will have very low amplitude, 70% lower than the previous two cycles.

So how itย works. ย ย If you have two waves on the top two black wavesย which are running with the same amplitude but if the face difference is zero you have constructiveย interference. ย ย In the cycle 26 we can see theย amplitudes are going opposite with the resulting amplitude becomingย zero. ย ย Thisย is what we observe on the sun, and I teach my first-yearย physics students how they interact. ย ย Thereโ€™s no miracle, justย basic physics of the waves and thisย effect called beat effect.

Implications of the Grand Solar Minimum

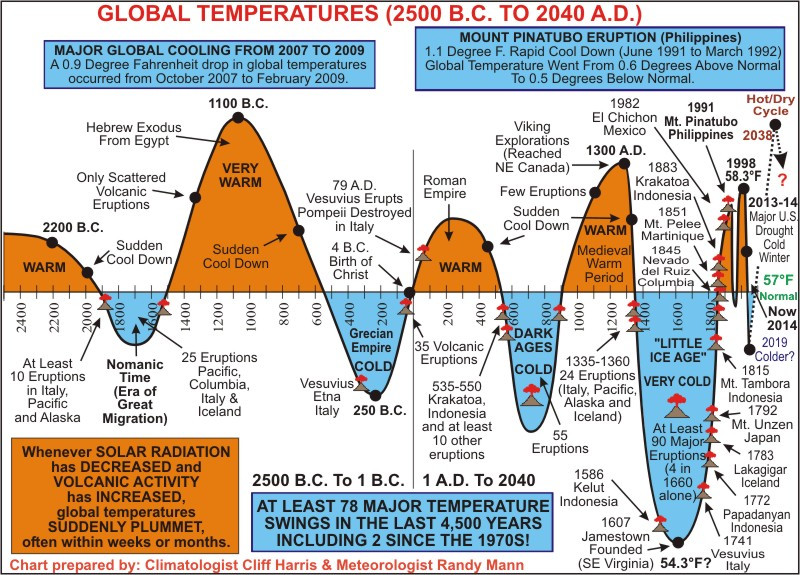
Now we come back to solarย radiance and climate so first we now know that we entered intoย a grandย solar minimum,ย the temperature started decreasing. ย But the problem with the grand solar minimum isย that duringย previous Grand solar minimum,ย which was the Maunderย minimum in 17th century, the Solar Radiance reduced by 3ย wattsย per square meter approximately.ย But the temperature during Maunder minimum decreased approximately by one degree maximum.

Different investigationsย show slightly different variations but mostlyย they all reconstruct temperaturesย during and after the minimum to find where the surface temperatureย was reduced on the globe.ย So, this is what you seeย forย Northern Hemisphere,ย this isย Europe,ย very dark blue is reduction ofย temperature by one degree. ย ย And it is mostly all Europe,ย Russiaย and Siberia,ย and also all Northern America and Canada.

So basically this is probably we are heading towards now. ย We have noticed the cold flashesย from the drop of the temperature that occurred because drop ofย abundance of ozone created by solar ultraviolet light in the stratosphere. ย If the solar radiation is reduced,ย thisย layer abundance of ozone is reduced, and it affectsย planetary atmospheric waves.

In the left image Globe, the stable just stream flows somewhere in this path andย separate middleย latitude from the north Northern latitude,ย but when ozone layerย is reduced it causes giant Wiggles in just stream shown in the right plot calledย wind from arctics can now penetrate to the southern latitudes as shown on theย picture. ย It kicks off North Atlantic oscillation and balance between permanentย low-pressure system near Greenland and permanent high-pressure system and the South into Negative PH.ย It wasย reported 24 years ago go and it works now.

We are trying now to say that the temperature will be increasing becauseย the sun become closer to us but the sun is very humaneย it gives us this grandย solar minimum for 30 years to sort out our understanding how the heating comesย through and then prepare for the next stage of heating which come does no matterย what we do on Earth;ย if we stop using fuels, we crawl toย the caves and start using I donโ€™t know whatย energy. ย ย All people will die still theย temperature will increase;ย it doesnโ€™t matter what we do.

So, this prediction ofย theย anthropogenic global warming people is not working. ย The temperature will beย increasing no matter what we do with CO2 because the increase of theย temperature comes from the solar inertial motion. ย ย So, this myย conclusion: We had this globalย warmingโ€“it is real; it is not caused by humans because human only contribute 6% maximum of all CO2. ย And CO2 is a very good gas because it is mostly absorbed byย the plants and not by humans.

Global warming is caused by this Solar inertial motion and gravitation of large planets which drag the Sun from the center Body Center closer to the planets and this causes the increase of the  temperature.  And the temperature as I shown in my book will increase by 2.5-3ยฐ by 25-2600 years. This is the end of the story.

TN: Thank you it sounds like weโ€™re due for some cooling between now and 2053 but warming in general between then and 2600.  Iโ€™m curious, do you think weโ€™re going to see the temperatures freeze over at all?

Yes, Iโ€™m confident it will be freezing from 2031 to 2042 for sure.  This will be the worst period of cold air and cold temperature and not only temps.  Rivers and the ponds will be freezing all right and other dramatic things that might happen.  Itโ€™s going to be a lot harder to grow wheat in Canada for example, I would guess during that time absolutely.  In 17th century people heated their houses with their own fireplaces, now we have central heating.  If we donโ€™t have electricity even our Central heating is not working, so you need to have the portable generators run from fossil fuel or have a wood stove in your house.  At that time people grew up something in their Gardens, now people donโ€™t know how to grow up anything, so it will be really really difficult.

How we know that the sun changes the Climate. Part I: The past

The Sun is a variable star and the amount of energy it emits varies from month to month, year to year, and century to century. One of the manifestations of these variations are sunspots, which are more common when the Sun is more active and disappear when it is less active.

From Climate Etc.

By Javier Vinรณs

Part I of a three part series.

The Sun is a variable star and the amount of energy it emits varies from month to month, year to year, and century to century. One of the manifestations of these variations are sunspots, which are more common when the Sun is more active and disappear when it is less active. These spots follow a solar cycle of about 11 years, but sometimes there is a longer period, decades or centuries, when the Sunโ€™s activity is so low that there are no spots. These periods are called grand solar minima. There are also periods of decades or centuries when the activity is higher. These are called grand solar maxima.

The Sun provides 99.9% of the energy that the climate system receives. So, there have always been scientists who thought that variations in the Sun were the cause of climate change. The problem is that they never had enough evidence to prove it. Until now.

  1. The IPCC and NASA sayโ€ฆ

The IPCC and NASA are convinced that changes in the Sun have very little effect on climate. They rely on two arguments. The first is that changes in solar activity are very small. We measure them with satellites because they cannot be measured from the surface, and we know that the radiant energy coming from the Sun varies by only 0.1%. The magnitude of the changes is better appreciated when we use the full scale. Many scientists believe that such a small change can only produce small changes in climate.

The second argument is that the evolution of temperature does not coincide with the evolution of solar activity. Since the 1990s, solar activity has decreased while warming has continued.[i]

Actually, this argument is not valid because it does not say that the Sun does not affect temperature, but that it is not the only factor in doing so, something we already knew because temperature responds to many factors such as El Niรฑo, volcanoes, the polar vortex, or changes in the Earthโ€™s orbit. There are many natural causes that change the climate, and what we need to know is whether the Sun is one of the main ones.

To find out, we donโ€™t need to care what the IPCC and NASA think, we need to ask the climate itself. It doesnโ€™t matter how small the changes in the Sun are if it turns out that the climate responds strongly to them by causing big changes.

  1. Climate during the Holocene

And the best way to find out is to look at what has happened to the climate over the last 11,000 years, the interglacial period we call the Holocene. The advantage of doing this is that the Holocene climate changes could not have been caused by changes in COโ‚‚. They must have been caused by something else.

To study the climate of the past, scientists use various climate proxies that they collect in different parts of the world. A major study published in Science used 73 of these proxies to reconstruct Holocene climate.[ii] I have used the same proxies, with a slight modification in the way they are mixed.

What we see, and what a large number of studies also support, is that there was a warm period of thousands of years, called the Climate Optimum, followed by a long period of cooling, called Neoglaciation.

How do we know that this reconstruction is correct? Another study reconstructed the progress of the Earthโ€™s glaciers over the past 11,000 years.[iii] They divided the globe into 17 regions, and this graph shows the number of regions whose glaciers increased in size during each century of the Holocene.

Since glaciers grow when it is colder, we can invert their figure and compare it to the temperature reconstruction graph so that its meaning is the same. We find a high degree of agreement. The glaciers confirm what the temperature reconstruction shows. We also know that COโ‚‚ has done the opposite of temperature, but that is a story for another day.

Note: y-axis is the Z factor, which is related to temperature anomaly.

Both graphs also show some severe cooling episodes that were accompanied by increased glacier growth. These abrupt climate events of the past have been studied and identified by paleoclimatologists. Of all of them, we will focus on four of the most important ones. The Boreal Oscillation, the 5.2 kiloyear event, the 2.8 kiloyear event, and the Little Ice Age.

The four are separated by multiples of 2,500 years and form a cycle that I have called the Bray cycle because that was the name of the scientist who discovered it in 1968.[iv]

Now that we know the climate of the past, we need to talk about the activity of the Sun in the past.

  1. Past solar activity

The Sunโ€™s activity is recorded in the tree rings through the action of cosmic rays. A constant stream of cosmic rays from the galaxy reaches the solar system. Some interact with the atmosphere. Some collide with nitrogen in the atmosphere, converting it to carbon-14, which is heavier than normal carbon-12 and radioactive. This carbon-14 combines with oxygen to form radioactive COโ‚‚, which is breathed by trees. The carbon is used in photosynthesis to make cellulose, which allows the tree trunk to grow in diameter. When the tree dies, the carbon-14 in the wood slowly decays over centuries and millennia. You just have to measure how much carbon-14 is left in the wood to know how much time has passed since the tree died.

Each growth ring of a tree records the carbon-14 that was in the atmosphere that year, and scientists have used millennia-old trees and preserved logs to construct a calibration curve that spans tens of thousands of years. This allows them to determine the age of any organic remains, even if it is not a tree trunk, just by knowing the carbon-14 it contains. This is known as radiocarbon dating.

The only problem is that the production of carbon-14 by cosmic rays is not constant. The Sunโ€™s magnetic field deflects the path of cosmic rays, causing many to miss the Earth, and changes in the Sunโ€™s activity affect its magnetic field.

As the Sunโ€™s activity increases, fewer cosmic rays arrive, less carbon-14 is produced, and organic remains appear older because they contain less of it. When the Sunโ€™s activity becomes weaker, more cosmic rays arrive, more carbon-14 is produced, and the organic remains look younger because they contain more of it.

This produces deviations in the calibration curve that allow us to know what the Sunโ€™s activity was in the past.

  1. Spรถrer-type solar minima

When we analyze the radiocarbon curve over the last 11,000 years, we observe large deviations that indicate long periods of low solar activity. These extended periods of low solar activity are called grand solar minima and increase carbon-14 production by 2%. The most common ones last about 75 years, and there have been about twenty in the last 11,000 years. The most recent was the Maunder Minimum in the late 17th century. But there are other types of grand solar minima that are much more severe because they last twice as long, about 150 years. The last of these severe solar minima was the Spรถrer Minimum, which occurred in the 15th and 16th centuries.

There have been only four such Spรถrer-type grand minima in the entire Holocene. 2,800 years ago, there was the Homer Minimum, 5,200 years ago the Sumerian Minimum, and 10,300 years ago the Boreal Minimum. We know when they occurred thanks to tree rings.

If the dates sound familiar, it is because the four grand Spรถrer-type Holocene minima coincide exactly with the four major climatic events on the graph we saw earlier. We know that during each of these grand solar minima, when the Sunโ€™s activity dropped for 150 years, the climate experienced a tremendous cooling that had a major effect on climate proxies around the globe.

We also know that low solar activity during the grand minima has had a major impact on human populations. Past human settlements and their component structures can be radiocarbon dated. When humans were doing well in the past, the population grew and they built more, and when they were doing poorly, usually because there was less food, the population decreased and they built less. Scientists have estimated the evolution of the human population of the British Isles by analyzing the radiocarbon dates of thousands and thousands of remains from hundreds of archaeological excavations.[v]

What they have found is that the population increased greatly with the advent of agriculture, but every time there was a severe deterioration in the climate, the human population suffered from diminishing resources. And the largest declines occurred when grand Spรถrer-type solar minima took place. Other population declines also coincide with other cooling periods, confirming our reconstruction.

This tells us that the worst climate changes in the past have been caused by changes in solar activity. It also tells us that what is bad for humanity is cooling, not warming.

Now we can respond to the IPCC and NASA. Never mind that solar irradiance changes very little, and never mind that temperature does not always do the same thing as solar activity. Clearly there are other factors at play. But we can state emphatically that changes in solar activity affect the climate because that is what the climate says. The study of past climate leaves no room for doubt. The Sun changes the climate. And if we donโ€™t know how it does it, we should study it.

  1. The 20th century solar maximum

Since low solar activity causes cooling, it stands to reason that high activity must cause warming. Solar activity in the 20th century was very high, in the top 10% of the last 11,000 years.

If we count the number of sunspots in each solar cycle over the last 300 years and divide by the length of each cycle, we can see how much solar activity has deviated from the average. Since the Maunder Minimum, during the Little Ice Age, solar activity has been increasing and was well above average between 1933 and 1996, a period of six cycles of increased solar activity that formed the 20th century solar maximum.

Although we cannot know how much of the 20th century warming is due to this modern solar maximum, there is no denying that it is a significant part, because as we have seen, the Sun has been the cause of much of the major climate change over the past 11,000 years.

  1. Conclusions

There are two pieces of good news. The first is that solar activity cannot rise above the 20th century maximum. It is not like COโ‚‚, which can keep going up. The Sunโ€™s activity can stay high or go down, but it cannot go up, so the warming should not accelerate and should not be dangerous.

In 2016, I developed a model to predict solar activity in the 21st century. At the time, some scientists believed that solar activity would continue to decline until a new grand solar minimum and mini-ice age. But my model predicts that solar activity in the 21st century will be similar to that of the 20th century. It also predicted that the current solar cycle, the 25th, would have more activity than the previous one, and it was right.

The second piece of good news is that if much of the 20th century warming is due to the Sun, then there is no climate emergency. Believing that all climate change is due to our emissions is one of those errors that sometimes occur in science, like believing that the Earth is the center of the solar system, that interplanetary space is full of ether, or that stomach ulcers are caused by stress, not bacteria.

This article can also be

[i] NASA. Is the Sun causing global warming?

[ii] Marcott, S.A., et al., 2013. A reconstruction of regional and global temperature for the past 11,300 years. science, 339 (6124), pp.1198-1201.

[iii] Solomina, O.N., et al., 2015. Holocene glacier fluctuations. Quaternary Science Reviews, 111, pp.9-34.

[iv] Bray, J.R., 1968. Glaciation and solar activity since the Fifth Century BC and the solar cycle. Nature, 220 (5168).

[v]ย Bevan, A., et al., 2017.ย Holocene fluctuations in human population demonstrate repeated links to food production and climate.ย PNAS,ย 114ย (49), pp.E10524-E10531.

New Study: Earth Will Cool By 1ยฐC Over The Next Decades Due To The Upcoming Grand Solar Minimum

โ€œThe first modern GSM1 [Grand Solar Minimum] occurs in 2020 โ€“ 2053 with the cycle amplitudes reduction to 80% in cycle 25, to 30% in cycle 26 and to 70% in cycle 27 from the maximum amplitude of cycle 24.โ€ โˆ’ Zharkova et al., 2023

From NoTricksZone

Byย Kenneth Richardย onย 22. September 2023

โ€œThe first modern GSM1 [Grand Solar Minimum] occurs in 2020 โ€“ 2053 with the cycle amplitudes reduction to 80% in cycle 25, to 30% in cycle 26 and to 70% in cycle 27 from the maximum amplitude of cycle 24.โ€ โˆ’ Zharkova et al., 2023

Per a new study, Earthโ€™s Total Solar Irradiance (TSI) has increased by about 1 to 1.5 W/mยฒ from its depths in 1700 to its โ€œmaximum amplitudeโ€ in cycle 24 (2020). This resulted in a global temperature increase of about 1.5ยฐC during this span.

โ€œ[T]he monthly TSI variations (case a) show the increase of TSI by about 1 โ€“ 1.3 W/mยฒ in 2020 compared to 1700. This TSI increase found from the S-E distance ephemeris is close to the magnitude of 1 โ€“ 1.5 W/mยฒ reported from the current TSI observations.โ€

But over the next 30 years (2020-2053) Earth will experience a period of significantly reduced solar activity and a consequent โ€œmini ice ageโ€ climate that is โ€œsimilar to the Maunder Minimumโ€ (1645-1715 CE) that characterized the much-colder-than-today Little Ice Age period.

Temperatures will be reduced by about 1ยฐC during the next few decades; Earth will then be only 0.5ยฐC warmer than it was in 1700.

โ€œBecause solar irradiance and the terrestrial temperature already increased since the MM [Maunder Minimum] as is clearly recorded from the terrestrial temperature variations, the terrestrial temperature during the first modern GSM1 is expected to drop by about 1.0หšC to become just 0.5ยฐC higher than it was in 1700.โ€

Image Source:ย Zharkova et al., 2023

In the study, no anthropogenic or carbon dioxide concentration contribution to terrestrial temperature change is mentioned.


Zharkova on Solar Forcing and Globalย Cooling

The following interview will show โ€“ if there were still the need to show it โ€“ thatย the climate systemย is quite far to be well understood, thereby it isย quite far fromย the truth any claim according to which on the matterย โ€œscience is settledโ€,ย as Al Gore and the IPCC have been claiming for 20 years.

From Science Matters

Byย Ron Clutz

The Grand Solar Minimum is Coming.

Interview of Prof. V. Zharkova  by Franco Battaglia  for the Italian newspaper La Verita Excerpts in italics with my bolds and added images.

The following interview will show โ€“ if there were still the need to show it โ€“ that the climate system is quite far to be well understood, thereby it is quite far from the truth any claim according to which on the matter โ€œscience is settledโ€, as Al Gore and the IPCC have been claiming for 20 years. Valentina Zharkova is an outstanding Ukrainian scientist: she graduated from the University of Kiev in Applied mathematics, first, and then completed her PhD studies in Astrophysics from the Main Astronomical Observatory in Kiev. For the past 30 years she worked in the UK Universities of Glasgow, Bradford and Northumbria, since 2005 as a Professor of Applied Mathematics. At the present she is Professor Emeritus at Northumbria University (Newcastle, UK) and Director of ZVS Research Enterprise Ltd. (London UK).

Q. Prof. Zharkova,ย people say that the Earth is warmingย since the beginning of the Industrial revolution and that this isย due to human activities. Do you have any comment on that?

A. Actually the Earth is warming since 1690, the minimum of the Little Ice Age. In 1976, Prof. John Eddy established that the terrestrial temperature follows solar radiation deposition during solar activity cycles, increasing during the solar cycle maxima and decreasing during solar minima. Then, in 1995, prof. Judith Lean and collaborators discovered and later in 2016 Prof. Don Easterbrook confirmed that the input of solar radiation to Earth was decreased during the Maunder minimum in 1645-1710 by about 3 W/m2 leading to a decrease of terrestrial temperature during what is now called the Little Ice Age. Since 1700 and the recovery of the Maunder minimum the solar radiation deposition to Earth restored to previous level and terrestrial temperature followed solar activity cycles.

Q. Has then the solar activity been increasing during the last few decades?

A.ย No. Actually the solar activity has beenย decreasing since the 80โ€™s of the last century.

Q. This is why IPCC has concluded that the present warming is due to humans?

A. Exactly, the warming is present but it is not due to humans. They make a mistake: they assume that solar radiation is essentially constant, thereby attributing the warming to CO2โ€™s enhanced concentration in the terrestrial atmosphere.

Q. Could you clarify?

A. Within solar activity there are two important cycles: one โ€“ the small solar cycle โ€“ with a 11-year period and the other โ€“ the grand solar cycle โ€“ with a 350-year period. The grand solar cycles are separated by grand solar minima (GSMs), the most recent of them occurred during Maunder minimum (1645-1710). The GSM acts on the terrestrial environment via the cold air jets coming from Arctic and Antarctica because of the reduction of solar UV radiation and ozone abundances in the terrestrial atmosphere.  Now there is a current solar cycle (cycle number 25) is showing to have the largest numbers of spotless days than any other cycles of the last 280 years of observations. During the modern GSM, similar to Maunder minimum, the solar radiation is expected to decrease by about 3 W/m2. The terrestrial temperature is then expected to decrease in the next three decades by about 1C. This was recorded during the Maunder Minimum and the same is expected in the modern GSM (2020-2050).

But the further change of solar irradiance deposited to the Earth can be caused by other effects.

Q. Namely?

A. By orbital effects. There are well known Milankovitch cycles caused by various variation of the earth orbit eccentricity, inclination of its axis to the ecliptics, aberrations. These periods vary from 15K to 100K years and well protocolled in the terrestrial biomass. There is a shorter period of solar radiation changes with a period of about two millennia: Hallstattโ€™s cycle. It reflects medium-scale variations of the solar radiation level whose origin comes not from the dynamo activity inside the Sun but from the Sunโ€™s position with respect to the orbit focus, or barycentre, where it supposed to reside according to Kepler motion, or so called, solar inertial motion (SIM). This means that the Sun is shifted, or wobbling from its focus/barycentre position on two millennial scale, so that Sun-Earth distance has to change on the two millennial period.

Basically, this happensย because of the gravitation from Jupiter, Saturn, Neptune and Uranus, the Sun does not sit in the focus of the ellipse of the Earth orbit,ย but performs the motion called SIM (wobbling on smaller orbits) about this focus. This principle of wobbling stars is used to search for exoplanets becauseย wobbling star proves that it has a planetary system attached.ย In fact, the official ephemeris of the Sun-Earth distance taken from Paris-Meudon observatory and NASA JPL sites show that in the millennium 1600-2600 the Sun in February-June of every year is closer to the Earth orbit when the Sun is closer to the point of the spring equinox of the Northern hemisphere, leaving the Earth to be further from the Sun in August-December than in the usual elliptical orbit when the Sun is in its focus.

This SIM leads to an increase of the solar radiation deposited to the Earth every year during the first half of a year and, thus, to the increase of the terrestrial temperature in March-July of every year by approximately 10-12 W/m2 for each hemisphere. With the exchange of solar heating via the ocean the terrestrial atmosphere is heated to higher temperatures owing this SIM, and this extra heating occurs since the Maunder Minimum to last until 2600. The SIM provides the extra-solar heating of terrestrial atmosphere, which is not considered in the IPCC models.

Hence, the solar irradiance is not a constant, but changes on a scale
of 11 and 350 years, as induced by the solar dynamo action,
and on a two-millennial scale as induced by the solar inertial motion.

Q. In other words, you are saying that IPCC found in the CO2 the wrong source of increasing terrestrial temperature?

A. Yes. In fact the increase of CO2 abundances is a consequence of the temperature increase but not its reason as Patrick Moore of Canada has shown in his book. The main part of solar radiation energy is stored in the Ultraviolet (UV) region, much less in the visible spectrum and even less in the infra-red spectrum where molecules of CO2 emit. CO2 molecules only re-scatter the UV solar emission in much weaker infrared part of solar spectrum. CO2 does not have the emission energy to heat anything because its radiation is the in low energy infra-red range! The abundances of CO2 molecules increases every year, this is correct, but because the Sun deposits more radiation to Earth and other planets owing to SIM.

The IPCC models calculate the emission from the layer containing increased number of CO2 molecules by simply adding all the emission by each extra CO2 molecules appeared in the past 200 years. This is not correct! Because the emission from a thick layer of CO2 is locked inside this layer by radiative transfer effects, so that the emission emitted outside this layer has a saturation effect independent on the abundance of CO2 inside the layer!

Instead, I have shown that owing to SIM, the increase of solar radiation in this millennium will be about about 10-12 W/m2 per hemisphere and per year, until around 2600.  This means that the temperature increase will continue by further 2.5-3.0C until 2600 independently of any actions on the Earth and other planets. If this extra-solar heating is included then the whole temperature increase since Maunder Minimum is provided by the solar radiation because of SIM as it should because it is the only heating we have in the solar system.

In conclusion, the real reason of the current heating of terrestrial atmosphere since
the Maunder minimum is this extra-solar heating caused by the orbital motion of the Sun.
And currently the Sun is already visibly closer to the Earth (and other planet orbits)
during the springs and summers.

Q. Is there a way to test your theory?

A. Sure, it is. In the next 30 years it will be shown what is heating the Earth atmosphere: the Sun or human activity. Currently, the Sun is approaching the grand solar minimum (GSM) predicted by us in 2015, when the Sun itself is going into hibernation as all the observations of sunspots show, producing less and less active regions, flares, sunspots and coronal mass ejections. This should cause a steaming decrease of the terrestrial temperature by up to 1C in cycle 26 (2031-2042). This decrease should happen in spite the Sun already closer to Earth and increased by 2020 its temperature by 1.2C since the Maunder minimum.

If AGW were in action, then we would not observe any decrease
of the terrestrial temperature, only its increase.

However, this year and a few previous years show clearly that the Earth is on the course to a decrease of terrestrial temperature. We will see the terrestrial temperature to decrease and rather dramatically decrease in the next decade or two because of the reduced activity, or GSM, of the Sun.

Q. I imagine that the whole issue, including your finding, is still quite controversial. Would you then agree that it is safe to say that the matter is quite far from being settled?

A. Definitely!

Well, in the medieval age the settled model of the solar system was Ptolemyโ€™s model where the Sun and planets revolve about the Earth. They invented two circles for each planet to explain their strange jumps on the sky. The church considered the science settled then.

So settled that when Copernicus proposed in 1532 the heliocentric system, where the Sun is the main central star and all planets revolve about it, they considered it as heresy. We know what happened to Giordano Bruno and led to Galileo to deny Copernicus model to survive.

Until nearly a century later, in 1610-1620 Kepler formulated three laws of the planets revolving about the central star. But only in 1665 or 1666 Isaak Newton discovered the gravity, which was only roughly (via central star-planets) included into Keplerโ€™s laws.

And only in 1965 Jose calculated the gravity effects not only of the central star on its planets but also of the planets on the central star, thus discovering the starโ€™s motion, naming it SIM.

Maybe it is the time to progress correctly with the orbital effects
of solar and planetary motion!