Global warming, climate change, all these things are just a dream come true for politicians. I deal with evidence and not with frightening computer models because the seeker after truth does not put his faith in any consensus. The road to the truth is long and hard, but this is the road we must follow. People who describe the unprecedented comfort and ease of modern life as a climate disaster, in my opinion have no idea what a real problem is.
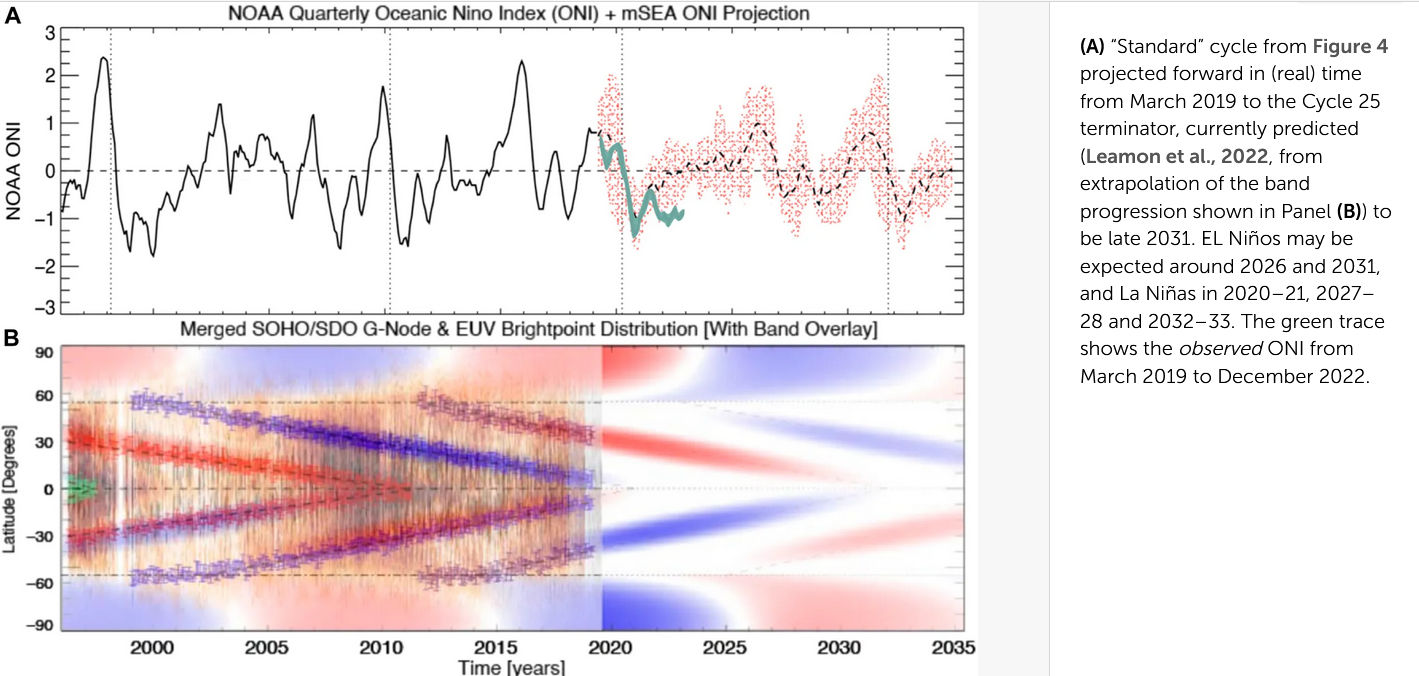
Robert Leamon of NASA and the University of Maryland (Baltimore County) published a 2023 paper predicting that the next El Niño would arrive in 2026. His forecast wasn’t based on ocean models or climate simulations. It was based on the sun.
Specifically, it was based on a solar phenomenon he and colleague Scott McIntosh call the “Terminator”: a magnetic event that marks the end of one solar cycle and the ignition of the next. By averaging the past five solar cycles into a composite “standard cycle” and projecting it forward, Leamon identified a recurring pattern. El Niños tend to follow Terminator events by roughly five years. The most recent Terminator occurred in December 2021. Do the math: that puts the next El Niño squarely in 2026. His model doesn’t speak to the strength of the event, but on timing, it appears to be spot-on.
Adapted by Dr. Tony Philps from Fig. 5 of Leamon (2023), this chart highlights two apparently successful predictions based on the Terminator
This isn’t the first time the Leamon-McIntosh framework has made a successful call. The pair previously demonstrated that every Terminator since the 1960s coincided with a flip from El Niño to La Niña conditions. That framework correctly predicted the onset of the triple-dip La Niña that began in 2020, and it revealed what may be a meaningful physical connection between solar variability and the ENSO (El Niño-Southern Oscillation) cycle.
What’s the mechanism?
That remains an open question, and an honest one. Most researchers working in this space favor “top-down” models, where solar activity modifies the upper atmosphere in ways that eventually propagate down to surface weather. But the specific physical pathway hasn’t been pinned down.
Leamon and McIntosh initially suspected (in their 2021 work) that galactic cosmic rays were the link. Cosmic ray flux varies with the solar cycle and affects atmospheric ionization. But by 2023, Leamon had reconsidered, as the timing didn’t fit well enough, and he now leans toward geomagnetic activity as a more plausible driver.
It’s worth noting that the search for a solar-ENSO connection is not new. Sir Gilbert Walker, who first identified the Southern Oscillation (the “SO” in ENSO) in the early 1900s, explicitly looked for a sunspot connection and came up empty. Researchers throughout the 20th century made similar attempts with similarly inconclusive results.
What’s different here is the Terminator concept itself, a relatively new framework that McIntosh and Leamon began developing about a decade ago. It offers a more precise solar marker than sunspot counts, and it appears to do a better job of both hindcasting solar cycles and anticipating ENSO transitions.
A possible geomagnetic-stratosphere-ENSO chain
The Terminator marks a rapid reorganization of the sun’s magnetic field at solar cycle boundaries. This reconfiguration produces a measurable shift in the solar wind and the interplanetary magnetic field, which in turn modulates Earth’s geomagnetic activity. That’s the entry point.
From there, geomagnetic disturbances are known to affect the distribution of electrical currents in the upper atmosphere. Those currents influence the stratospheric circulation, particularly the polar vortex and the quasi-biennial oscillation (QBO), both of which are established modulators of tropospheric weather patterns.
The tropical Pacific is particularly sensitive to stratospheric forcing because the deep convective systems there, the engines of ENSO, respond to even small changes in the temperature gradient between the equatorial stratosphere and the surrounding atmosphere. A Terminator-driven nudge to the stratospheric circulation could plausibly tip the balance between the trade wind patterns that sustain La Niña and the weakening that triggers El Niño onset.
Why the five-year lag?
This is where it gets interesting. The Terminator doesn’t flip a switch instantly. The post-Terminator solar cycle ramps up gradually, and the cumulative geomagnetic forcing takes time to work its way through the stratosphere and into the ocean-atmosphere coupling of the tropical Pacific. Five years is roughly consistent with the timescales of both stratospheric adjustment and the oceanic heat content buildup that precedes a major El Niño.
Caveats
This is a plausible chain, not a proven one. Each link, from solar magnetic reorganization to geomagnetic activity, to stratospheric circulation, to tropical convection, to ENSO, is individually uncertain, and the compounding of those uncertainties is substantial. The honest position is that this mechanism is testable in principle, which is exactly what makes the Leamon-McIntosh prediction record worth watching closely.
Bottom line
Two successful predictions, the 2020 La Niña onset and now apparently the 2026 El Niño, is not proof of a causal mechanism, but it is more than coincidence deserves to be called. Science advances on exactly this kind of pattern recognition followed by mechanism-hunting. The Terminator hypothesis is young, the mechanism is unknown, and confidence should remain appropriately provisional.
But the prediction was made. It’s on record. And the El Niño appears to be arriving right on schedule.
The climatists have seized on this unusual warming as proof their Zero Carbon agenda is needed, without addressing how impossible it would be for CO2 warming the air to raise ocean temperatures. It is the ocean that warms the air, not the other way around.
The best context for understanding decadal temperature changes comes from the world’s sea surface temperatures (SST), for several reasons:
The ocean covers 71% of the globe and drives average temperatures;
SSTs have a constant water content, (unlike air temperatures), so give a better reading of heat content variations;
Major El Ninos have been the dominant climate feature in recent years.
HadSST is generally regarded as the best of the global SST data sets, and so the temperature story here comes from that source. Previously I used HadSST3 for these reports, but Hadley Centre has made HadSST4 the priority, and v.3 will no longer be updated. HadSST4 is the same as v.3, except that the older data from ship water intake was re-estimated to be generally lower temperatures than shown in v.3. The effect is that v.4 has lower average anomalies for the baseline period 1961-1990, thereby showing higher current anomalies than v.3. This analysis concerns more recent time periods and depends on very similar differentials as those from v.3 despite higher absolute anomaly values in v.4. More on what distinguishes HadSST3 and 4 from other SST products at the end. The user guide for HadSST4 is here.
The Current Context
The chart below shows SST monthly anomalies as reported in HadSST4 starting in 2015 through March 2024. A global cooling pattern is seen clearly in the Tropics since its peak in 2016, joined by NH and SH cycling downward since 2016.
Note that in 2015-2016 the Tropics and SH peaked in between two summer NH spikes. That pattern repeated in 2019-2020 with a lesser Tropics peak and SH bump, but with higher NH spikes. By end of 2020, cooler SSTs in all regions took the Global anomaly well below the mean for this period.
Then in 2022, another strong NH summer spike peaked in August, but this time both the Tropic and SH were countervailing, resulting in only slight Global warming, later receding to the mean. Oct./Nov. temps dropped in NH and the Tropics took the Global anomaly below the average for this period. After an uptick in December, temps in January 2023 dropped everywhere, strongest in NH, with the Global anomaly further below the mean since 2015.
Then came El Nino as shown by the upward spike in the Tropics since January, the anomaly nearly tripling from 0.38C to 1.09C. In September 2023, all regions rose, especially NH up from 0.70C to 1.41C, pulling up the global anomaly to a new high for this period. By December, NH cooled to 1.1C and the Global anomaly down to 0.94C from its peak of 1.10C, despite slight warming in SH and Tropics.
Then in January both Tropics and SH rose, resulting Global Anomaly going higher. Tropics anomaly reached a new peak of 1.29C. and all ocean regions were higher than 01/2016, the previous peak. Now in February and March all regions have cooled bringing the Global anomaly back down 0.18C from its September peak.
Comment:
The climatists have seized on this unusual warming as proof their Zero Carbon agenda is needed, without addressing how impossible it would be for CO2 warming the air to raise ocean temperatures. It is the ocean that warms the air, not the other way around. Recently Steven Koonin had this to say about the phonomenon confirmed in the graph above:
El Nino is a phenomenon in the climate system that happens once every four or five years. Heat builds up in the equatorial Pacific to the west of Indonesia and so on. Then when enough of it builds up it surges across the Pacific and changes the currents and the winds. As it surges toward South America it was discovered and named in the 19th century It is well understood at this point that the phenomenon has nothing to do with CO2.
Now people talk about changes in that phenomena as a result of CO2 but it’s there in the climate system already and when it happens it influences weather all over the world. We feel it when it gets rainier in Southern California for example. So for the last 3 years we have been in the opposite of an El Nino, a La Nina, part of the reason people think the West Coast has been in drought.
It has now shifted in the last months to an El Nino condition that warms the globe and is thought to contribute to this Spike we have seen. But there are other contributions as well. One of the most surprising ones is that back in January of 2022 an enormous underwater volcano went off in Tonga and it put up a lot of water vapor into the upper atmosphere. It increased the upper atmosphere of water vapor by about 10 percent, and that’s a warming effect, and it may be that is contributing to why the spike is so high.
A longer view of SSTs
The graph above is noisy, but the density is needed to see the seasonal patterns in the oceanic fluctuations. Previous posts focused on the rise and fall of the last El Nino starting in 2015. This post adds a longer view, encompassing the significant 1998 El Nino and since. The color schemes are retained for Global, Tropics, NH and SH anomalies. Despite the longer time frame, I have kept the monthly data (rather than yearly averages) because of interesting shifts between January and July. 1995 is a reasonable (ENSO neutral) starting point prior to the first El Nino.
The sharp Tropical rise peaking in 1998 is dominant in the record, starting Jan. ’97 to pull up SSTs uniformly before returning to the same level Jan. ’99. There were strong cool periods before and after the 1998 El Nino event. Then SSTs in all regions returned to the mean in 2001-2.
SSTS fluctuate around the mean until 2007, when another, smaller ENSO event occurs. There is cooling 2007-8, a lower peak warming in 2009-10, following by cooling in 2011-12. Again SSTs are average 2013-14.
Now a different pattern appears. The Tropics cooled sharply to Jan 11, then rise steadily for 4 years to Jan 15, at which point the most recent major El Nino takes off. But this time in contrast to ’97-’99, the Northern Hemisphere produces peaks every summer pulling up the Global average. In fact, these NH peaks appear every July starting in 2003, growing stronger to produce 3 massive highs in 2014, 15 and 16. NH July 2017 was only slightly lower, and a fifth NH peak still lower in Sept. 2018.
The highest summer NH peaks came in 2019 and 2020, only this time the Tropics and SH were offsetting rather adding to the warming. (Note: these are high anomalies on top of the highest absolute temps in the NH.) Since 2014 SH has played a moderating role, offsetting the NH warming pulses. After September 2020 temps dropped off down until February 2021. In 2021-22 there were again summer NH spikes, but in 2022 moderated first by cooling Tropics and SH SSTs, then in October to January 2023 by deeper cooling in NH and Tropics.
Then in 2023 the Tropics flipped from below to well above average, while NH produced a summer peak extending into September higher than any previous year. Despite El Nino driving the Tropics January 2024 anomaly higher than 1998 and 2016 peaks, the last two months cooled in all regions, especially the Tropics, suggesting that the peak likely has been reached.
What to make of all this? The patterns suggest that in addition to El Ninos in the Pacific driving the Tropic SSTs, something else is going on in the NH. The obvious culprit is the North Atlantic, since I have seen this sort of pulsing before. After reading some papers by David Dilley, I confirmed his observation of Atlantic pulses into the Arctic every 8 to 10 years.
Contemporary AMO Observations
Through January 2023 I depended on the Kaplan AMO Index (not smoothed, not detrended) for N. Atlantic observations. But it is no longer being updated, and NOAA says they don’t know its future. So I find that ERSSTv5 AMO dataset has data through October. It differs from Kaplan, which reported average absolute temps measured in N. Atlantic. “ERSST5 AMO follows Trenberth and Shea (2006) proposal to use the NA region EQ-60°N, 0°-80°W and subtract the global rise of SST 60°S-60°N to obtain a measure of the internal variability, arguing that the effect of external forcing on the North Atlantic should be similar to the effect on the other oceans.” So the values represent sst anomaly differences between the N. Atlantic and the Global ocean.
The chart above confirms what Kaplan also showed. As August is the hottest month for the N. Atlantic, its varibility, high and low, drives the annual results for this basin. Note also the peaks in 2010, lows after 2014, and a rise in 2021. Now in 2023 the peak was holding at 1.4C before declining. An annual chart below is informative:
Note the difference between blue/green years, beige/brown, and purple/red years. 2010, 2021, 2022 all peaked strongly in August or September. 1998 and 2007 were mildly warm. 2016 and 2018 were matching or cooler than the global average. 2023 started out slightly warm, then rose steadily to an extraordinary peak in July. August to October were only slightly lower, but by December cooled by ~0.4C. January 2024 was unchanged from the previous month, but February anomaly rose 0.1C and March a little more to reach 1.2C anomaly.
The pattern suggests the ocean may be demonstrating a stairstep pattern like that we have also seen in HadCRUT4.
The purple line is the average anomaly 1980-1996 inclusive, value 0.18. The orange line the average 1980-202306, value 0.38, also for the period 1997-2012. The red line is 2013-202306, value 0.64. As noted above, these rising stages are driven by the combined warming in the Tropics and NH, including both Pacific and Atlantic basins.
The oceans are driving the warming this century. SSTs took a step up with the 1998 El Nino and have stayed there with help from the North Atlantic, and more recently the Pacific northern “Blob.” The ocean surfaces are releasing a lot of energy, warming the air, but eventually will have a cooling effect. The decline after 1937 was rapid by comparison, so one wonders: How long can the oceans keep this up? And is the sun adding forcing to this process?
Space weather impacts the ionosphere in this animation. Credits: NASA/GSFC/CIL/Krystofer Kim
Footnote: Why Rely on HadSST4
HadSST is distinguished from other SST products because HadCRU (Hadley Climatic Research Unit) does not engage in SST interpolation, i.e. infilling estimated anomalies into grid cells lacking sufficient sampling in a given month. From reading the documentation and from queries to Met Office, this is their procedure.
HadSST4 imports data from gridcells containing ocean, excluding land cells. From past records, they have calculated daily and monthly average readings for each grid cell for the period 1961 to 1990. Those temperatures form the baseline from which anomalies are calculated.
In a given month, each gridcell with sufficient sampling is averaged for the month and then the baseline value for that cell and that month is subtracted, resulting in the monthly anomaly for that cell. All cells with monthly anomalies are averaged to produce global, hemispheric and tropical anomalies for the month, based on the cells in those locations. For example, Tropics averages include ocean grid cells lying between latitudes 20N and 20S.
Gridcells lacking sufficient sampling that month are left out of the averaging, and the uncertainty from such missing data is estimated. IMO that is more reasonable than inventing data to infill. And it seems that the Global Drifter Array displayed in the top image is providing more uniform coverage of the oceans than in the past.
USS Pearl Harbor deploys Global Drifter Buoys in Pacific Ocean
The Sun is a variable star and the amount of energy it emits varies from month to month, year to year, and century to century. One of the manifestations of these variations are sunspots, which are more common when the Sun is more active and disappear when it is less active.
The Sun is a variable star and the amount of energy it emits varies from month to month, year to year, and century to century. One of the manifestations of these variations are sunspots, which are more common when the Sun is more active and disappear when it is less active. These spots follow a solar cycle of about 11 years, but sometimes there is a longer period, decades or centuries, when the Sun’s activity is so low that there are no spots. These periods are called grand solar minima. There are also periods of decades or centuries when the activity is higher. These are called grand solar maxima.
The Sun provides 99.9% of the energy that the climate system receives. So, there have always been scientists who thought that variations in the Sun were the cause of climate change. The problem is that they never had enough evidence to prove it. Until now.
The IPCC and NASA say…
The IPCC and NASA are convinced that changes in the Sun have very little effect on climate. They rely on two arguments. The first is that changes in solar activity are very small. We measure them with satellites because they cannot be measured from the surface, and we know that the radiant energy coming from the Sun varies by only 0.1%. The magnitude of the changes is better appreciated when we use the full scale. Many scientists believe that such a small change can only produce small changes in climate.
The second argument is that the evolution of temperature does not coincide with the evolution of solar activity. Since the 1990s, solar activity has decreased while warming has continued.[i]
Actually, this argument is not valid because it does not say that the Sun does not affect temperature, but that it is not the only factor in doing so, something we already knew because temperature responds to many factors such as El Niño, volcanoes, the polar vortex, or changes in the Earth’s orbit. There are many natural causes that change the climate, and what we need to know is whether the Sun is one of the main ones.
To find out, we don’t need to care what the IPCC and NASA think, we need to ask the climate itself. It doesn’t matter how small the changes in the Sun are if it turns out that the climate responds strongly to them by causing big changes.
Climate during the Holocene
And the best way to find out is to look at what has happened to the climate over the last 11,000 years, the interglacial period we call the Holocene. The advantage of doing this is that the Holocene climate changes could not have been caused by changes in CO₂. They must have been caused by something else.
To study the climate of the past, scientists use various climate proxies that they collect in different parts of the world. A major study published in Science used 73 of these proxies to reconstruct Holocene climate.[ii] I have used the same proxies, with a slight modification in the way they are mixed.
What we see, and what a large number of studies also support, is that there was a warm period of thousands of years, called the Climate Optimum, followed by a long period of cooling, called Neoglaciation.
How do we know that this reconstruction is correct? Another study reconstructed the progress of the Earth’s glaciers over the past 11,000 years.[iii] They divided the globe into 17 regions, and this graph shows the number of regions whose glaciers increased in size during each century of the Holocene.
Since glaciers grow when it is colder, we can invert their figure and compare it to the temperature reconstruction graph so that its meaning is the same. We find a high degree of agreement. The glaciers confirm what the temperature reconstruction shows. We also know that CO₂ has done the opposite of temperature, but that is a story for another day.
Note: y-axis is the Z factor, which is related to temperature anomaly.
Both graphs also show some severe cooling episodes that were accompanied by increased glacier growth. These abrupt climate events of the past have been studied and identified by paleoclimatologists. Of all of them, we will focus on four of the most important ones. The Boreal Oscillation, the 5.2 kiloyear event, the 2.8 kiloyear event, and the Little Ice Age.
The four are separated by multiples of 2,500 years and form a cycle that I have called the Bray cycle because that was the name of the scientist who discovered it in 1968.[iv]
Now that we know the climate of the past, we need to talk about the activity of the Sun in the past.
Past solar activity
The Sun’s activity is recorded in the tree rings through the action of cosmic rays. A constant stream of cosmic rays from the galaxy reaches the solar system. Some interact with the atmosphere. Some collide with nitrogen in the atmosphere, converting it to carbon-14, which is heavier than normal carbon-12 and radioactive. This carbon-14 combines with oxygen to form radioactive CO₂, which is breathed by trees. The carbon is used in photosynthesis to make cellulose, which allows the tree trunk to grow in diameter. When the tree dies, the carbon-14 in the wood slowly decays over centuries and millennia. You just have to measure how much carbon-14 is left in the wood to know how much time has passed since the tree died.
Each growth ring of a tree records the carbon-14 that was in the atmosphere that year, and scientists have used millennia-old trees and preserved logs to construct a calibration curve that spans tens of thousands of years. This allows them to determine the age of any organic remains, even if it is not a tree trunk, just by knowing the carbon-14 it contains. This is known as radiocarbon dating.
The only problem is that the production of carbon-14 by cosmic rays is not constant. The Sun’s magnetic field deflects the path of cosmic rays, causing many to miss the Earth, and changes in the Sun’s activity affect its magnetic field.
As the Sun’s activity increases, fewer cosmic rays arrive, less carbon-14 is produced, and organic remains appear older because they contain less of it. When the Sun’s activity becomes weaker, more cosmic rays arrive, more carbon-14 is produced, and the organic remains look younger because they contain more of it.
This produces deviations in the calibration curve that allow us to know what the Sun’s activity was in the past.
Spörer-type solar minima
When we analyze the radiocarbon curve over the last 11,000 years, we observe large deviations that indicate long periods of low solar activity. These extended periods of low solar activity are called grand solar minima and increase carbon-14 production by 2%. The most common ones last about 75 years, and there have been about twenty in the last 11,000 years. The most recent was the Maunder Minimum in the late 17th century. But there are other types of grand solar minima that are much more severe because they last twice as long, about 150 years. The last of these severe solar minima was the Spörer Minimum, which occurred in the 15th and 16th centuries.
There have been only four such Spörer-type grand minima in the entire Holocene. 2,800 years ago, there was the Homer Minimum, 5,200 years ago the Sumerian Minimum, and 10,300 years ago the Boreal Minimum. We know when they occurred thanks to tree rings.
If the dates sound familiar, it is because the four grand Spörer-type Holocene minima coincide exactly with the four major climatic events on the graph we saw earlier. We know that during each of these grand solar minima, when the Sun’s activity dropped for 150 years, the climate experienced a tremendous cooling that had a major effect on climate proxies around the globe.
We also know that low solar activity during the grand minima has had a major impact on human populations. Past human settlements and their component structures can be radiocarbon dated. When humans were doing well in the past, the population grew and they built more, and when they were doing poorly, usually because there was less food, the population decreased and they built less. Scientists have estimated the evolution of the human population of the British Isles by analyzing the radiocarbon dates of thousands and thousands of remains from hundreds of archaeological excavations.[v]
What they have found is that the population increased greatly with the advent of agriculture, but every time there was a severe deterioration in the climate, the human population suffered from diminishing resources. And the largest declines occurred when grand Spörer-type solar minima took place. Other population declines also coincide with other cooling periods, confirming our reconstruction.
This tells us that the worst climate changes in the past have been caused by changes in solar activity. It also tells us that what is bad for humanity is cooling, not warming.
Now we can respond to the IPCC and NASA. Never mind that solar irradiance changes very little, and never mind that temperature does not always do the same thing as solar activity. Clearly there are other factors at play. But we can state emphatically that changes in solar activity affect the climate because that is what the climate says. The study of past climate leaves no room for doubt. The Sun changes the climate. And if we don’t know how it does it, we should study it.
The 20th century solar maximum
Since low solar activity causes cooling, it stands to reason that high activity must cause warming. Solar activity in the 20th century was very high, in the top 10% of the last 11,000 years.
If we count the number of sunspots in each solar cycle over the last 300 years and divide by the length of each cycle, we can see how much solar activity has deviated from the average. Since the Maunder Minimum, during the Little Ice Age, solar activity has been increasing and was well above average between 1933 and 1996, a period of six cycles of increased solar activity that formed the 20th century solar maximum.
Although we cannot know how much of the 20th century warming is due to this modern solar maximum, there is no denying that it is a significant part, because as we have seen, the Sun has been the cause of much of the major climate change over the past 11,000 years.
Conclusions
There are two pieces of good news. The first is that solar activity cannot rise above the 20th century maximum. It is not like CO₂, which can keep going up. The Sun’s activity can stay high or go down, but it cannot go up, so the warming should not accelerate and should not be dangerous.
In 2016, I developed a model to predict solar activity in the 21st century. At the time, some scientists believed that solar activity would continue to decline until a new grand solar minimum and mini-ice age. But my model predicts that solar activity in the 21st century will be similar to that of the 20th century. It also predicted that the current solar cycle, the 25th, would have more activity than the previous one, and it was right.
The second piece of good news is that if much of the 20th century warming is due to the Sun, then there is no climate emergency. Believing that all climate change is due to our emissions is one of those errors that sometimes occur in science, like believing that the Earth is the center of the solar system, that interplanetary space is full of ether, or that stomach ulcers are caused by stress, not bacteria.
How about the weather on the other planets in our solar system? Might it be influenced by galactic cosmic rays just like here on Earth? The clouds of Neptune captured by the Hubble Space Telescope were obtained over nearly 30 years over which is plotted the solar UV radiation during the solar cycle.
From Andy May (2024): “Roger Pielke Jr. posted this plot (below) of the 3-year frequency of global major hurricanes (he uses a simple count of them) created by Ryan Maue (@RyanMaue). Dr. Maue also posted this plot on his twitter. Looks like an inverse sunspot plot and overlaid the SILSO monthly sunspot count. In the figure, the blue is Maue’s plot, and the orange is a plot of monthly SILSO sunspots. The correlation, or strictly speaking, the anti-correlation is obvious and very interesting. I don’t think Ryan Maue’s plot has been formally published yet.”
Here is my speculation:
It appears that some extreme weather here on Earth might be influenced by changes in solar activity. If the Svensmark cloud hypothesis is correct, increased solar activity deflects more Cosmic Rays (CR) away from the inner solar system producing less ionization in the troposphere, producing fewer clouds with more solar radiation reaching the oceans. Warming oceans leads to a greater temperature differential between the poles and the equator which promotes more hurricane activity. The oceans have a significant thermal lag – it takes time to heat and cool this huge mass of water so we see a time lag of about 3 years after solar maximum until the hurricane frequency reaches its maximum. As we approach solar minimum more CR ionization occurs producing more clouds and a cooling ocean. The pole/equator temperature differential then, begins to decline with hurricane frequency also decreasing.
How about the weather on the other planets in our solar system? Might it be influenced by galactic cosmic rays just like here on Earth? The clouds of Neptune captured by the Hubble Space Telescope were obtained over nearly 30 years over which is plotted the solar UV radiation during the solar cycle. We see maximum cloudiness at solar maximum. Just the opposite of the Svensmark hypothesis, which says maximum cloudiness should occur at solar minimum where CR intensity is maximum. Seems a paradox here.
This sequence of Hubble Space Telescope images chronicles the waxing and waning of cloud cover on Neptune. This nearly-30-year-long set of observations shows that the number of clouds grows increasingly following a peak in the solar cycle – where the Sun’s level of activity rhythmically rises and falls over an 11-year period. The Sun’s level of ultraviolet radiation is plotted in the vertical axis. The 11-year cycle is plotted along the bottom from 1994 to 2022. The Hubble observations along the top, clearly show a correlation between cloud abundance and solar peak of activity. One theory says that the increased ultraviolet radiation from the Sun, during its peak of activity, causes chemical changes deep in Neptune’s atmosphere. After a couple years this eventually percolates into the upper atmosphere to form clouds.
NASA, ESA, LASP, Erandi Chavez (UC Berkeley), Imke de Pater (UC Berkeley)
Neptune’s atmosphere is made up mostly of hydrogen and helium with a bit of methane. The clouds are primarily composed of ammonia and methane. Temperatures are cold, around -170 C. Green and blue areas are where the red light from the sun is absorbed by methane. The planet has hundreds of times more methane, ethane and acetylene at the equator than at the poles. Ammonia ice, water ice, ammonia hydrosulfide, and methane ice are also present.
Just above Neptune’s rocky surface lies the troposphere. As altitude increases, temperature in the troposphere decreases. But in the next layer, the stratosphere, temperatures increase with altitude. This is related to the motion inside of the planet’s core, which heats Neptune more than the rays from the distant sun. The next layer is the thermosphere, where pressures are lower. The very outer edge of the atmosphere is known as the exosphere.
The clouds of Neptune vary with the altitude. Cold temperatures allow methane clouds to condense in the highest layers of the troposphere. Farther down where pressures are higher, clouds of hydrogen sulfide, ammonium sulfide, ammonia, and water could exist. Clouds of water-ice may be found at pressures of 50 bars, with clouds of hydrogen sulfide and ammonia beneath them.
Neptune also contains a couple of haze layers at very high altitudes of the troposphere and the stratosphere. These smog-like clouds are made up of hydrocarbons. Much like smog over major cities on Earth, the face of Jupiter has an umber tone which waxes and wanes. The lower stratosphere of Neptune is foggy because of the condensation of hydrocarbons such as acetylene and ethane. The thermosphere of Neptune is very high and hot. The temperature is around 750 K. Scientists haven’t figured out how this heat gets generated as Neptune is very far from the Sun and hard to observe in detail.
If Svensmark’s cloud hypothesis works on Earth it should work on Neptune. Here we see a reverse phase, where minimum cloudiness occurs at solar minimum. This concurrence brings maximum cosmic radiation which should promote more clouds not less. Something else might be going on here.
” High-energy galactic cosmic rays (CR)can penetrate to deep levels within Neptune’s atmosphere to form a substantial ionospheric layer in the lower stratosphere and upper troposphere of the planet. Because cosmic ray modulation in the interplanetary medium creates an inverse relationship between cosmic-ray intensity and solar activity, the ionization rate in the lower atmosphere will vary with the 11-year solar cycle in such a way that maximum ionization will occur at sunspot minimum and minimum ionization at sunspot maximum. This variable ionization may, by the process of ion-induced nucleation, regulate the formation and optical properties of an upper tropospheric haze in the atmosphere of Neptune and could thus provide a mechanism for modulating the planet’s visual brightness over a solar cycle.”
Both clouds and haze may be formed by a UV photochemical reaction, cosmic ray-initiated reactions or both. As the sun gets more active and builds up to its maximum, it begins to emit more powerful and intense ultraviolet (UV) light. It has been found that around two years after this UV emission begins, Neptune’s clouds begin to appear, indicating that this UV is perhaps responsible for cloud formation. The cloud-forming aerosols created by cosmic ray interactions are formed further down in the troposphere and may be slowly transported to higher altitudes within the atmosphere.
Question: During solar maximum, is solar UV light the primary catalyst for cloud condensation and responsible for the progress of the observed cloud modulation? Svensmark says that the cosmic radiation intensity at solar maximum is at the minimum thus producing less tropospheric aerosols and haze. At solar maximum we observe solar UV is at the maximum but assume centrality of CR in the creation of tropospheric haze which would then be significantly reduced. This would lead to increasing upper troposphere transparency revealing the clouds that had been there the whole time. It is not the clouds that are changing it is the modulation of the haze opacity by cosmic rays.
UV and CR exposure of the upper troposphere and stratosphere of Neptune ionizes methane which undergoes chemical reactions creating aerosols of complex hydrocarbons. These aerosols can form a complex network of obscuring haze. These aerosols can also act as cloud condensation nuclei which facilitate cloud formation. During high CR periods during the solar cycle (solar minimum) aerosol formation increases as the UV contribution decreases. During low CR periods (solar maximum) aerosol formation decreases while the UV contribution increases. White methane clouds predominate during solar maximum and disappear during solar minimum. If the haze is reduced during solar maximum the clouds would be revealed. The decreased CR during solar maximum generates significantly less aerosols in the troposphere decreasing the haze formation there. Cosmic Rays seem to be the primary driver of cloud and haze forming aerosols in the troposphere of Neptune.
Cosmic radiation induced ionization is the main mechanism for ionizing the lower atmosphere of Neptune. Their higher penetration power, in comparison with solar UV photons, allows cosmic rays to penetrate deep into the atmosphere, ionizing the neutral molecules and generating an ionosphere similar in magnitude to the ionosphere produced by solar radiation in the upper atmosphere. UV will be absorbed by the haze layers as it passes through the atmosphere, whereas highly energetic secondary cosmic rays, typically muons of several GeV, can readily penetrate the deep Neptunian troposphere.
Notes:
(above) Global-average temperature–pressure profile of the atmospheres of Uranus and Neptune, with major regions of the atmosphere labelled (modified from Moses et al. Thermochemical equilibrium prediction of the upper-tropospheric cloud structure on Uranus (modified from Hueso & Sánchez-Lavega. The predicted mass mixing ratios of condensable gases are shown as colored solid lines, and the maximum cloud density as solid black lines with color-shaded regions.
Religious cults promise a wonderful future if only people would believe. The promise the global warming cult made is that we would see the end of snow, no doubt about it. It seems that not enough people believe and that earthly paradise is yet to come.
Religious cults promise a wonderful future if only people would believe. The promise the global warming cult made is that we would see the end of snow, no doubt about it. It seems that not enough people believe and that earthly paradise is yet to come. In the meantime, it is energy from the Sun that stops the Earth from looking like Pluto so we should keep an eye on what the Sun is up to, at least out of respect. Let’s start from the solar interior and work outward to the lower atmosphere.
Figure 1: Ap Index 1932 – 2024
The change in character of the Ap Index from the Modern Warm Period continues. Average activity is lower but the big change is the amplitude. This geomagnetic index would have its origin the Sun’s tachocline.
Figure 2: aa Index 1868 – 2024
The aa Index has dropped to the level of the last 65 years of the Little Ice Age.
Figure 3: Cumulative aa Index 1868 – 2024
This is a methodology that captures the long terms changes in trend. Now 18 years into the New Cold Period, it looks like a major trend has been established. With almost the same average level of the last 65 years of the Little Ice Age, the steepness of the downtrend is almost the same.
Figure 4: Interplanetary Magnetic Field 1966 – 2024
In this series Solar Cycle 25 has been appreciably more active than Solar Cycle 24. The 1970s cooling period of Solar Cycle 20 shows up as a period of small swings in activity.
Figure 5: F10.7 Flux 2008 – 2024
Whereas the aa and Ap indices have a lower amplitude of activity in the current solar cycle relative to 24, the F10.7 flux has been stronger, sooner than in 24.
Figure 6: Hemispheric Sunspot Number 1940 – 2023
Energy is conserved within a solar hemisphere from one solar cycle to the next, unless it is destroyed by a retrograde movement. The north and south hemisphere have different trends of activity which suggests that this is controlled by planets crossing the plane of the solar system.
Figure 7: Solar Wind Proton Density
This figure is from Nasa’s Omniweb page. It is included because it is one of a number of solar parameters that now show a clear break in their level of activity between the Modern Warm Period and the New Cold Period.
Figure 8: Oulu Neutron Count 1964 – 2024
Finally, this is where the rubber meets the road in terms of solar control of climate. The Sun’s magnetic field, carried on the solar wind, pushes galactic cosmic rays away from the inner planets of the solar system. This effect is strongest at solar maximum.
While they are called rays, they are particles – mostly protons and alpha particles. Upon hitting oxygen and nitrogen atoms in the upper atmosphere, a cascade of particles is created which is largely neutrons by the time they reach the lower atmosphere. A high proportion of the atmosphere is saturated with water but lacks nucleation sites for cloud droplet formation. The neutron tracks provide nucleation sites and there is a correlation between low solar activity, neutron flux and cloud cover. Clouds are more reflective than open ocean or land and so the Earth cools. Note the period of high neutron count associated with the 1970s Cooling Period.
Sunlight penetrates deeply (up to 1,000 meters) into the ocean before it is absorbed. Greenhouse gas radiation cannot penetrate the ocean surface. The residence time of sunlight energy is longer as a result. This magnifies solar changes since Watt-for-Watt changes in sunlight matter more than changes in greenhouse gases.
Yesterday, Roger Pielke Jr. posted a plot of the 3-year frequency of global major hurricanes (he uses a simple count of them) created by Ryan Maue (@RyanMaue). Dr. Maue also posted this plot on his twitter feed here. I noticed it looked like an inverse sunspot plot and overlaid the SILSO monthly sunspot count. In the figure, the blue is Maue’s plot, and the orange is a plot of monthly SILSO sunspots. The correlation, or strictly speaking, the anti-correlation is obvious and very interesting. I don’t think Ryan Maue’s plot has been formally published yet.
It appears that some extreme weather is influenced by changes in solar activity.
Figure 1. The blue line is Ryan Maue’s 3-year cumulative count of major global hurricanes. The orange line is the simple monthly sunspot count from SILSO.
OK, I’ll speculate. Sunlight penetrates deeply (up to 1,000 meters) into the ocean before it is absorbed. Greenhouse gas radiation cannot penetrate the ocean surface. The residence time of sunlight energy is longer as a result. This magnifies solar changes since Watt-for-Watt changes in sunlight matter more than changes in greenhouse gases.
Storms are a function of temperature differences, when an imbalance (increase in energy storage) happens in the tropics at the top of the solar cycle, the temperature difference between the tropics and the mid-latitudes increases. This causes storminess and hurricanes to increase, the increase doesn’t stop until the next solar minimum. Solar peaks appear to initiate an increase in storminess. Just a guess, take it for what it’s worth.
The science about climate change is settled, right? We’re reassured by the media again and again that there is almost complete unanimity when it comes to the question of whether changes in the climate are caused by humans. And we’re also told there’s so much consensus that anyone who says otherwise isn’t a real scientist, but a “climate change skeptic” just trying to muddy the pristine waters of settled science. In this episode of America Uncovered, we look at the sun’s role in global warming, why so many human-caused-climate-change proponents don’t want to look at this data, and how they’re trying to discredit climate scientists who are looking at factors that question the human-caused climate-change narrative.
Transcript
For those who prefer to read, the Transcript is below in italics with my bolds and added images.
The UN and prominent scientific organizations say the science is settled. No one can dispute that climate change is mainly caused by humans. Those who question it are insulted and shunned. Which is exactly the way the scientific method is supposed to work.
Welcome to America Uncovered. I’m Chris Chappell. Everywhere you look these days, it seems there’s someone pushing “the narrative.” America is irredeemably racist . Christopher Columbus was evil. Pineapple on pizza is gross . Wrong! Its sweet tanginess is a great counterbalance to the salt and acidity of the sauce. Refine your palates, you swine.
Journalists push narratives all the time, but so do scientists. Now, there’s this naive notion that scientists are above pushing narratives, because all they do is look at provable facts. But that couldn’t be further from the truth, especially for complex topics where the facts aren’t always so clear cut.
Look no further than the climate change debate. The most influential scientific organizations make it sound like it is a fact supported almost unanimously by the scientific community that climate change is mostly man-made. Which should immediately make you start questioning things, since no community unanimously believes anything. If they did, then 10 out of 10 dentists would recommend Crest toothpaste .
Just look at how the UN presents the topic. According to the UN’s Intergovernmental Panel on Climate Change (IPCC) 2023 report, “Human activities are responsible for global warming” by increasing greenhouse gasses. “It is unequivocal that human influence has warmed the atmosphere, ocean and land.” In other words, don’t question it! You *have* to accept that humans are the driving factor for climate change. There’s not supposed to be debate in science. That’s why we still believe the Earth is the center of the universe and everything revolves around it. That science was settled centuries ago!
This type of messaging has had a profound impact on public policy all over the world. Billions of dollars have gone into addressing climate change and studying its effects. The narrative about man-made climate change is so loud and pervasive that CNN can ask, “why are we still debating climate change?” and reasonably expect readers to say, “yeah!”
In reality, though, it’s a lot more complicated than that. I’ve debunked the “97% of scientists agree on man-made climate change” narrative in a previous episode. The reality is, there’s no consensus on how large of a role human activity plays in climate change or even how climate is changing.
How they invented the “97% of scientists agree” meme.
Now, I’ve said this before, and I’ll say it again—I’m not a conspiracy theorist, and I’m not taking sides on the climate change debate either. I’m not necessarily dismissing the idea that mankind is driving climate change, but I’m not going to say that everything’s settled, because it’s not.
Uh oh, I just said something nuanced. You know what that means: Goodbye, YouTube ad revenue. And that is exactly the problem! It’s not very popular to question the climate change narrative, especially when billions of dollars are on the line. But there are some scientists who question the narrative anyway. One of the most prominent voices is Wei-Hock—or Willie—Soon , a Malaysian Astrophysicist and aerospace engineer who used to work at the Harvard–Smithsonian Center for Astrophysics.
Soon is known for promoting the hypothesis that the sun may have more to do with current climate change than human activity. He’s not necessarily saying that there’s no such thing as man-made climate change, but he is very vocal about how the UN reportedly suppresses the sun’s role in climate change. I should have known the sun was diabolical. After all, it kills me every time I play Super Mario 3.
Over the years, Soon’s research has been attacked by other scientists and the mainstream media. Carbon Brief released an explainer pushing back against the idea that the sun is responsible for recent climate change. Slate said that “[Soon’s] science has been refuted.” Because “The science is in, it’s extremely clear, and the consensus among climate scientists is solid.” 10 out of 10 scientists agree!
The Union of Concerned Scientists, the Imperial College London, the World Meteorological Organization, and a whole bunch more organizations all say the same thing. NASA is especially adamant about shutting down the sun theory. In its explainer, NASA says, “The Sun can influence Earth’s climate, but it isn’t responsible for the warming trend we’ve seen over recent decades.”
Okay, but what about when it chases you through the desert levels? Explain that, science! NASA and other scientific organizations argue that there isn’t any increase in solar energy reaching the planet. “So, there is a line, and the scientific community is well in agreement. According to NASA, scientists agree that the solar cycle is not driving the changes in Earth’s climate that we’re currently seeing. If we saw solar radiation increasing for a long period of time, we could see those effects on our climate, but the changes between solar cycles are pretty small and not able to drive the drastic changes we’ve seen over the last few decades.”
Plus, if there were so many solar rays, then how come we don’t have a real life Fantastic Four, hm? Science. Settled. Keep an eye on NASA. There’s a reason why NASA in particular is vocal in debunking the sun theory, which I’ll get into later in this episode.
Now, that’s how science works. One scientist puts out research, and other scientists challenge the results. But apparently, refuting Soon’s science wasn’t enough. The scientific community and the mainstream media went after Soon personally, and not always in the most honest of ways.
Scientists and the mainstream media have attacked Soon’s research on the sun’s role in climate change, but they’ve also attacked Soon, and it can be a bit disingenuous. For example, since 2011, the environmentalist nonprofit Greenpeace has pushed the idea that Soon’s research was funded by the fossil-fuel industry and suggested that Soon improperly concealed his funding sources in one of his publications.
But that’s misleading. According to The Heartland Institute, “As a working scientist… Soon had no authority to sign a research contract to receive a grant, let alone to decide and dictate the terms of such contracts.” Who did have the authority? Soon’s employer. “Dr. Soon and other working scientists like him are paid by the Smithsonian, not by the external funder, to carry out those duties. Simply put, Dr. Soon is employed by the Smithsonian to conduct research paid for by external grants obtained by the Smithsonian.” So, if true, it would have been the Smithsonian that accepted money from the fossil-fuel industry.
Meanwhile, The Union of Concerned Scientists suggests that Soon’s work was part of a broader pattern of deception by fossil fuel companies. And as for the mainstream media? Well, they have disdainfully called Soon a climate skeptic. The problem is, Soon isn’t the only scientist asking questions. In 2021, Soon, along with almost 2 dozen other scientists from all over the world, published a study on the Institute of Physics Publishing asking, “How much has the Sun influenced Northern Hemisphere temperature trends?” They called it “an ongoing debate.”
It’s a pretty dense read. But to summarize, the study points to solar radiation on the Earth’s atmosphere as the driver of global warming and cites dozens of other studies that point to the sun—not human activity—as the primary driver of climate change. The study also argues that the way the UN’s Intergovernmental Panel on Climate Change concluded that climate change was man-made was flawed. It ignored data, such as NASA’s sun-monitoring satellite data, which the authors argued would’ve countered the man-made climate change narrative.
According to the lead study author, Ronan Connolly , “Depending on which published data and studies you use, you can show that all of the warming is caused by the sun, but the IPCC uses a different data set to come up with the opposite conclusion.” Climate is seriously complex, and there’s a lot of data to consider, so this could just be a mistake, but Connolly doesn’t seem to think so. “In their insistence on forcing a so-called scientific consensus, the IPCC seems to have decided to consider only those data sets and studies that support their chosen narrative.”
This didn’t sit well with most climate change scientists. One 2022 study tried to debunk the sun theory as “erroneous”. Those authors pretty much argued it was a waste of time that could be better used on areas of “legitimate scientific uncertainty”. However, Soon and various other scientists came out with three new studies earlier this year that say otherwise.
This one looked at datasets that the UN didn’t look into to conclude that the UN underestimated the sun’s role in global warming. This included data from NASA’s satellites. Which is a pretty big flex, using data from an organization that doesn’t agree with you to prove your point. Their study also argues that the UN underestimated how weather stations are impacted by urbanization, which generates heat from human activity.
It’s similar to the conclusions made by this study, which specifically addressed the 2022 study that criticized the sun theory. This other study specifically compared Japan and the US to show the impact that urbanization has on weather station data collection. So they’re essentially saying that the way they collect data was flawed, and so were their conclusions.
Now, the studies aren’t completely dismissing the idea that climate change is man-made. They’re simply saying that there isn’t enough data to determine whether global warming is mostly man-made, mostly natural, or a combination of both. Which is why Willie Soon is one of thousands of scientists who have signed the World Climate Declaration, which says that there is no climate emergency…and that “natural as well as anthropogenic factors cause warming.”
One of the scientists involved in the research said the analysis “opens the door to a proper scientific investigation into the causes of climate change.” But it turns out certain scientists are absolutely livid about these studies. They want to slam that door shut , barricade it, and put up a “get off my lawn” sign.”
Some scientists are angry about the multiple studies done by Soon and his colleagues regarding the sun’s role in climate change, and they’re making their displeasure known. But the way these scientists speak to other scientists makes them sound like fourth-grade bullies rather than professional researchers.
For example, Atmospheric science professor Michael Mann of Pennsylvania State University —The guy famous for what’s called the hockey stick graph—Referred to the authors of one of the studies as “a group of climate denier [clowns]”. Which is ridiculous, because clowns aren’t climate deniers. They’re better than anyone at reducing emissions by carpooling with 30 of them in a single vehicle .
Mann also apparently sees anyone whom he classifies as a climate denier of being “truly awful human beings”. I don’t remember the part of the scientific method where you call names on anyone who questions you. Oh wait, there it is. Many climate scientists are quick to dismiss studies that don’t align with the climate change narrative.
For example, Gareth Jones of the UK’s Meteorologist Office called a review that disagreed with him “nonsense.” Jones also seems to enjoy smearing people like the editor of the journal Climate, saying that he “has a bit of a reputation, so much so that other climate contrarians distance themselves from him”.
Then there’s Gavin Schmidt, the director of the NASA Goddard Institute for Space Studies. He mocked one of the authors, calling his work “BS” . Schmidt also said, “The only point of this paper (which every climate denier and their dog has jumped onto), is to launder dirty ‘science’ into a clean made-for-Fox meme.”
Dirty science? Is that like Weird Science if it was rated R instead of PG-13? Schmidt is even using a Freedom of Information Act request to demand one of the editor’s emails with relevant scientists. This seems a lot like intimidation to try to coerce uniformity in the scientific community, rather than allowing for disagreement to try to get to the facts.
Climatologist Judith Curry at Georgia Institute of Technology told The Epoch Times that “The response by Schmidt, Mann, and others, particularly with regard to the FOIA request regarding editorial discussions on this paper, reflects their ongoing attempts to control the scientific as well as public dialogue on climate change”.
If you ask me, this also reflects just how arrogant people in the scientific community have become.
For example, the UN’s under-secretary-general for global communications last year had the audacity to say that the UN “owns” the science. She even admitted that the UN was working with Google to manipulate search results! “We partnered with Google for example. If you Google climate change, at the top of your search, you will get all kinds of UN resources. We started this partnership when we were shocked to see that when we googled climate change we were getting incredibly distorted information right at the top. So we’re becoming much more proactive, you know. We own the science, and we think that the world, you know, should know it.”
“Own the science”? How arrogant do you have to be to believe that you “own” science? What, are they gonna have a garage sale and try to get people to buy the theory of gravity from them, since they “own” it? It’s this kind of “ownership” that allows for organizations like the UN to pre-emptively silence dissent with very little regard for both free speech or even science itself.
You’d be very, very mistaken if you believe that scientists are above politics and bias or that they should not be questioned. Let’s not forget that politicians and scientists said that there was zero evidence Covid came from a lab leaks…and that lockdowns were the best way to deal with the pandemic, despite warnings to the contrary.
The people pushing those narratives thought that they couldn’t possibly be wrong, but in hindsight, they look pretty foolish. Trying to coerce people to a consensus of what you think is the science, isn’t real science. Real science would acknowledge that scientists don’t always have all the data and examine different approaches with professionalism.
Of course there are going to be people who believe in disinformation. But what’s to stop organizations as powerful as the UN from spreading their own disinformation? If we have scientists who are trying to spin facts that favor corporate interests in fossil fuels, tobacco, and fast food, then don’t you think the same could happen for the interests of climate change activists?
People will spread disinformation about anything. Even things that are obviously false, like Pineapple on pizza being anything less than amazing. Like climate change scientists, YouTube loves restricting debate and discussions about things it finds too controversial, such as climate change.
Since the Solar Cycle was discovered over 180 years ago, its progression has been monitored by counting the number of sunspots and sunspot groups visible (through a solar telescope) on the solar surface each day. Solar cycle 25 is the current solar cycle, the 25th since 1755, when extensive recording of solar sunspot activity began.
Oct. 25, 2023 (Spaceweather.com): When Solar Cycle 25 began in 2020, leading forecasters thought it would be weak and slow to develop. Fast forward three years: NOAA is now predicting a quicker, stronger solar cycle. The revised forecast, published yesterday, shows Solar Max coming sometime between January and October 2024:
NOAA’s original prediction for Solar Cycle 25 is shown in pink (), the broad band indicating the uncertainty of the forecast. It has become clear in recent years that the original prediction was too low, which prompted NOAA to issue a new one. The magenta line () traces the new forecast, and takes into account recent high sunspot counts.
Uncertainties in the new forecast are bounded by different shades of magenta. There is roughly a 25% chance that the smoothed sunspot number will fall within the dark-shaded region; a 50% chance it will fall in the medium-shaded region; and a 75% chance it will fall in the lightest of the shaded regions.
If this new forecast is correct, Solar Cycle 25 could land in the ballpark of Solar Cycle 23, which peaked in 2000-2001, and produced the famous Halloween Storms of 2003. However, the odds still favor Solar Cycle 25 being a bit weaker than Solar Cycle 23. Either way, next year’s Solar Max could be potent.
NOAA plans to update this new forecast every month. Check out their Space Weather Prediction Testbed for the latest prediction.
The presence of grand minima, characterized by significantly reduced solar and stellar activity, brings a challenge to the understanding of solar and stellar dynamo. The Maunder Minimum (1645–1715 AD) is a representative grand solar minimum. The cyclic variation of solar activity, especially the cycle length during this period, is critical to understand the solar dynamo but remains unknown.
The sun’s solar cycles were once around three years shorter than they are today, a new analysis of centuries-old Korean chronicles reveals. This previously unknown anomaly occurred during a mysterious solar epoch known as the “Maunder Minimum,” more than 300 years ago, LiveScience has the story.
The sun is constantly in a state of flux. Our home star cycles through periods of increased activity, known as solar maximum, when solar storms become more frequent and powerful, as well as spells of reduced activity, known as solar minimum, when solar storms almost completely disappear.
It currently takes about 11 years for the sun to complete a solar cycle, from minimum to maximum and back again. Scientists can track the sun’s progress through a solar cycle by counting the number of sunspots on the star’s surface, which appear more frequently in the lead-up to and during solar maximum.
But just as the sun fluctuates within individual cycles, historical sunspot records show that over longer periods, spanning decades or centuries, the overall output of solar cycles can also rise and fall.
The Maunder Minimum, sometimes referred to as the Grand Solar Minimum, was a period of greatly reduced solar activity between 1645 and 1715 when sunspots “effectively disappeared,” Scott McIntosh, a solar physicist at the National Center for Atmospheric Research in Colorado who was not involved in the recent research, told Live Science in an email.
A comparison of the sun during solar maximum (left) and solar minimum (right). (Image credit: NASA/Solar Dynamics Observatory)
During this time, the sun’s output was so low that average global temperatures also dropped, in what scientists have dubbed a “mini ice age,” according to NASA — though it was also likely linked to high levels of volcanic eruptions at the time.
Sunspot records paint a general picture of the Maunder Minimum, which is named after the English astronomer Edward Walter Maunder. But there is still much about the period that scientists don’t know.
In the new study, published Oct. 3 in the journal AGU Advances, researchers analyzed historic auroral records from Korea and found that solar cycles during the Maunder Minimum were only eight years long on average — three years shorter than modern cycles.
This graph shows how solar activity (measured by estimated solar irradiance) dropped off during the Maunder Minimum. (Image credit: NASA/University of Colorado’/LASP Interactive Solar Irradiance Datacenter)
The aurora records were part of three separate books, or chronicles, written on behalf of Korean kings that contained detailed daily reports of royal business, state affairs, weather and astronomical phenomena that occurred within the Korean peninsula between 918 and 1910, according to the 2021 study that first described them.
The astronomical sections of the chronicles frequently speak of “red vapors” or “vapors like firelight.” The researchers believe these descriptions refer to the West Pacific Anomaly (WPA) — an area above Korea that produces regular red auroras despite being far from the magnetic poles. Like other auroras, the WPA occurs when solar radiation collides with Earth’s magnetic shield. But unlike other auroras at the time, these lightshows persisted despite a decrease in solar activity because the Earth’s magnetic field is thinner in this region, which makes them a great proxy for solar cycle progression, the researchers wrote.
A diagram of Earth showing the location of the West Pacific Anomaly (WPA). (Image credit: Yan et al. 2023)
The dates when these auroras occurred show that solar radiation from the sun followed an eight-year cycle.
Scientists don’t know what causes long-term solar cycle trends like the Maunder Minimum, McIntosh said. There are “many things” that could influence solar activity over such long periods, he added. It is also unclear why the solar cycles shortened during that time. But the new findings could provide “pivotal clues” in understanding this mysterious epoch in greater detail, researchers wrote in the paper.
Over the last few solar cycles, solar activity has decreased slightly, and there have been some slight fluctuations in cycle length. This led some experts to predict that we were entering a new epoch of reduced solar activity.
The latest of many heat records broken this year is putting the world on course for its hottest year ever, and is a sign of what is to come in future, according to scientists.
Last month was not only the hottest September on record, new data has confirmed, but it was higher by a margin described by stunned scientists as “extraordinary”, “huge” and “whopping”.
I’ll ignore the ignorance of journalists who think that the world started in the 19thC, during the Little Ice Age. And the fact that a “global average temperature” is a meaningless construct, which assumes you can average completely different things.
According to satellite data, the temperature anomaly last month was 0.24C higher than the previous peak in 2016:
The idea that GHGs can make such a difference in such a short period of time is utterly absurd. But the Sky report does give us a clue:
Piers Forster – the interim chair of the government’s Climate Change Committee but speaking in his capacity as climate change professor at Leeds University – said variations between months each year are usually quite small.
“Therefore, breaking the previous September record by a whopping 0.5C is crazy and shows something really bizarre is going on in the oceans,” he said.
Greenhouse gases have been warming not just the atmosphere but also the deep ocean, especially in the Atlantic, added Prof Forster, and now a change in ocean circulation is “causing some of that heat from the deeper ocean to resurface and bite us”.
Forster is quite wrong, knowingly I suspect, because it is physically impossible for GHGs to warm the deep ocean. This is because infrared radiation can only penetrate the top few millimeters of the sea.
However, oceans are an enormous heat store, and a change in ocean circulation, as implied by Forster, can have large effects on atmospheric temperatures.
After all, swings from La Nina to El Nino can often increase global temperatures by a full degree, and that is just a result of ocean circulation is a small part of the Pacific.
And that heat is supplied by the sun, not carbon dioxide.
Why then is there no scientific research going on into what is happening in the oceans and why? Is it more convenient just to blame climate change?
There has also been absolutely no mention in any of these reports of the underwater Hunga Tonga volcano, which erupted in January last year, blasting an enormous plume of water vapor into Earth’s stratosphere.
Water vapour, as we know, is by far the most powerful GHG, responsible for about half of the Earth’s greenhouse effect. The eruption was so powerful that the plume reached the stratosphere, where it can only very slowly return to the Earth’s surface, unlike water vapour in the troposphere.
For the months after the eruption this greenhouse effect was countered by the cooling effect of the ash and aerosols sent aloft. Now that this effect has receded, we are seeing the full greenhouse effect of the plume.
One study last year found that:
This extra water vapor could influence atmospheric chemistry, boosting certain chemical reactions that could temporarily worsen depletion of the ozone layer. It could also influence surface temperatures. Massive volcanic eruptions like Krakatoa and Mount Pinatubo typically cool Earth’s surface by ejecting gases, dust, and ash that reflect sunlight back into space. In contrast, the Tonga volcano didn’t inject large amounts of aerosols into the stratosphere, and the huge amounts of water vapor from the eruption may have a small, temporary warming effect, since water vapor traps heat. The effect would dissipate when the extra water vapor cycles out of the stratosphere and would not be enough to noticeably exacerbate climate change effects.
They calculated that the radiative forcing from this plume of water vapour was about two thirds of the CO2 growth between 1996 and 2005.
How much of the recent spike in temperatures is due to Hunga Tonga is debatable.
But what I find remarkable about this, if unsurprising, is how there has been virtually no public discussion of this, or serious scientific research into it. Instead climate scientists seem to want to brush it under the carpet, and blame rising temperatures on “climate change”.


 ), the broad band indicating the uncertainty of the forecast. It has become clear in recent years that the original prediction was too low, which prompted NOAA to issue a new one. The magenta line (
 ) traces the new forecast, and takes into account recent high sunspot counts.




You must be logged in to post a comment.