Global warming, climate change, all these things are just a dream come true for politicians. I deal with evidence and not with frightening computer models because the seeker after truth does not put his faith in any consensus. The road to the truth is long and hard, but this is the road we must follow. People who describe the unprecedented comfort and ease of modern life as a climate disaster, in my opinion have no idea what a real problem is.
You might have read about RCP8.5, which is now called SSP5-8.5. It is the most extreme future scenario proposed by the IPCC. You might also have read that it is being thrown in the trash can.
Guest Post byWillis Eschenbach(@WEschenbach on X, and my blog is here.)
You might have read about RCP8.5, which is now called SSP5-8.5. It is the most extreme future scenario proposed by the IPCC. You might also have read that it is being thrown in the trash can.
Finally, you may have seen claims from the usual suspects that the death of SSP5-8.5 is because we’ve been so gosh-darned successful in reducing CO2 emissions. Gavin Schmidt’s RealClimate blog (where I’ve been banned for a couple of decades now) mentions the effects of “the Montreal Protocol, the Clean Air Acts, renewable energy price falls, fracking, the Paris Agreement, actual climate policies”.
Figure 1. The inexorable rise of atmospheric CO2. If emissions were dropping as the usual suspects claim, the rise would be slowing.
But some imagined drop in emissions is not the reason that SSP5-8.5 was killed. That hasn’t happened. Here’s a detailed look at the changes in the trajectory of the atmospheric CO2.
Figure 2. Actual atmospheric CO2 concentration, and the calculated acceleration of the concentration.
There’s been no change in the progression of atmospheric CO2. SSP5-85 died because it was alarmist nonsense from Day One, and the IPCC is finally admitting that obvious fact.
SSP5-8.5 is an economic fairy tale commissioned around 2011 for the IPCC, stitched together by a crew of modelers told to imagine how to drive CO₂ emissions into the stratosphere by 2100. The task was not “what’s likely?”, but “what would it take to get the highest plausible emissions you can mathematically torture out of the system?”
To get there, they had to run history backwards. Instead of continuing the observed move away from coal toward oil, gas, and non-fossil energy, they assumed a huge global lurch back to coal, with coal use multiplying several-fold so that by the end of the century, roughly half of all energy on Earth comes from coal alone. Not just for electricity either—coal-to-liquids for cars and planes, as though the world looked at cheaper, cleaner competition and said: “No thanks, bring me more soot.”
Even that wasn’t enough. So population growth, which in the real world has been slowing, gets dialed up to around 11–12 billion people by 2100, right out near the high end of speculative projections.
That still wasn’t enough. So technological progress in energy efficiency, which has been marching along for decades, is assumed to more or less stall, so we keep wasting energy like there’s no tomorrow.
And on top of that, the scenario simply supposes that meaningful climate policy never really bites anywhere that matters—no sustained global effort to bend the emissions curve for the rest of the century.
String all of that together, and you get SSP5-85: a “fossil-fueled development” storyline where coal dominates, population balloons, innovation sputters, and policy sleeps.
It may or may not have been useful as a stress test of the climate system under extreme forcing. But as a picture of where the real world is actually headed, it depended on a long list of things all going wrong, all at once, for a very long time—which is precisely why the common practice of treating it as “business as usual” was alarmist storytelling, not science.
And telling these stories has caused real damage. SSP5-8.5 has been the backbone for all the exaggerated claims of sea level rise, extreme weather, and upcoming Thermageddon™. It has been put forward as the main argument for the insane “Net Zero” policies bankrupting the nations foolish enough to sign on to them. It has caused no end of trouble.
So don’t believe the merchants of doom and the serial failed doomcasters. SSP5-8.5 was garbage from the start, and that’s why it was thrown out. Nothing to do with fancied changes in emissions, and everything to do with the fact that it was designed as a propaganda tool.
However, don’t think we can rest on our laurels. The usual suspects will just latch onto the next most alarmist scenario, SSP3-7.0, which is only slightly better … you see, the problem is that the mainstream climate scientists are caught in the Sinclair Trap, viz:
“It is difficult to get a man to understand something when his salary depends upon his not understanding it.”
My best to all on a foggy night here in the forest on a hill,
w.
Oh, yeah: When you comment, please do everyone a favor and QUOTE THE EXACT WORDS YOU ARE DISCUSSING. I can defend my own words. I can’t defend your restatement of my ideas.
The climatists have seized on this unusual warming as proof their Zero Carbon agenda is needed, without addressing how impossible it would be for CO2 warming the air to raise ocean temperatures. It is the ocean that warms the air, not the other way around.
The best context for understanding decadal temperature changes comes from the world’s sea surface temperatures (SST), for several reasons:
The ocean covers 71% of the globe and drives average temperatures;
SSTs have a constant water content, (unlike air temperatures), so give a better reading of heat content variations;
A major El Nino was the dominant climate feature in recent years.
Previously I used HadSST3 for these reports, but Hadley Centre has made HadSST4 the priority, and v.3 will no longer be updated. This February report is based on HadSST 4, but with a twist. The data is slightly different in the new version, 4.2.0.0 replacing 4.1.1.0. Product page is here.
The Current Context
The chart below shows SST monthly anomalies as reported in HadSST 4.2 starting in 2015 through February 2026. A global cooling pattern is seen clearly in the Tropics since its peak in 2016, joined by NH and SH cycling downward since 2016, followed by rising temperatures in 2023 and 2024 and cooling in 2025, now with a steady mild rising in 2026.
Note that in 2015-2016 the Tropics and SH peaked in between two summer NH spikes. That pattern repeated in 2019-2020 with a lesser Tropics peak and SH bump, but with higher NH spikes. By end of 2020, cooler SSTs in all regions took the Global anomaly well below the mean for this period. A small warming was driven by NH summer peaks in 2021-22, but offset by cooling in SH and the tropics, By January 2023 the global anomaly was again below the mean.
Then in 2023-24 came an event resembling 2015-16 with a Tropical spike and two NH spikes alongside, all higher than 2015-16. There was also a coinciding rise in SH, and the Global anomaly was pulled up to 1.1°C in 2023, ~0.3° higher than the 2015 peak. Then NH started down autumn 2023, followed by Tropics and SH descending 2024 to the present. During 2 years of cooling in SH and the Tropics, the Global anomaly came back down, led by Tropics cooling from its 1.3°C peak 2024/01, down to 0.5C in November 2025. That same month, the Global anomaly exactly matched the mean for this period, with all regions converging on that value, lincluding a 5 month drop in NH. Now in 2026, due to a six-month rise in SH and Tropice, plus NH the last three months, the Global anomaly in April is matching the value 2 years ago, 04/2024.
Comment:
The climatists have seized on this unusual warming as proof their Zero Carbon agenda is needed, without addressing how impossible it would be for CO2 warming the air to raise ocean temperatures. It is the ocean that warms the air, not the other way around. Recently Steven Koonin had this to say about the phonomenon confirmed in the graph above:
El Nino is a phenomenon in the climate system that happens once every four or five years. Heat builds up in the equatorial Pacific to the west of Indonesia and so on. Then when enough of it builds up it surges across the Pacific and changes the currents and the winds. As it surges toward South America it was discovered and named in the 19th century It iswell understood at this point that the phenomenon has nothing to do with CO2.
Now people talk about changes in that phenomena as a result of CO2 but it’s there in the climate system already and when it happens it influences weather all over the world. We feel it when it gets rainier in Southern California for example. So for the last 3 years we have been in the opposite of an El Nino, a La Nina, part of the reason people think the West Coast has been in drought.
It has now shifted in the last months to an El Nino condition that warms the globe and is thought to contribute to this Spike we have seen. But there are other contributions as well. One of the most surprising ones is that back in January of 2022 an enormous underwater volcano went off in Tonga and it put up a lot of water vapor into the upper atmosphere. It increased the upper atmosphere of water vapor by about 10 percent, and that’s a warming effect, and it may be that is contributing to why the spike is so high.
A longer view of SSTs
The graph above is noisy, but the density is needed to see the seasonal patterns in the oceanic fluctuations. Previous posts focused on the rise and fall of the last El Nino starting in 2015. This post adds a longer view, encompassing the significant 1998 El Nino and since. The color schemes are retained for Global, Tropics, NH and SH anomalies. Despite the longer time frame, I have kept the monthly data (rather than yearly averages) because of interesting shifts between January and July. 1995 is a reasonable (ENSO neutral) starting point prior to the first El Nino.
The sharp Tropical rise peaking in 1998 was dominant in the record, starting Jan. ’97 to pull up SSTs uniformly before returning to the same level Jan. ’99. There were strong cool periods before and after the 1998 El Nino event. Then SSTs in all regions returned to the mean in 2001-2.
SSTS fluctuate around the mean until 2007, when another, smaller ENSO event occurs. There is cooling 2007-8, a lower peak warming in 2009-10, following by cooling in 2011-12. Again SSTs are average 2013-14.
Now a different pattern appears. The Tropics cooled sharply to Jan 11, then rise steadily for 4 years to Jan 15, at which point the most recent major El Nino takes off. But this time in contrast to ’97-’99, the Northern Hemisphere produces peaks every summer pulling up the Global average. In fact, these NH peaks appear every July starting in 2003, growing stronger to produce 3 massive highs in 2014, 15 and 16. NH July 2017 was only slightly lower, and a fifth NH peak still lower in Sept. 2018.
The highest summer NH peaks came in 2019 and 2020, only this time the Tropics and SH were offsetting rather adding to the warming. (Note: these are high anomalies on top of the highest absolute temps in the NH.) Since 2014 SH has played a moderating role, offsetting the NH warming pulses. After September 2020 temps dropped off down until February 2021. In 2021-22 there were again summer NH spikes, but in 2022 moderated first by cooling Tropics and SH SSTs, then in October to January 2023 by deeper cooling in NH and Tropics.
Then in 2023 the Tropics flipped from below to well above average, while NH produced a summer peak extending into September higher than any previous year. Despite El Nino driving the Tropics January 2024 anomaly higher than 1998 and 2016 peaks, following months cooled in all regions, and the Tropics continued cooling in April, May and June along with SH dropping. After July and August NH warming again pulled the global anomaly higher, September through January 2025 resumed cooling in all regions, continuing February through April 2025, with little change in May,June and July despite upward bumps in NH. Now temps in all regions have cooled from August through November 2025, followed by a rebound of mild warming in 2026 appears in all regions through April.
What to make of all this? The patterns suggest that in addition to El Ninos in the Pacific driving the Tropic SSTs, something else is going on in the NH. The obvious culprit is the North Atlantic, since I have seen this sort of pulsing before. After reading some papers by David Dilley, I confirmed his observation of Atlantic pulses into the Arctic every 8 to 10 years.
Contemporary AMO Observations
Through January 2023 I depended on the Kaplan AMO Index (not smoothed, not detrended) for N. Atlantic observations. But it is no longer being updated, and NOAA says they don’t know its future. So I find that ERSSTv5 AMO dataset has current data. It differs from Kaplan, which reported average absolute temps measured in N. Atlantic. “ERSST5 AMO follows Trenberth and Shea (2006) proposal to use the NA region EQ-60°N, 0°-80°W and subtract the global rise of SST 60°S-60°N to obtain a measure of the internal variability, arguing that the effect of external forcing on the North Atlantic should be similar to the effect on the other oceans.” So the values represent SST anomaly differences between the N. Atlantic and the Global ocean.
The chart above confirms what Kaplan also showed. As August is the hottest month for the N. Atlantic, its variability, high and low, drives the annual results for this basin. Note also the peaks in 2010, lows after 2014, and a rise in 2021. Then in 2023 the peak reached 1.4C before declining to 0.9 August 2026. An annual chart below is informative:
Note the difference between blue/green years, beige/brown, and purple/red years. 2010, 2021, 2022 all peaked strongly in August or September. 1998 and 2007 were mildly warm. 2016 and 2018 were matching or cooler than the global average. 2023 started out slightly warm, then rose steadily to an extraordinary peak in July. August to October were only slightly lower, but by December cooled by ~0.4C.
Then in 2024 the AMO anomaly started higher than any previous year, then leveled off for two months declining slightly into April. Remarkably, May showed an upward leap putting this on a higher track than 2023, and rising slightly higher in June. In July, August and September 2024 the anomaly declined, and despite a small rise in October, ended close to where it began. Note 2025 started much lower than the previous year and headed sharply downward, well below the previous two years, then since April through September aligning with 2010. In October there was an unusual upward spike, now reversed down to match 2022 and 2016. The orange 2026 line continues downward and is visible on top of 2016 purple line, well below the peak years of 2023 and 2024.
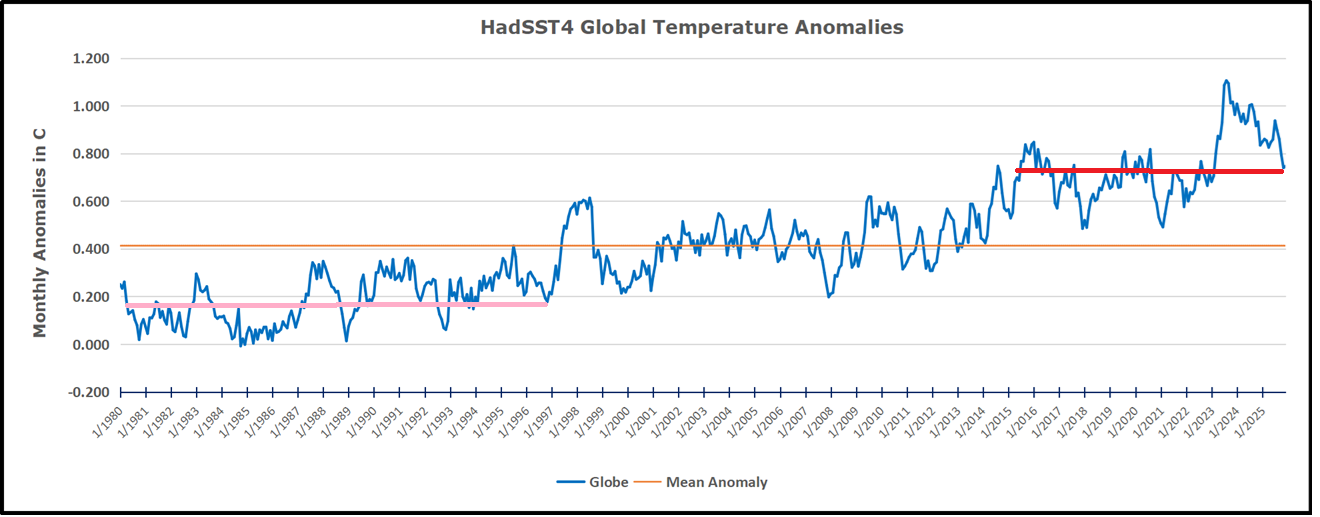
The pattern suggests the ocean may be demonstrating a stairstep pattern like that we have also seen in HadCRUT4.
The rose line is the average anomaly 1982-1996 inclusive, value 0.18. The orange line the average 1982-2025, value 0.41 also for the period 1997-2012. The red line is 2015-2025, value 0.74. As noted above, these rising stages are driven by the combined warming in the Tropics and NH, including both Pacific and Atlantic basins.
The oceans are driving the warming this century. SSTs took a step up with the 1998 El Nino and have stayed there with help from the North Atlantic, and more recently the Pacific northern “Blob.” The ocean surfaces are releasing a lot of energy, warming the air, but eventually will have a cooling effect. The decline after 1937 was rapid by comparison, so one wonders: How long can the oceans keep this up? And is the sun adding forcing to this process?
USS Pearl Harbor deploys Global Drifter Buoys in Pacific Ocean
Consulting my UN gibberish translator, “carry significant legal and moral authority” = receive money next time a climate activist is in charge of the United States. Because nobody else is going to put up the money to pay for this nonsense.
The Secretary-General said it makes clear Member States’ responsibility to protect their own people from what is an “escalating climate crisis”.
The resolution drawn up by Vanuatu – a Pacific island nation on the frontline of the climate crisis, and several other countries – was adopted after intense discussion including multiple proposed amendments with 141 votes in favour, eight against and 28 abstentions.
…
The Court also ruled that if States breach these obligations, they are legally responsible and may be legally required to stop the wrongful conduct, offer guarantees that it won’t happen again, and make full reparation, depending on the circumstances.
Although the ICJ’s advisory opinions are not binding, they carry significant legal and moral authority – helping to clarify and develop international law by defining States’ legal obligations.
…
The resolution calls on all UN Member States to take all possible steps to avoid causing significant damage to the climate and environment, including emissions produced within their borders, and to follow through on their existing climate pledges under the Paris Agreement.
…
In a statement released after the General Assembly vote, Mr. Guterres declared that those least responsible for climate change are paying the highest price, and that the path to climate justice “runs through a rapid, just, and equitable transition away from fossil fuels towards renewable energy.”
Consulting my UN gibberish translator, “carry significant legal and moral authority” = receive money next time a climate activist is in charge of the United States. Because nobody else is going to put up the money to pay for this nonsense.
I was hoping the whole climate movement was on the brink of death, especially with the collapse of the RCP 8.5 narrative, but climate activism may be finding a new lease of life by hitching itself to the anti-data center movement.
The sad thing is the data center issue is entirely solvable – data centers don’t have to be located near where people currently live. A new data center park in some frozen wilderness, to make cooling the high capacity computer servers easier, powered by as many adjacent coal plants or nuclear reactors as were required, would deliver all the AI capacity the USA needs to stay competitive, without messing up everyone elses day.
The UK’s Sustainable Aviation Fuel (SAF) Mandate, which took effect on 1 January 2025, applies to all jet fuel supplied for flights departing the UK—including Royal Air Force (RAF) operations—with no military exemption. Ministry of Defence figures indicate this will cost the RAF more than £1 billion over the next 15 years.
The £1bn figure is well-substantiated by official MoD/RAF estimates and recent parliamentary disclosures. It stems from the UK’s SAF Mandate (effective 1 Jan 2025), which applies universally to all jet fuel supplied for UK departures — with no exemption for military use.
The estimates use 250 million litres of annual baseline fuel consumption (training, routine ops from UK bases; excludes variable high-tempo operational flying). Costs reflect the premium via tradable SAF certificates (market averages ~£3.30/litre for conventional SAF, ~£4.00 for PtL).
Key annual figures:
2025: £16.5m (2% obligation)
2030: £83.4m (10%)
2040: £187.6m (22%, with 3.5% PtL sub-target)
Cumulative over ~15 years: Exceeds £1 billion, with annual costs surpassing £100m by around 2040. Buy-out (penalty) ceilings are higher, but market compliance is assumed cheaper.
The policy is a deliberate demand-pull to scale a nascent industry.
Whether the emissions benefits and future cost curves justify the near-term hit on defence budgets is a legitimate debate — especially given uncertain scalability, feedstock limits, and geopolitical priorities.
The £1bn is not hype; it’s grounded in MoD modelling.
RAF to spend £1bn switching to sustainable jet fuel
Government’s net-zero aviation mandate predicted to cost British military £100m each year by 2040
The RAF will spend more than £1bn over the next 15 years on switching to sustainable jet fuel.
Ministry of Defence (MoD) figures show the move to sustainable fuel for RAF flights will cost more than £100m each year by 2040. The Telegraph has the story.
The Government’s sustainable aviation fuel (SAF) mandate on all flights departing the UK will apply to journeys by RAF aircraft on military exercises and deployments.
Sustainable fuel can be produced from used cooking oil and household rubbish, and reduces lifetime emissions by up to 80 per cent compared to conventional jet fuel.
However, it is typically three times the price of regular fuel, so the mandate will add significantly to the British military’s fuel bills over the next 15 years.
By 2040, ministers say 22 per cent of aviation fuel must come from sustainable sources, even though official projections show it will still be almost twice as expensive as conventional fuel by that date.
Figures released by the MoD in response to parliamentary questions from the Conservatives show that the total additional cost of using sustainable fuel will be more than £1bn.
The same sum could buy 12 F-35 Lightning stealth fighters or a Type 45 warship, or pay the salaries of 2,500 regular soldiers for 15 years.
Sir Keir Starmer is under increasing pressure to release his defence investment plan, a 10-year strategy to fund military investment to meet threats posed by Russia and China.
The strategy was intended to be published last year, but has been delayed repeatedly amid conflict between the MoD and the Treasury about the size of the investment.
Germany’s No. 1 party – conservative AfD Party – calls for tangible consequences for politics, the media, and the judiciary after extreme emission scenario “RCP 8.5 is no longer scientifically serious and will no longer be used.
Germany’s No. 1 party – conservative AfD Party – calls for tangible consequences for politics, the media, and the judiciary after extreme emission scenario “RCP 8.5 is no longer scientifically serious and will no longer be used.
The background for the debate was the decision within the scientific IPCC/CMIP7 framework to no longer use the extreme emission scenario “RCP 8.5” (or SSP5-8.5) as a plausible worst-case scenario.
AfD climate spokesperson Karsten Hilse described the scenario as an implausible “horror scenario” and “the greatest fraud in human history”, arguing that it had been used for years to generate panic and justify expensive climate measures, and had even influenced the Federal Constitutional Court’s draconian 2021 climate ruling.
The other political parties (Union, SPD, Greens, Left) rejected the criticism. They argued that the extreme scenario had become unrealistic precisely because of the success of climate protection and renewable energies! Therefore, the AfD Party (the true conservatives) in Germany there is no need to change policy, especially since other scenarios with significant warming (up to approximately 3–3.5 °C) remain in place.
EIKE, however, vehemently contradicts the reasoning of the mainstream parties. Citing data from the Energy Institute Statistical Review of World Energy 2025, EIKE argues that the global contribution of wind (1.5%) and solar (1.3%) to the primary energy demand in 2024 totaled just around 2.8%.
CO2 emissions have not slowed globally
EIKE views the success of renewables as a sham argument, claiming instead that deindustrialization is the true cause of altered emission trends.
Media coverage following the debate was very restrained, limited, and largely following standard patterns of political polarization. The topic did not trigger a major wave of media attention.
“After 15 years of Dumocrats promising that ‘Climate Change’ is going to destroy the Planet, the United Nations TOP Climate Committee just admitted that its own projections (RCP8.5) were WRONG! WRONG! WRONG!” Trump wrote, quite incorrectly, on Truth Social. “Unlike the Dumocrats, who use Climate Alarmism nonsense to push their Green New Scam, my Administration will always be based on TRUTH, SCIENCE, and FACT!”
Even in light of the Trump administration’s gutting of American science and the president’s well-documented reckless disregard for the truth, this post stands out as patently, particularly absurd. But Trump’s new climate-denial talking point is a weaponized version of new developments in climate science. Trump’s typically bombastic disinformation—if casually combined with a real debate within the climate community about one climate projection—will muddy the public understanding of science enough that Americans on both sides of the aisle might be left with an incorrect and dangerous belief that they no longer need to worry about the climate crisis.
…
The new high-emissions scenario hypothesizes a backsliding of progress, where current climate policies are rolled back, clean-energy development slows, and fossil-fuel use expands. This scenario leads most likely to a temperature rise of about 3.5 degrees Celsius by 2100, but the range of possible heating by that date spans from 2.5 degrees to 4.3 degrees Celsius. The scenario also projects more heating after 2100, since global emissions fail to shrink to net zero. Indeed, the new high-emissions scenario projects that the world could heat up to RCP8.5’s 5 degrees Celsius by 2150, just 50 years later.
Sooo – it’s still an urgent emergency we have to deal with right now, even though thermageddon has been deferred by at least 50 years?
For a long time I’ve been relishing the prospect of Michael Mann having to publicly downgrade his climate claims, but now that moment has arrived, I don’t feel the satisfaction I thought I would feel. The damage done to the global economy by these clowns – decades of stunted economic growth – is too great to feel happiness at a grudging admission their predictions were too extreme.
Even sadder that Mann has chosen to cling to the tattered remnants of his mantle of alarmism, instead of coming clean and properly admitting he was completely wrong. To paraphrase Gandalf in Lord of the Rings during the confrontation with the defeated wizard Saruman, even now Mann could have done some good, by following climate alarmist James Lovelock’s footsteps and admitting climate alarmism was a mistake. Such an admission might have helped to reduce the suffering in backwards outposts of climate ignorance like the European Union, by accelerating their awakening from their Net Zero nightmare.
But Michael Mann, as always, in my opinion has placed his personal vanity ahead of attempting any kind of restitution for all the harm his “hide the decline” hockey stick climate alarmism has caused over the years.


You must be logged in to post a comment.