Global warming, climate change, all these things are just a dream come true for politicians. I deal with evidence and not with frightening computer models because the seeker after truth does not put his faith in any consensus. The road to the truth is long and hard, but this is the road we must follow. People who describe the unprecedented comfort and ease of modern life as a climate disaster, in my opinion have no idea what a real problem is.
I keep a spreadsheet with links to informative articles I have read on ESG and climate change. I typically attach key words to each link so I can easily search out a topic when needed for reference. When it comes to the climate change debate, “absurdity,” “mendacity,” “grift” and “tyranny” make frequent appearances. But the star of the show seems to be “fantasy.”
I keep a spreadsheet with links to informative articles I have read on ESG and climate change. I typically attach key words to each link so I can easily search out a topic when needed for reference. When it comes to the climate change debate, “absurdity,” “mendacity,” “grift” and “tyranny” make frequent appearances. But the star of the show seems to be “fantasy.”
Last month, the always perspicacious Mark Mills penned an excellent piece in City Journal titled “When Politics and Physics Collide.” (1) It is a comprehensive indictment of the magical thinking that permeates the lemming-like rush to EVs, Net Zero and the bulk of “green” technologies.
Here is a sprinkling of the points he makes in his damning analysis:
100 percent of everything in civilized society, including the favored “green energy” machines themselves, depends on using hydrocarbons somewhere in the supply chains and systems.
Through regulatory fiat, the Environmental Protection Agency’s newly announced rules effectively mandate that more than half of all cars and trucks sold must be electric vehicles (EVs) by 2032. That will demand, and soon, the complete restructuring of the $100 billion U.S. automobile industry.
A seminal paper from the International Energy Agency (IEA) estimated a fourfold to 40-fold increase in global mining would be needed for a variety of common energy minerals. A more recent paper from Yale looked at a suite of 15 rare minerals required for “full decarbonization” and reached similar conclusions: the supply of various key “rare earth” elements would have to increase 60- to 300-fold.
It is no exaggeration to say that the realities of solar silicon fabrication mean that solar subsidies and mandates have induced eager Californians to festoon their roofs with transmuted coal – because China has a 90 percent market share producing solar silicon on its coal-fired grids.
The total direct and induced spending on the energy transition could easily exceed $5 trillion before a decade passes, or sooner, if advocates prevail. For context, the entirety of World War II cost the U.S. roughly $4 trillion (in today’s dollars).
Read the whole article, and you will probably come to ask yourself the same question I have been asking for quite some time: how can investment management companies continue to insist that ESG investing meets their fiduciary obligations when most of the sustainability agenda is physically, economically, and politically unattainable?
Any opinions are those of Don Harrison and not necessarily those Raymond James Financial Services, Inc., or of Raymond James. The information contained in this presentation does not purport to be a complete description of the securities, markets, or developments referred to in this material. There is no assurance any of the trends mentioned will continue or forecasts will occur. The information has been obtained from sources considered to be reliable, but Raymond James does not guarantee that the foregoing material is accurate or complete. Any information is not a complete summary or statement of all available data necessary for making an investment decision and does not constitute a recommendation. Investing involves risk and you may incur a profit or loss regardless of strategy selected. Links are being provided for information purposes only. Raymond James is not affiliated with and does not endorse, authorize or sponsor any of the listed websites or their respective sponsors. Raymond James is not responsible for the content of any website or the collection or use of information regarding any website’s users and/or members.
Don Harrison, creator of Heart of Liberty Portfolios, is the President of Capitalist Investment Services and a Branch Manager and Financial Advisor with Raymond James Financial Services. Heart of Liberty Portfolios — first choice for investors who want to rid their portfolios of ESG.
In this article, I will try to identify and estimate the value of the regulations imposed by the federal government that indirectly raise consumers’ costs.
In this article, I will try to identify and estimate the value of the regulations imposed by the federal government that indirectly raise consumers’ costs.
There is no generally-accepted and authoritative list of the climate policy-related regulations imposed by federal, provincial and municipal governments in Canada. Similarly, there is no authoritative estimate available of the cost to Canadians of the regulations that have been implemented and planned.
The most costly and pervasive regulations would appear to be these:
The Clean Electricity Standards – estimated costs of at least $58 billion
Emissions Cap on the Oil and Gas Sector – estimated costs of $2.3 billion
EV Sales Mandate– estimated costs of $25.5 billion
Net-Zero Building Code by 2030 – Estimated costs unknown but up to $902 billion
Impact Assessment Mandating Attainment of Net-Zero – estimated costs unknown but potentially over $350 billion
In 2022, the Royal Bank Of Canada published a study entitled The $2 Trillion Transition on the “costs of decarbonization”. As indicated by the title, the bank estimated that the total cost of expenditures needed to attain the net zero goal was $2 trillion. In its March 2022 Budget1, the federal government published projections that the total private and government investments needed to attain net zero would be between $125 billion and $140 billion per year from 2023 to 2050, or somewhere between $3.4 trillion and $5.2 trillion.
Thus, the range of estimates published to date is between $2 trillion and $5.2 trillion. That is an almost unimaginable amount of money. $2 trillion is $50,000 for every one of Canada’s 40 million residents now, or $118,000 for every household. $5.2 trillion is $130,000 for every resident, or $306,000 for every household. Averaged over 27 years, $2 trillion would cost every one of today’s residents about $1,850 per year; averaged over 27 years, $5.2 trillion would cost every one of today’s residents $11,330 per year.
Leaving aside the question of whether net-zero emissions is an attainable goal by 2050, the costs that can already be anticipated fall into a range that would impose unprecedented costs on the Canadian economy and harm the future income growth and standard of living of all Canadians. The story needs to be told to the general public as well as to the politicians making the choices for us.
In a recent article, I offered the most recent information available on the financial cost to Canadians of the federal government’s climate policy-related tax and expenditure measures. Those measures increase costs in two ways – by increasing the amount of revenue that Canadians pay in taxes and by increasing the prices of the energy that people use.
In this article, I will try to identify and estimate the value of the regulations imposed by the federal government that indirectly raise consumers’ costs.
“The hypocrisy of the Biden administration taking credit for lower gasoline prices as the summer driving season begins by fulfilling a Congressional mandate is unsurprising.”
“We now have the amazing scenario where days before the start of the hurricane season, Democrats in Congress and Biden are willing to empty the gasoline reserve.”
The Department of Energy announced Tuesday that it would begin selling the one million barrels of gasoline in the Northeast Gasoline Supply Reserve. Bids for the supply are due May 28th with delivery expected by June 30th. Bids will be accepted for lots of 100,000 barrels. The supply represents 42 million gallons of gasoline and is held in commercial storage tanks in Maine and New Jersey.
The sale was mandated by the omnibus Congressional spending bill (HR 2882) approved in late March with procedural hijinks by Senate Leader Chuck Schumer. If you remember, it was during the final hours of the Friday before the week-long Congress’ Easter Recess that the House passed the legislation 286-134 providing funding to keep the government operating through its September 30 fiscal year-end. The bill was passed over to the Senate which passed it in the early morning hours of Saturday and forwarded it to the White House for President Joe Biden’s signature that evening. Importantly, more Democrats than Republicans in the House voted for the bill as more than 100 Republicans voted against it.
We now have the amazing scenario where days before the start of the hurricane season, Democrats in Congress and Biden are willing to empty the gasoline reserve. Energy Secretary Jennifer Granholm said in a statement, “By strategically releasing this reserve in between Memorial Day and July 4th, we are ensuring sufficient supply flows to the tri-state and northeast at a time hardworking Americans need it the most.” How funny that the Biden administration is taking credit for helping consumers by following through on a Congressionally mandated action.
I recently wrote about our drive from Houston to Rhode Island. My article discussed gasoline prices and how they became more expensive as we headed north, primarily due to higher state taxes in the Northeast states. I commented on Biden’s election problem with high gasoline prices and our expectation that he would repeat his 2022 move to tap the Strategic Petroleum Reserve to lower pump prices in the run-up to the November election. He was successful, but as shown in a chart, gasoline pump prices have increased 53% since Biden entered office.
Biden successfully pushed down gasoline prices by tapping the SPR in 2022.
The gasoline reserve was established in 2014, two years after Super Storm Sandy slammed the Northeast region and disrupted fuel supply availability sending gasoline prices soaring. Some gasoline stations were without fuel for 30 days. Having gasoline supplies pre-positioned in the region reduces the risk for consumers from future storm disruptions.
East Coast states depend on Colonial Pipeline for 55% of their gasoline, diesel, and jet fuel supply.
The vulnerability of the Northeast and Middle Atlantic states to fuel supply disruptions emerged on May 7, 2021, when the Colonial Pipeline was hit in a ransomware attack. The pipeline, which originates in Houston and runs to New York, supplies the East Coast states with 55% of its petroleum fuels – gasoline, diesel, and jet fuel. The pipeline was shut down to protect its operations and billing system. Operations were slowly restarted after the ransom was paid.
Fuel shortages occurred at gasoline stations amid panic buying as the pipeline shutdown extended for days. By the fourth day, Alabama, Florida, Georgia, North Carolina, and South Carolina reported shortages. Areas from northern South Carolina to southern Virginia were hardest hit, with 71% of gasoline stations running out of fuel in Charlotte on May 11th and 87% of stations out in Washington, D.C., on May 14th. Average fuel prices rose to their highest point since 2014, reaching more than $3 a gallon. Jet fuel availability caused several airlines operating from Charlotte to alter refueling arrangements including forced refueling stops for long-haul flights.
Estimates are that the gasoline reserve sale will raise $125 million but, importantly, cut storage costs. The Energy Department’s 2022 report on the SPR said it costs about $13 per barrel annually for operations and maintenance of the gasoline reserve compared with about 30 cents per barrel for crude oil in the SPR.
The hypocrisy of the Biden administration taking credit for lower gasoline prices as the summer driving season begins by fulfilling a Congressional mandate is unsurprising. We are also struck by how shortsighted Democrats are, especially those in the Northeast states who voted for the spending bill. Their shortsightedness is laughable given the region’s energy risk from supply disruptions on the eve of the start of the hurricane season, which is predicted to be extremely active.
—————–
For more of G. Allen Brooks, see Energy Musings: Insights into the Energy Industry, where this post first appeared. It has been slightly revised for publication here. Mr. Brooks is a long-time participant in, observer of, and commentator on the energy industry. He has been a Wall Street securities analyst, an oil service company manager, a consultant to energy company executives, a member of the boards of directors of numerous energy companies, and a writer and commentator on energy markets and trends.
President Biden has nominated former Massachusetts Undersecretary of Energy and Climate Solutions, Judy Chang, to be a FERC Commissioner. Ms. Chang is possibly best well-known for a 2018 comment staking out the position that because New England would move away from natural gas within the next five years it was irresponsible to invest in pipelines.
President Biden has nominated former Massachusetts Undersecretary of Energy and Climate Solutions, Judy Chang, to be a FERC Commissioner. Ms. Chang is possibly best well-known for a 2018 comment staking out the position that because New England would move away from natural gas within the next five years it was irresponsible to invest in pipelines. At the time—let alone six years later—that is an odd stance for anyone who aspires to serve in a body responsible for ensuring the development of abundant supplies of natural gas at reasonable prices. Related, FERC is most recently known for ‘doing an EPA,’ i.e., “unlawfully supporting climate goals that Congress never approved.”
With Massachusetts’ Office of Energy & Environmental Affairs, which Ms. Chang previously helmed, yet to move on a contemporary, similar request, GAO notes the Commonwealth’s Department of Public Utilities (DPU) has released some records which do open a window onto that office’s working relationship with a renewable energy trade group called Advanced Energy United.
AEU has recently been shown to be the matchmaker for Michael Bloomberg’s operation out of NYU, the State Energy and Environmental Impact Center, to place activist ‘staff’ in progressive PSC/PUC offices to advance their aligned ‘climate’ agenda’, just as it did in AG offices.
Screenshot
Advanced Energy United used to be called Advanced Energy Economy. A Tom Steyer Joint, per his counsel:
GAO looks forward to MA OEE releasing the requested public records.
Prize of the day for national policy research goes to Nick Cater, who managed to ridicule our billion dollar national science agency, the CSIRO, with a newspaper column.
Games with levelized guesses don’t take all the hidden costs into account
Prize of the day for national policy research goes to Nick Cater, who managed to ridicule our billion dollar national science agency, the CSIRO, with a newspaper column.
The CSIRO put out a report proclaiming that nuclear power would be impossible before 2040 and cost “twice as much” as renewables. But Nick Cater just compared electricity in New South Wales to Finland to prove their 129 pages of modeled costs were wrong:
On Saturday…. Electricity generation in NSW was releasing 750g of carbon into the atmosphere per megawatt hour of electricity. In Finland, it was 35g.
If the CSIRO’s GenCost report is to be believed, Finnish electricity prices should have gone through the roof a year ago when its newest reactor was turned on. They did not. The retail price of electricity in Finland, which is indexed to the spot market, came down almost immediately.
Were Energy Minister Chris Bowen to spend a few days in Finland, he might realise almost everything he says about nuclear is complete and utter nonsense. This might be why he spent his time in Europe last year trying to sell green hydrogen to the Germans.
All over Europe the countries with the most solar and wind power have the highest prices
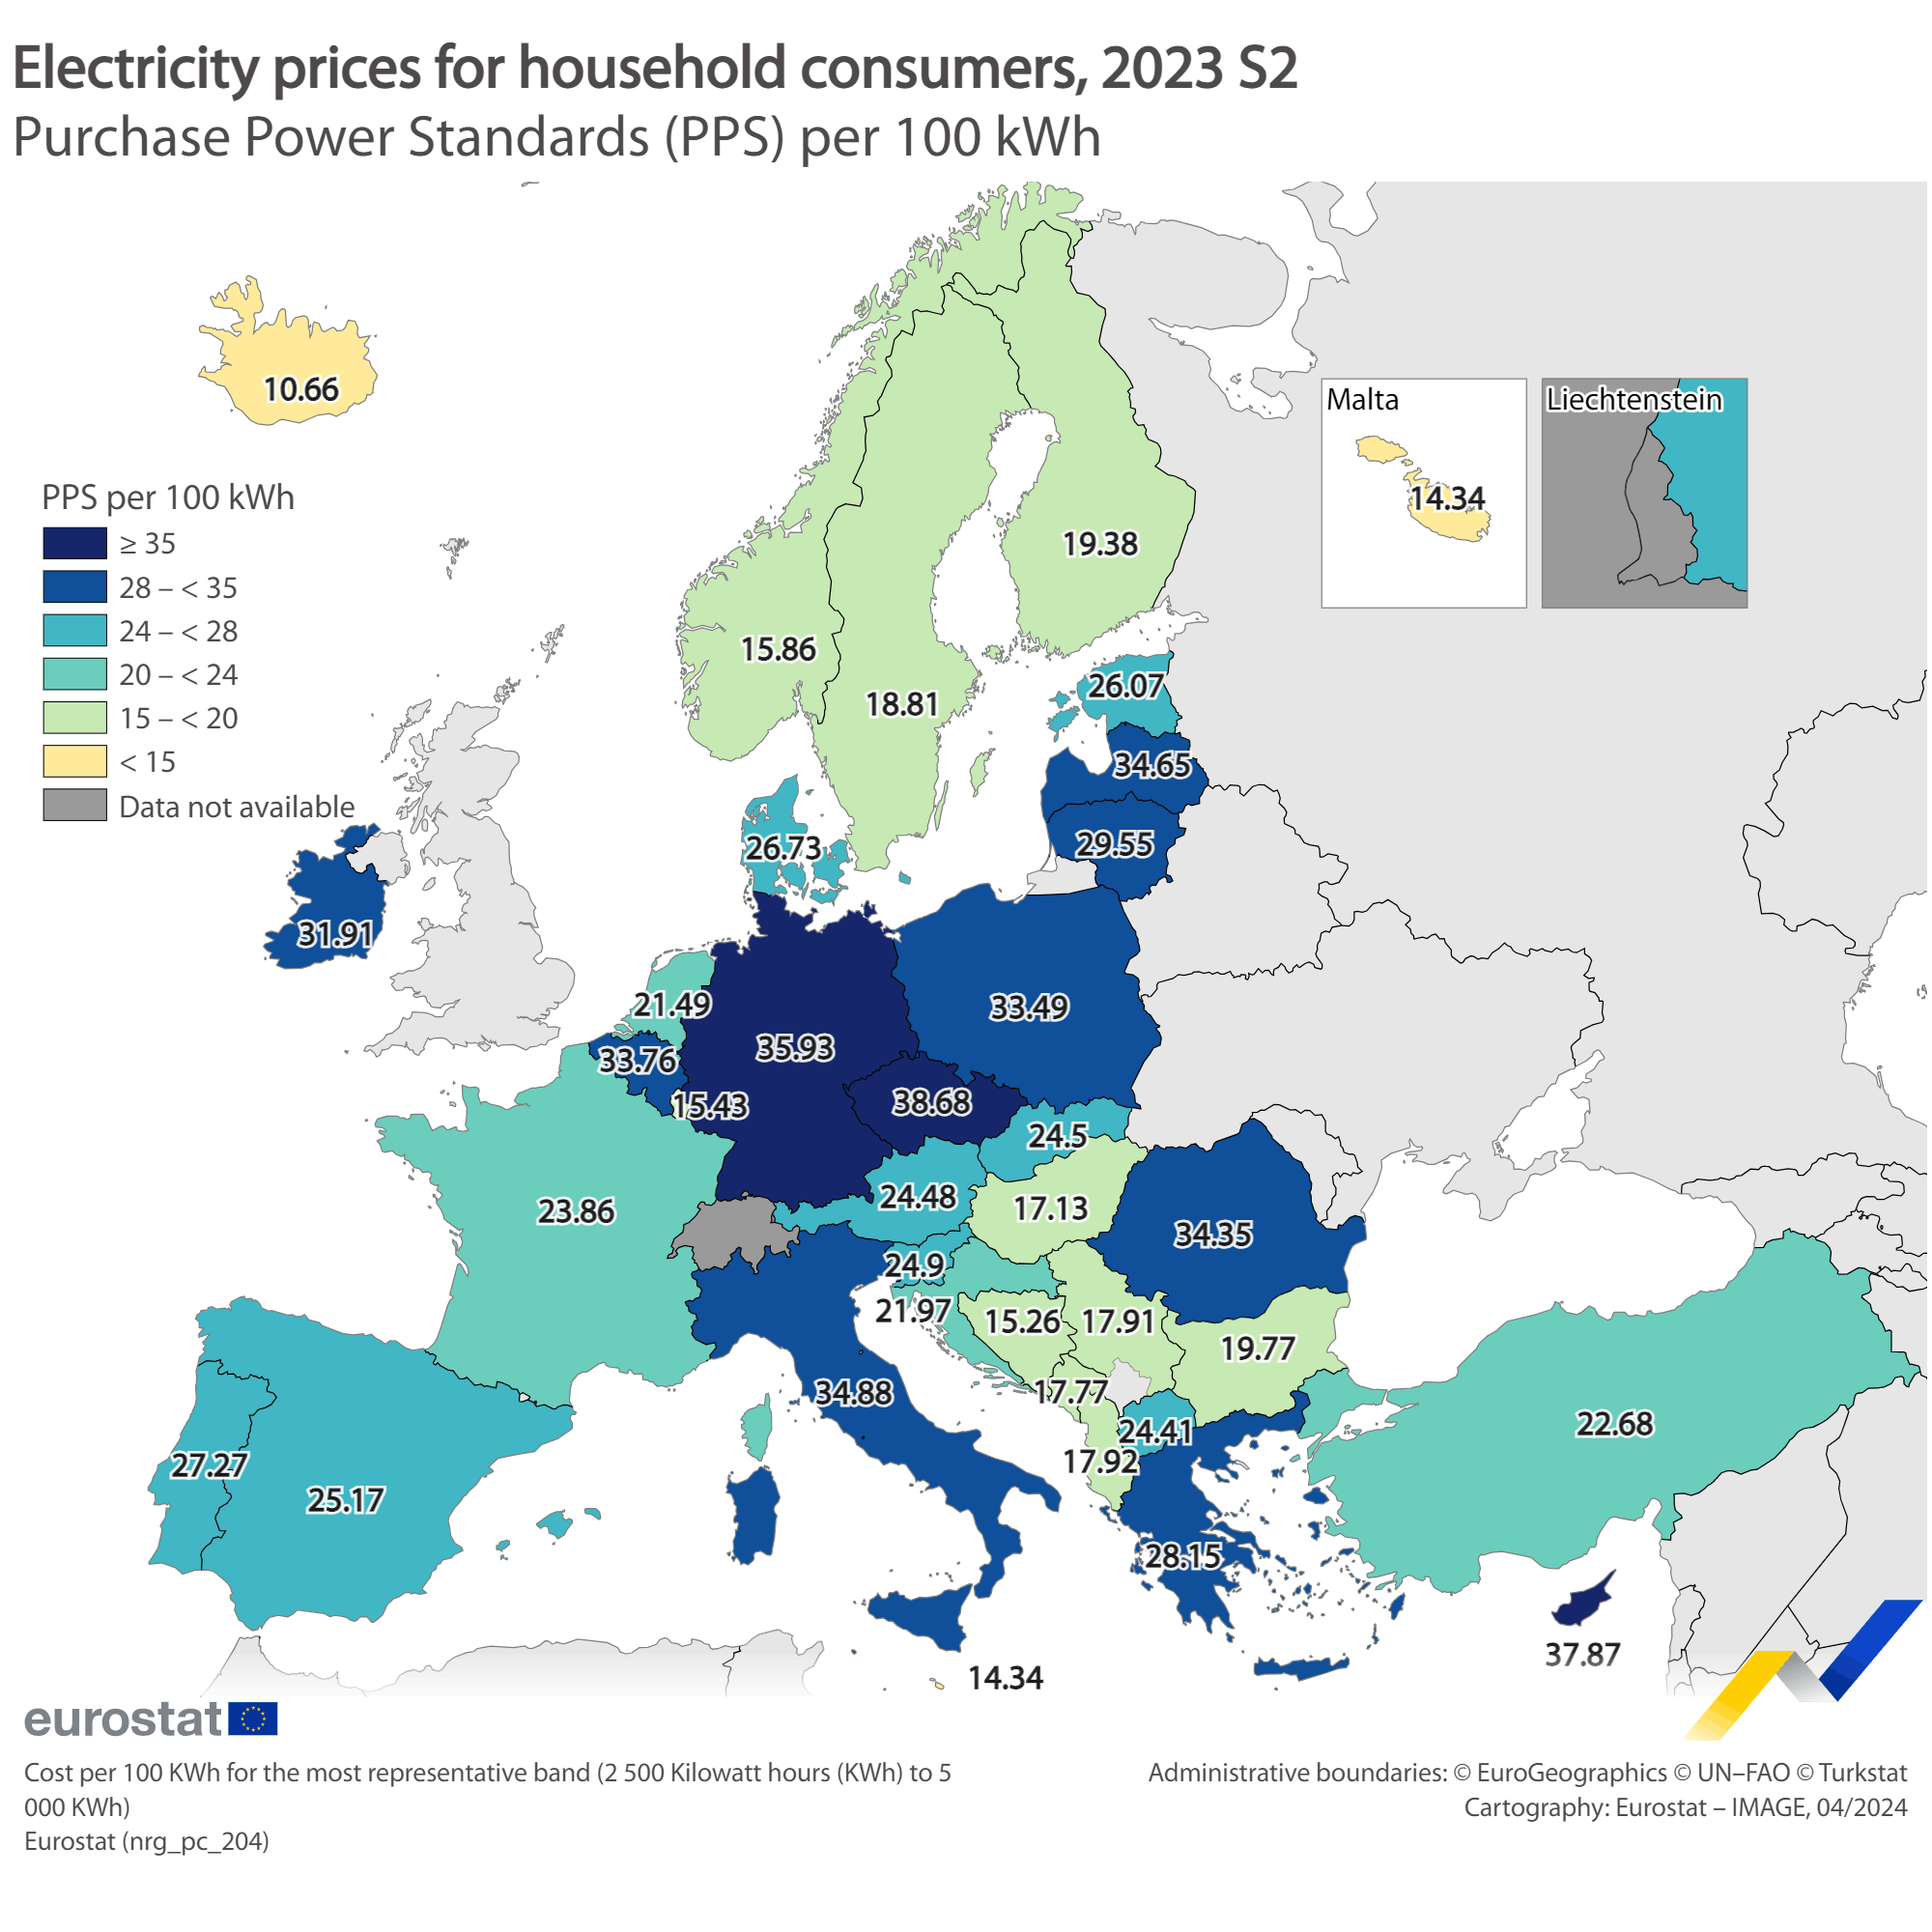
Modeling electricity costs is ripe for the plucking, so the only costs that count are the real ones that customers pay. According to Eurostat data on electricity prices in the EU last year, some countries were paying twice as much as others. And the cheapest electricity was in countries using coal power or lands with lots of hydroelectricity and plenty of water.
And if nuclear power was “eight times” more expensive than solar and wind, why is that Germany pays so much more for electricity than France does?
Germany, Italy, Poland, and Greece are all pricey but none of them have nuclear plants (yet).
Serbia has cheap electricity and it is nearly 70% coal powered. Norway has cheap electricity and 100,000 natural Fjords for hydroelectricity.
Look who has solar power and expensive electricity:
Things aren’t working out well for Greece, Germany and Italy.
Look who has wind power too
Denmark has a lot of wind, but it also has seven interconnectors to countries with cheap reliable hydro and nuclear power. We don’t.
CSIRO artificially pumped up the cost of building a nuclear plant in Australia because it would be a new industry here. Did they do that for technologies that are barely invented like hydrogen and batteries too?
They claim it would take 15 years to build one plant, yet the French built 56 plants in 15 years, and that was 40 years ago. The average build time then, without faxes, flip phones and “the internet” was just 7 years, yet somehow they got it done.
Do the CSIRO think they can get away with publishing this kind of incompetent partisan hackery and Australians won’t find out?
The Heartland Institute’s Donald Kendal, Jim Lakely, Justin Haskins, and Chris Talgo present episode 450 of the In The Tank Podcast. World Economic Forum’s CEO Klaus Schwab just announced he will be stepping down from his role as “Davos Man.” What does this mean for the organization? Who is likely to take over control of the WEF? Also, an anti-CBDC bill is gaining traction in Congress. Will this potential legislation possibly put an end to the quest to establish a central bank digital currency in the United States?
The Heartland Institute’s Donald Kendal, Jim Lakely, Justin Haskins, and Chris Talgo present episode 450 of the In The Tank Podcast. World Economic Forum’s CEO Klaus Schwab just announced he will be stepping down from his role as “Davos Man.” What does this mean for the organization? Who is likely to take over control of the WEF? Also, an anti-CBDC bill is gaining traction in Congress. Will this potential legislation possibly put an end to the quest to establish a central bank digital currency in the United States?
Massive #tornado with multiple vortices rips down windmills and damages homes in Iowa including Greenfield, Iowa. Dominator FPV drone orbited the tornado racing northeast at 55 mph. Dominator 3 could have directly intercepted this tornado. Major tornado outbreak underway
Massive #tornado with multiple vortices rips down windmills and damages homes in Iowa including Greenfield, Iowa. Dominator FPV drone orbited the tornado racing northeast at 55 mph. Dominator 3 could have directly intercepted this tornado. Major tornado outbreak underway
We often tend to think that it is winter when electricity shortages are likely to occur. After all, in summer demand is lower and we have solar power as well.
We often tend to think that it is winter when electricity shortages are likely to occur. After all, in summer demand is lower and we have solar power as well.
With this in mind, let’s have a look at the last seven days, which have not been untypical from a weather point of view. Here is the generation mix:
Don’t pay too much attention to the individual bands at the moment. Instead focus on the four bands in the chart below.
As is often the case in summer, wind power frequently drops away close to zero. Solar power peaked at over 10 GW on some days, but on others it did not even reach 5 GW. Most important of all, of course, is gas which is always on hand, with up to 15 GW required at times, even with I/Cs running at full blast.
In total, gas provided 33%, and nuclear a further 17%. Wind and solar came to 11% and 9% respectively.
Fast forward to 2035, when the Government hopes we’ll have 70 GW of solar power, compared to the current 16 GW.
In theory that should raise solar output from 410 GWh for the week to about 1800 GWh. However, demand is likely to rise as well, maybe from 4600 to 6000 GWh. In other words the increase in solar power will probably only be enough to cover the extra demand. Wind should add some extra output thanks to new wind farms, but not when the wind does not blow.
That means we will potentially need as much power from non-renewable sources as we do now at times during summer months.
But that’s just the tip of the iceberg.
Whereas solar power can peak at 10 GW now at midday, this figure will rise to 44 GW when there is 70 GW of capacity. This will always exceed demand, and the surplus will be wasted unless it is exported to Europe, who will have their own surplus solar power. What we manage to export will inevitably be at prices well below CfD strike prices, and it will be billpayers/taxpayers who will end up footing the bill.
There is of course the option of battery storage, both to mop up these surpluses and to supply power at night.
So how much storage would we need, simply to balance solar output throughout each 24 hour period.
Let’s look at the period from noon on the 19th to noon on the 20th:
The average hourly generation through the 24-hour period was 3289 MWh, so how much storage would we need to ensure that this amount of electricity could be fed to the grid every hour of the day and night, while mopping up the midday surplus?
The surplus begins to build up at noon, (remember that the graph starts at noon), and peaks at 27 GWh at around 5pm. By 2am the surplus is entirely used up, and the deficit accumulates to about 13 GWh at about 7.30am.
I could of course started the graph at 7.30am, which would shown a bigger surplus and no deficit. However the results are exactly the same in terms of storage – that we would need about 40 GWh of battery storage – (27 GWh + 13 GWh).
This is of course just one day, and there will probably be other days when more would be needed. We also need to factor in energy loss during the charging and discharging of the battery. Also the fact that batteries would never be charged to 100%, nor discharged to zero.
But 40 GWh is a good ball park figure, and we can multiply that up to 175 GWh when we have 70 GW of solar power. Currently we have about 2.8 GWh of battery storage around the country, so plainly this does not even start to address the needs imposed by a mass rollout of solar farms.
Looked at another way, we currently have 16 GW of solar power. If solar farms were obliged to provide a steady supply to the grid, they would need to instal 40 GW of battery storage with 1-hour discharge, the typical battery specification. Effectively for every MW of solar capacity, they would have to build 3 MW of storage.
And thjs is just to balance out daily generation, it does nothing to provide seasonal storage.
With comparatively stable CO2 levels over 10,500 years, temperatures still fluctuated within a range of -4 to +3 °C.
Yet, German Constitutional High Court preposterously claims there is an “almost linear relationship” between CO2 and temperature.
With comparatively stable CO2 levels over 10,500 years, temperatures still fluctuated within a range of -4 to +3 °C.
Yet, German Constitutional High Court preposterously claims there is an “almost linear relationship” between CO2 and temperature.
Junk mandated to “science” by law?
Alpine glaciers: spoilsports for the CO2 climate hypothesis
The CO2 introduced into the atmosphere by humans through the burning of fossil fuels is declared by today’s climate science as a “greenhouse gas” to be the decisive factor in an impending climate catastrophe. It is claimed that “never before” temperatures on earth had been rising at such rates as nowadays. The Alpine glaciers are often referred to as key witnesses to this argument. This “eternal” ice is said to be under existential threat from climate change. The “death” of glaciers is mourned on radio, in TV-shows and in the printed press. To prevent this impending catastrophe, the advanced civilization to which we owe our comparatively healthy and carefree lifestyle must be scrapped: let’s do away with coal, oil, gas and nuclear energy, with cars, steel, aluminum, concrete….and as a consequence also with modern medicine.
By Fred F. Mueller
Fig. 1:: Just as its peers in the Alps, the Great Aletsch Glacier – seen here from the Jungfraujoch – is being stylized as a “crown witness” of CO2-induced climate change (Photo: Private)
The United Nations assumes that the CO2 emissions introduced into the atmosphere by humans are warming the climate due to a “greenhouse effect”. This greenhouse effect is said to endanger our existence. This thesis is propagated by its offshoot, the Intergovernmental Panel on Climate Change (IPCC), as irrefutable scientific truth. Claims to this effect are constantly repeated in countless scientific and journalistic publications. It is particularly emphasized that it is imperative to “recognize CO2 as the principal climate control knob” 1).
In the meantime, clever representatives of the “green” climate movement have ensured that this view has even been enshrined as an incontrovertible truth in supreme court rulings by the German Federal Constitutional Court and the European Court of Human Rights (ECtHR), among others.
Since this ruling, Germany is on a one-way highway to hell into an economic and social abyss. From now on all governments are obliged to reduce CO2 emissions to zero by 20453), regardless of the impact this has on the economy and the well-being of the population. Any fanatic NGO can sue the German state if it is not content with the reduction achieved. Worse still, the current greens, socialists and liberals government is already preparing further legislation to deny future governments any opportunity to revise this course again.
A law currently being prepared by (Liberal) Minister Buschmann is supposedly intended to “protect the constitutional court from undemocratic successor governments.” In reality, the new law will prevent even democratic majorities from overturning the Federal Constitutional Court ruling and the resulting regulations. Without any regard for the misery this will imply for the population.
Friedrich Merz and his conservative CDU have already signaled their support for this project.
How “healthy” were the Alpine glaciers from about 120,000 years ago until today. Over this time, the CO2 content fluctuated in a rather narrow range between 180 and 285 ppm, Figure 3.
Figure 3: The evolution of the CO2 content in the atmosphere over the last 120,000 years as determined by official climate science. The steep rise to today’s values only occurs abruptly at the very end of the graph. This extreme outlier is said to be causing a “glacial extinction” in the Alps (Graphic: author, with data from Our World in Data 6))
The evolution of CO2 levels shown in Figure 3 corresponds to what the IPCC calls the “stable pre-industrial state”, to which the German Federal Constitutional Court also refers in its “climate judgment”. In view of the fact that “climate science” describes the CO2 content of the atmosphere as the “decisive control knob for the climate”, the Alps should have had a stable climatic development and a correspondingly stable glacier cover before the start of significant human CO2 emissions.
When glaciers become climate crown witnesses
Fortunately, there is a very comprehensive study on the development of Alpine glaciers 7), in which their extent and mass were determined using complex simulation models. There is a corresponding short film on YouTube lasting approx. 2 minutes 8), which graphically summarizes the development of the last 120,000 years. Despite all reservations about such complex simulations, it should be noted that comprehensive geological and paleogeological studies of the entire Alpine region were used as “guard rails” for the stability of the models used. This also applies to the degree of correspondence between the end of the simulation run and the currently known state of the Alpine glaciers. Below are some still images from this video.
Figure 4: The current glaciation of the Alps. At this scale, significant glacier cover can only be seen around Mont Blanc and the Bernese Alps. At the bottom of the image, the temperature differences to today’s level (left scale axis) and the ice volume in cm sea level equivalent on the right scale can be seen in black (screenshot from https://www.youtube.com/watch?v=TXzExbdHuDM)
Figure 5: The ice cover of the Alps around 120,000 years ago, in the middle of the warm Eemian interglacial period (screenshot from https://www.youtube.com/watch?v=TXzExbdHuDM)
The comparison of Figures 4 and 5 shows that the ice cover of the Alps around 120,000 years ago was considerably less than it is today. This fact puts into perspective the terms “perpetual ice” and “dying glaciers” so often used today by the propagators of CO2 climate alarmism. At that time, the Eemian interglacial period 9) prevailed worldwide, one of the periodic warm interruptions of the ice ages that had prevailed for around 2.7 million years. It began around 126,000 years ago and lasted around 11,000 years. The temperature in Europe at that time was several degrees above the pre-industrial average temperature (until around 1850). During the entire Eemian period, the CO2 content of the atmosphere only fluctuated within a narrow range between 275 and 286 ppm. There is therefore no evidence of CO2 as the supposedly most important control knob for the climate in connection with the Eemian warm period and the subsequent glacial period.
The back and forth of the ice
The last glacial period was anything but uniform, quite the opposite. Both the temperatures and the ice volume fluctuated within wide limits, while the ice masses repeatedly buried and released enormous swathes of terrain, even outside the actual mountainous range. The following pictures give an impression of the occasionally extreme advances and retreats of the Alpine glaciers. The changing shoreline of the Adriatic Sea underscores that the sea level also fluctuated considerably during this time period.
Figure 6: Ice cover of the Alps at the beginning of the last glacial period 108760 years ago. Temperatures had already fallen by a full 10 °C compared to today and the Alpine region would have become uninhabitable (screenshot from https://www.youtube.com/watch?v=TXzExbdHuDM)
Figure 7: The glacial period was characterized by extreme swings in both directions. As the upper partial image shows, the ice cover had decreased considerably around 25,000 years after the beginning (Figure 6), and the temperature had risen by 6 °C compared to the previous stage. 17,000 years later, the Alpine region was suffocating under a gigantic ice sheet, and the temperature was 13 °C below today’s level. The northern Adriatic had almost disappeared from the map due to falling sea levels. (Screenshots from https://www.youtube.com/watch?v=TXzExbdHuDM)
Figure 8: After further extreme fluctuations, the ice masses advanced far in all directions at the peak of the glacial period about 24,500 years ago. In the north they advanced as far as Munich, and Zurich, Bern and Geneva disappeared under massive ice fields. Temperatures were 12 °C below today’s level, and the Adriatic Sea can only be glimpsed at the bottom right of the image. (Screenshot from https://www.youtube.com/watch?v=TXzExbdHuDM)
Figure 9: The end of the glacial period was anything but even too. After the glaciers had already melted quite extensively around the year 14,240 with comparatively mild temperatures (upper image), the glaciers expanded considerably again around 12,500 years ago and temperatures fell again by 7 °C below today’s level (screenshot from https://www.youtube.com/watch?v=TXzExbdHuDM).
Figure 10: The joint representation of atmospheric CO2 content and temperature development over the course of the last glaciation period shows that the correlation between the two variables appears to be rather weak. In particular, the explosive rise in the red curve at the very end raises doubts. The course of the CO2 concentration with temperature can easily be attributed to outgassing or absorption due to higher or lower solubility in the sea in line with Henry’s law. An industrial influence can be ruled out except for the last 150 years or so. (Graphic: author + screenshot from https://www.youtube.com/watch?v=TXzExbdHuDM)Figure 11: A closer look at the period of the last approx. 10,250 years – i.e. long after the end of the last glacial period and into the beginning of the industrial age (graphic: author + screenshot from https://www.youtube.com/watch?v=TXzExbdHuDM)
As shown in Figure 11, the average temperatures fluctuated considerably between the end of the last glacial period and the start of the industrial age. The range was between -4 and +3 °C compared to today’s average. In contrast, during this period, CO2 levels varied only within an extremely narrow range between 258 and 285 ppm. This does not really fit in with the purported correlation between CO2 and temperature, which has been declared an infallible truth by the highest German court. For comparison, here is another passage from the Federal Constitutional Court’s climate ruling:
“Up to what level and at what speed the temperature will continue to rise depends on the proportion of greenhouse gases in the atmosphere and thus largely on the amount of anthropogenically emitted greenhouse gases, especially CO2 emissions (IPCC, op. cit., pp. 17 f., 26). This is because there is an almost linear relationship between the total amount of greenhouse gases emitted and the rise in mean surface temperature (SRU, Demokratisch regieren in ökologischen Grenzen – Zur Legitimation von Umweltpolitik, Sondergutachten, 2019, p. 36)” (bold highlights added by the author).
History of Alpine glaciers does not support the CO2 greenhouse gas hypothesis
Climate science claims that there is a linear relationship between the CO2 content of the atmosphere, influenced by anthropogenic emissions of greenhouse gases, and temperatures on the Earth’s surface. The detailed investigation of the course of the last glacial period with regard to temperatures and ice cover in the Alps using complex simulations provides no evidence for this. Comparatively minor changes in CO2 levels in the atmosphere are probably due to temperature-related changes in the solubility of the gas in the oceans (Henry’s law).
The same applies to the period of the current warm period over the last 10,500 years or so. With comparatively stable CO2 levels, temperatures fluctuated within a range of -4 to +3 °C. The Alpine glaciers are therefore more like key evidence that the CO2 greenhouse gas hypothesis is treading on rather thin ice. Whatever it is that determines our climate, it is highly unlikely to be CO2!
Experts said that electric or hybrid cars were twice as likely to be involved in a road accident with a bystander than a petrol or diesel car over the same distance. The Telegraph has the story.
The researchers suggested the vehicles’ quieter engines were a significant factor in higher fatality rates and called on the Government to mitigate the risks as it phases out petrol and diesel cars in pursuit of net zero.
The study looked at the number of casualties from road collisions in Britain between 2013 and 2017 using Road Safety Data and calculated the number of pedestrians that had been hit by different types of cars.
Over the period, 96,285 pedestrians were hit by a car or taxi. While three-quarters of these people had been hit by a car with a combustion engine, this was because they covered significantly more miles.
Pedestrian casualties
To overcome this, the researchers calculated the rate of casualties per 100 million miles covered by electric and hybrid cars compared with petrol and diesel cars.
They found that 5.16 people on average were hit by an electric or hybrid car for every 100 million miles that type of vehicle had driven, compared with 2.4 people for petrol and diesel cars.
The road accident data were cross-referenced with annual mileage figures from the National Travel Survey, with 32 billion miles of electric and hybrid vehicle travel and three trillion miles of petrol and diesel vehicle travel included in the analysis.


You must be logged in to post a comment.