Global warming, climate change, all these things are just a dream come true for politicians. I deal with evidence and not with frightening computer models because the seeker after truth does not put his faith in any consensus. The road to the truth is long and hard, but this is the road we must follow. People who describe the unprecedented comfort and ease of modern life as a climate disaster, in my opinion have no idea what a real problem is.
We humans dream of colonizing Mars, building flying cars, and achieving immortality. Yet, amidst this fervent pursuit of futures that sometimes drift into fantasy, we’re neglecting critical problems of the present.
We humans dream of colonizing Mars, building flying cars, and achieving immortality. Yet, amidst this fervent pursuit of futures that sometimes drift into fantasy, we’re neglecting critical problems of the present.
An example is rampant pollution of our waters. This neglect exists even in advanced societies such as the United Kingdom, where untreated sewage spills into the Thames and other rivers, turning them into fetid cesspools.
This isn’t some dystopian vision of the future. It’s happening right now, under the noses of complacent governments and a distracted public. While headlines scream about a fabricated climate emergency decades away, actual environmental crises fester — not to mention potholed streets and collapsing bridges.
Thames filled with Sewage: A Global Problem
The U.K.’s aging sewage infrastructure simply can’t handle the demands of a growing population. During heavy rain, overflows release raw sewage directly into rivers. Recent findings suggest that since 2020, Thames Water—the U.K.’s largest water and wastewater services company—has discharged a minimum of 72 billion liters of sewage into the river Thames, equivalent to approximately 29,000 Olympic swimming pools of water.
In 2024, the company was fined 3.3 million pounds after causing the death of over 1,400 fish with the release of millions of liters of untreated sewage. Despite these incidents, Thames Water continues to discharge sewage into bodies of water.
Numerous images and videos shared on social media depict holidaymakers witnessing the presence of brown-colored sewage-contaminated waters along beaches and river banks in the U.K.
The neglect of river pollution has dire consequences for public health from a range of waterborne diseases, including cholera, dysentery and hepatitis A. The presence of harmful bacteria such as E. coli in rivers and coastal waters poses a direct threat to communities that rely on these sources for drinking, bathing and recreation. In fact, recently, thousands of people fell ill with diarrhoea as they ingested parasites from contaminated water in Devon, U.K.
In Bangladesh, the Buriganga and linked rivers in the country’s capital region receive daily about 60,000 cubic meters of wastes from the nine major industrial clusters. The river is so toxic that locals consider it biologically dead.
In New Delhi, the capital of India, the Yamuna River has been heavily affected by the disposal of harmful chemicals and untreated sewage. As a result, certain parts of the river exhibit a murky appearance, with foamy froth and plastic waste along its banks. Another river in India, the Ganges, is one of the world’s most polluted, receiving every day more than one billion gallons of raw sewage and industrial waste.
The problem is not exclusive to these countries. The list goes on and on. But the elephant in the room is the fact that these nations have allocated billions of dollars towards initiatives aimed at curbing greenhouse gas emissions—an endeavor that remains scientifically unjustified.
The U.K. has been vocal about it’s desires to implement net zero—an amorphous term used to denote zero greenhouse gas emissions from human activity. India is spending billions on wind and solar, and even Bangladesh has been waxing eloquent on the subject, launching its first ever Climate Action Plan.
Net zero will have zero effect on the climate and threatens devasting consequences for the supply of affordable and reliable electricity. Net zero is perhaps the most futile initiative mankind has ever undertaken and certainly the most expensive. Pouring trillions of funds annually into managing an uncontrollable climate is utterly ridiculous.
Instead of addressing pressing environmental issues such as river pollution, governments are misdirecting resources and energy in response to unsubstantiated claims like the climate crisis.
More people will die from real environmental problems than from the climate in 2050, whether it’s warmer or colder. We need to move beyond attention-grabbing headlines about distant imaginary threats and focus on actual ones.
This commentary was first published at California Globeon May 20, 2024.
Vijay Jayaraj is a Research Associate at the CO2 Coalition, Arlington, Virginia. He holds a master’s degree in environmental sciences from the University of East Anglia, U.K.
The paper examines the influences of Atlantic Multidecadal Variability (AMV) on global tropical cyclones (TCs)
The north Atlantic undergoes approximately 60-year cycles of warmer and colder than normal sea surface temperatures. These changes in thermal surface energy play a role on modulating climate globally, especially in combination with other oceanic cycles.
Compared to the AMV negative phases, the AMV positive phase “significantly increases tropical cyclone frequency in the North Atlantic, including those making landfalls,” The authors found. “The increase is explained by warmer sea surface temperature, higher relative humidity, increased relative vorticity, and weaker vertical wind shear under the AMV positive phase.”
“By contrast, AMV positive phase decreases TC occurrence over the western North Pacific and South Pacific, which is tied to stronger vertical wind shear and lower relative humidity. The opposite responses of TC activity to AMV positive are attributed to strengthened Walker Circulation between the Atlantic and Pacific.”
Under CO2 science, alarmists like to claim that tropical storms frequency is simply trending up and up due to manmade CO2 warming. But in fact, tropical storm frequency is far more linked to oceanic cycles.
The key points of Huang et al 2023:
So the next time we get an active tropical cyclone season, you’ll know that it has more to do with natural oceanic cycles, which we are unable to control, and it all has little to do with CO2 emissions which the media like to hype up.
If aliens in spaceships saw our world, they wouldn’t name it “Earth”.
They’d name it “Water” because that’s what makes up more than 70% of the surface. And it’s also what controls the climate.
A couple days ago I stumbled across something I’d been trying to find for a while, a longer-term gridded global rainfall dataset. I finally located one at the Copernicus website. It runs from 1979 to December 2021. Here’s the global average rainfall from that site.
Figure 1. Annual average rainfall, 1979-2021
This shows some interesting aspects. The endless rainstorms of the intertropical convergence zone (ITCZ) are seen as the blue band above the Equator. The Pacific Warm Pool is marked by the blue blob of heavy rain north of Australia.
A short digression. The current central paradigm of mainstream climate science is that the change in global temperature is a lagged linear function of the change in total downwelling solar and longwave (thermal) radiation. In other words, forcing (which in the climate world generally means changes in downwelling radiation, hey, don’t blame me, I didn’t invent the term) rules temperature, and everything else averages out.
I hold a different view. I hold that a variety of emergent climate phenomena act in various ways, places, and times to thermoregulate the climate. One of the strongest of these phenomena is the daily emergence of tropical thunderstorms. When ocean temperatures exceed some local limit, thunderstorms form, rain falls, and the surface is cooled. As a result, in the current generally warming climate, we should expect an increase in tropical thunderstorms.
To investigate this prediction, I took a look at the rainfall trends. Figure 2 shows those, in millimeters per decade. Blue is getting wetter, and red is drying.
Figure 2. Rainfall trends, 1° latitude x 1° longitude gridcells.
As my theory would predict, the warming is leading to increased rainfall over the Pacific Warm Pool and around the Intertropical Convergence Zone.
However, the reason that I was looking for the rainfall dataset was not for the rain per se. It was because the rain is a measure of the evaporative cooling of the surface. The global average rainfall is about one meter per year. It takes ~ 80 watts per square meter (W/m2) of radiation over a one year period to evaporate one meter of seawater. In addition, there’s a cooling of another ~ 2.5 W/m2 due to the cold rain falling on the surface.
This means that globally, rainfall directly cools the surface by ~ 82 W/m2.
What I didn’t know until I got the Copernicus rainfall dataset was how that cooling is distributed around the planet. Here’s a view of that. Of course, it looks like Figure 1, only with different units.
Figure 3. Average ongoing cooling from rainfall, 1979-2021
The cooling is centered over the Pacific Warm Pool in the western Pacific. This is the warmest open ocean area. It’s well known that the average temperature of the Pacific Warm Pool never gets warmer than about ~ 30°C … and clearly, the 250+ W/m2 cooling of the warm pool due to rain is among the reasons.
Now, I wanted this information because it is a main part of the effect of clouds on temperature. The other main part is the separate and independent effect of the clouds on total radiation hitting the surface. Clouds warm some parts of the planet and cool others, by a combination of cooling by reflecting sunshine and warming by increased downwelling longwave radiation. Overall, these changes in radiation due to clouds cool the planet by about ~ 20 W/m2. Here’s how that is distributed around the planet.
Figure 3. Average ongoing cooling and warming from the cloud radiative effect, 2000-2023
Note the spatial similarity between the surface cloud radiative effect and the cooling due to the rainfall. No surprise there.
Note also the system’s efficiency—the clouds’ cooling effects (rainfall + radiation) are focused on the warmest areas. And this is true at both the local and the global scale—thunderstorms form preferentially over local surface hot spots. This gives the most cooling for the smallest effort.
Adding these two different cloud effects together gives us a measure of most of the effect of clouds on the surface temperature. I say “most of” because there are some other cooling effects. These include:
Snow, sleet, hail, and graupel. Since these are frozen, there’s additional surface cooling from the melting of the ice.
Clear dry descending air around thunderstorms. Because most of the water as well as most of the aerosols have been stripped out of the air by rainfall, there’s far less water vapor and aerosols to absorb radiation leaving the surface. This allows for greater surface radiation making it to space, cooling the surface.
A cold wind from the condensation level of the atmosphere is entrained by the falling rain and hits the surface vertically. This wind then spreads out when it hits the surface, cooling a much larger surface area around each rain cloud.
Setting those other cooling effects aside for the moment, here’s the distribution of total cloud cooling (radiative plus rainfall) around the planet.
Figure 4. Full effect of clouds on the surface temperature
Note that rather than the ~ -20 W/m2 cooling from just the radiative effects of the clouds, the true effect of the clouds is about 100 W/m2, and there are large areas where the cooling exceeds -300 W/m2.
Next, we can take a look at the relationship between total cloud cooling (radiative plus rainfall) and surface temperature. This is clearest over the 70% of the surface that is water. Here’s that relationship.
Figure 5. Scatterplot, total cloud cooling (rainfall plus radiation) versus sea surface temperature. Each blue dot is a 1° latitude by 1° longitude area of the ocean surface.
This is exactly the shape we’d expect to see in a thermoregulatory system. As the sea surface temperature increases, the total cloud cooling reduces … but only up to about 26°C. Above that, the cloud cooling increases very rapidly, quickly becoming around -300 to -400 W/m2 of cooling as the sea surface temperature gets up close to ~ 30°C.
Now, the yellow line in Figure 5 shows the slope of the cloud cooling/temperature relationship, which is how much the cloud cooling changes for every 1°C of surface warming. And over at the right of Figure 5, that slope is ~ -100 to ~ -150 W/m2 of increased cooling for every 1°C of surface warming.
In closing, let me note that since 1950, CO2 has theoretically increased downwelling radiation by something on the order of 1.4 W/m2 … and that would be totally undone by a mere 1.4% increase in cloud cooling. In that context, bear in mind that global cloud cooling changes by up to 9% from one month to the next, and we never even notice …
[CODA] The important thing about cloud cooling is that it is temperature-controlled. It has nothing to do with forcing. When tropical sea surface temperatures go above about 26°C, it rains, regardless of the forcing. Period. See below.
Figure 6. Pacific equatorial rainfall, 5° north to 5° south.
My regards to all, and remember—rather than cursing the storm, learn to dance in the rain …
w.
As Always: Please quote the exact words you are discussing. It avoids endless arguments. And me, I’m going to be in town today when this publishes, so play fair, no eye gouging, and may the best wo/man win …
Why you should embrace using cold water, almost all the time – Heating water gobbles energy, leading to higher utility bills and more planet-warming emissions.
Why you should embrace using cold water, almost all the time – Heating water gobbles energy, leading to higher utility bills and more planet-warming emissions.
By Allyson Chiu – Allyson Chiu is a reporter focusing on climate solutions for The Washington Post.
Excerpts: You may not be giving a second thought to setting your washing machine on the hot cycle, cranking your showers to a steamy temperature or scrubbing your dirty dishes under a stream of scalding water. … While there are home improvements that can help you cut back on the energy it takes to heat water, including installing a heat pump water heater, one easy solution is to switch to cold water.
Showering accounts for roughly 17 percent of the water Americans use in their homes, according to the Environmental Protection Agency. Your steamy showers also consume energy: Nearly half of a home’s hot water is used for bathing. A cold shower uses less energy than a hot one.
Jennifer Amann, senior fellow in the buildings program at the American Council for an Energy-Efficient Economy, a nonprofit group, said letting the tap run while you’re waiting for water to heat up results in water waste. She suggested that people think about how to minimize that.
“If you’re wasting cold water to get your hot water, then you’re really wasting both water and the energy resources,” she said. “Those energy resources still come largely from fossil fuels, and so they’re adding to emissions in the environment at a time when we really need to be doing everything we can to reduce carbon emissions.”
You should also rethink washing your hands with hot or warm water for the same reason, she added.
What drives climate change? Is it the anthropogenic emissions of CO2 and other greenhouse gases [GHG], as the established climate science and the IPCC claims with its GHG forcer hypothesis?
Or is it the natural variations in heat transport to the polar regions during winter, as the new “Winter Gate-keeper hypothesis” [WGH] claims?
What drives climate change? Is it the anthropogenic emissions of CO2 and other greenhouse gases [GHG], as the established climate science and the IPCC claims with its GHG forcer hypothesis? Or is it the natural variations in heat transport to the polar regions during winter, as the new “Winter Gate-keeper hypothesis” [WGH] claims?
The WGH asserts to be a general hypothesis for climate change, fully capable of explaining historical climate change, as well as current changes, and with explicit forecasts for our future climate. In these respects, it compares itself with the established IPCC hypothesis of climate change being driven by anthropogenic GHG emissions. The WGH is fully described in two recently published books, and has also been explained in some detail here at WUWT by its originator Javier Vinós (here, here, here), and also by Andy May (here, here).[1][2]
The WGH introduces a novel climate-forcing mechanism by proposing that changes in poleward heat transport can strongly influence climate. As the planet Earth has two such polar regions, we have one in cold season during most of the year. Temporally, planet Earth has two peaks of energy loss to space. They are when each of the polar areas is dark and cools by radiating more during the polar winter.
The two polar regions have little incoming solar energy and the green-house effect is also very small, especially during the polar winter. If, e.g., more energy would be transported polewards, we’d get a higher loss of energy at the top of atmosphere (ToA), without any compensating gain elsewhere. The energy flux of the planet would be altered by that change in transport.
Of specific significance is the regulation of the heat transport into the Arctic. The highest loss of energy is during the dark Arctic winter. Between November and February, the planet emits more energy than at any other time. It’s a complex mechanism, where five different “gate-keepers” influence the climate via the polar vortex, thus regulating meridional heat transport. This mechanism affects the radiative flux at the ToA, which changes the energy content of the entire climate system.
The WGH is a unified hypothesis that builds on a multitude of established theories regarding its contributing processes. An attempt at “definition” of the WGH by its creator formulates a whole range of testable claims:
“The Winter Gatekeeper hypothesis proposes that changes in the heat and moisture that reach the polar regions during winter, particularly the Arctic, play a major role in climate change. This is because the winter polar regions have a very low greenhouse effect due to the lack of atmospheric water vapor, the Earth’s main GHG. Combined with the lack of solar radiation, this leads to an effective loss of energy to space through outgoing infrared radiation.
Consequently, changes in the transport of heat to the polar regions during winter have an impact on the energy budget of the planet. The Arctic is particularly important in WGH because its weaker polar vortex allows for greater variations in heat transport.
Any factor that affects the atmospheric zonal circulation, the generation and propagation of planetary waves, or the strength of the polar vortex acts as a vortex gatekeeper capable of regulating the transport of heat to the Arctic during winter. These gatekeepers include theQuasi-Biennial Oscillation, El Niño-Southern Oscillation, volcanic eruptions, multi-decadal ocean oscillations(modes of variability), andsolar activity. […] The climate exhibits decades-long heat transport regimes, separated by abrupt shifts.”([2], pages 408f and 533, my emph.)
In this, and following posts I will analyze the bolded claims regarding heat transport by looking at climate data with a focus on the warming Arctic, since WGH gives the Arctic a defining role in climate change processes. Actually, the Arctic is a focal point for both the two competing hypotheses about climate change.
The Arctic has been warming almost four times faster than the global average since around 1990.[3]The established climate science (IPCC) essentially explains the warming in the Arctic with the greenhouse effect and has given it its own name: “Arctic Amplification” [AA]. The IPCC claims that 50-70 percent of the AA is caused by the increased amount of anthropogenic GHG in the atmosphere (emissions of CO2 etc.).[4] These increase the green house effect, which is assumed to cause the large temperature increase in the Arctic in winter. However, they neither provide any coherent theory how this happens, nor an explanation of the timing of the AA.
The WGH rejects the IPCC hypothesis. Instead, it claims that changes in energy flows into the Arctic are fundamental to explain the increasing temperatures there. It asks: From where comes all the additional energy that makes the Arctic winter temperature rise so sharply?
Watts in must correspond to watts out
The climate is constantly striving for a basic energy balance: the solar energy coming in must be balanced by an (approximately) equal amount of thermal energy radiating out – globally: Watts in must correspond to watts out.This has to be true as a global average, but spatially and temporally it is never met. See the animation below with the monthly sequence of the radiation balance, from January to December.
Figure 1. ToA radiation balance month by month. The animation shows the net energy exported or imported per gridcell, 1°x1°, average value per month, 2000 – 2023. Data from Ceres.
All this temporal and spatial flux is naturally driven by the Earth’s and the Sun’s various diurnal and seasonal cycles and other interactions. In spite of all the flux, there is a global balance. How is it achieved?
The Sun doesn’t shine in the polar regions during the winter polar night, thus no heat is provided from space. The main source for the outgoing radiation is the energy transported there from the tropics. The Sun irradiates so much into the tropics that it cannot all be efficiently radiated back to space. The energy is therefore transported away – advected – to the regions where it more easily can radiate to space. The resulting polewards transport of energy is achieved by advection of heat and moisture via atmospheric weather systems, and to a smaller degree by ocean currents:[5][6]
Figure 2. The polar regions radiate a lot of energy to space. To cover the huge deficits, energy is transported there from the tropics, mainly in the atmosphere.
Let’s look at the the global radiation (im)balance for one month, calculated as the net incoming solar energy (solar irradiation minus reflected SW radiation) minus outgoing LW radiation (OLR) at the Top of the Atmospere (ToA). Here’s June:
Figur 3A. ToA radiation balance in the months of June. The figure shows the net energy exported or imported per gridcell, 1°x1°. Average for all June months, 2000 – 2023. Horizontal line indicates 70°N. Data from Ceres.
In June, the maximum of solar irradiation is in the northern parts of the tropics. These parts absorb much more heat than they radiate to space, as shown by the orange and red areas. The highest levels are reached over the oceans, where humidity is high. We can also note the effect of the very dry atmosphere over desert regions in e.g. Sahara.
Some of the absorbed heat is converted into kinetic energyin weather systems. These do the job of moving the heat from the tropics to the polar regions. Solar heat accumulated in the tropics (positive values; shown in green/yellow/red colors) is thus transported polewards, where it is radiated into space (negative values; in grey/ blue/black).
The northern hemisphere up to the Arctic (except Greenland) has a positive energy balance during summer. In other words, we have a surplus of incoming solar radiation minus what is radiated back into space. But even in the summer month of June, the Arctic north of 70° latitude has a negative net radiation of energy, as seen in the figure.
In the Southern Hemisphere, it is winter in June and Antarctica is in the polar night. No solar energy comes in. To the north of Antarctica is the Southern Ocean, where the energy balance is maximally negative with up to 200 watts per m2 radiated into space (the black areas in the figure).
For the climate, water is the only significant energy carrier. The reason why most of the energy is emitted over the ocean is that the humidity is high there, so more energy is available. Energy is mainly transported by water vapor in the atmospheric weather systems. Over continental Antarctica, however, the air is extremely dry and only a fraction of the energy is available compared to the Southern ocean. This also applies to Greenland.
In December, six months later, the figure is reversed. We now have a huge wintertime radiation deficit in the Arctic, as seen by the negative values reaching almost -200 W/m2 there. That is balanced by a large surplus, mainly in the southern tropics:
Figur 3B. Top-of-atmosphere (ToA) radiation balance in the months of December. The figure shows the net energy exported or imported per gridcell, 1°x1°. Horizontal line indicates 70°N. Data from Ceres.
Researchers have since long established the negative energy budgets for the polar regions.[7] The current average yearly heat loss in the Arctic is 114W/m2, with up to 200 W/m2 lost in the winter. This strongly negative radiation budget is a result of the dryness of the atmosphere and a very small greenhouse effect. The negative energy budget is much more pronounced in the middle of winter (fig. 3B) but applies all year round, as seen in the animation in figure 1. Three questions arise:
1. How to account for the heat that is radiated to space from the Arctic?
If we look at the Northern Hemisphere south of the Arctic, we see that the average radiation balance is almost 9W/m2 for the latitudes up to 70°N:
Figure 4. Radiation balance for the Northern Hemisphere up to the Arctic (70°N), calculated as the net incoming solar energy (solar irradiation minus reflected SW radiation) minus outgoing LW radiation (OLR) at ToA. Data from Ceres.
This excess net energy originates in the tropics and advects polewards with the weather systems via the Hadley and Ferrell cells. The amount of energy advected from the southern latitudes into the Arctic is of similar size to what is radiated from the Arctic (2.1 PW compared to 1.8 PW, as yearly averages according to the radiation data).[6][8]
Another, much smaller source of energy is latent heat released as the summer meltwater freezes. As fall transitions to winter, the Arctic cools. When the surface freezes, the latent heat stored in the water since the previous spring thaw is released. [6]
During the summer months, the Arctic energy balance is around zero as seen in figure 3A. Incoming net solar is balanced by an equally large OLR.
2. How do we know that the energy directed towards the polar regions is actually radiated out into space?
The surface in the Arctic is covered with ice and snow most of the year. Ice and especially snow have low thermal conductivities. The small energy flow through ice is also always from the warmer ocean below the ice to the colder air above the ice. Most of the net energy coming to the Arctic via the atmosphere will thus be radiated to space. Except for a few summer months with open water no significant amount of energy from the ocean can contribute to the radiation at ToA. During summer, a lot of energy is also spent on melting ice and snow. That latent heat is later released as the freeze sets in. The net energy from this cycle balances around zero on a yearly basis. [7]
3.Do changes in the energy transport coincide with the onset of AA?
The export of net energy from the tropics has a positive trend since around 2000, see figure 4. The intensity of the tropical Hadley cells have increased, and they have also significantly expanded polewards since 1997.[9] Also the Ferrel cells show similar increases.[10] The ocean also contributed to the Arctic with a net step change in 1997.[11]
The increase in net heat transport to the Arctic shown in figure 4 is almost 2 W/m2 since 2000. This is distributed between increased radiation to space and increased downward longwave radiation that warms the surface.
The outgoing heat radiation (OLR) from the Arctic is currently around 197 W/m2. The OLR has been increasing significantly with around 4 w/m2 since 1990, when the AA started, wherof around 2 W/m2 since 2000:
Figure 5. Outgoing LW radiation from the Arctic (70-90°N), seasonally adjusted monthly data from 1979 – 2023. An increase in OLR reflects warming and that more energy is lost to space. Brown curve is Loess mean, shown with confidence interval (2σ). Data source here.
The energy transported to the polar regions has clearly increased over time, which has helped to increase the energy lost via AA. The result is a planetary cooling effect.
We thus have the answer both as to the amount, and the timing of AA: the increase in OLR in figure 5 in the 1990/2010 timeframe corresponds quantitatively with the increase in advected heat from the south. The data and the science fully support the Winter Gate-keeper hypothesis in this respect.
The second round brings up the topic ofclimate shifts.
References
[1] Vinós, Javier, Climate of the Past, Present and Future: A scientific debate, 2nd ed., Critical Science Press, 2022.
[2] Vinós, Javier. Solving the Climate Puzzle: The Sun’s Surprising Role, Critical Science Press, 2023.
[4] IPCC AR6 WG1, chapter 9, see e.g. figure 9.14https://www.ipcc.ch/report/ar6/wg1/chapter/chapter-9/ Forthcoming posts will analyze the greenhouse effect in the Arctic in more detail, as well as IPCC’s explanation for AA.
[7] Peixoto, J.P. & Oort, A.H., 1992. Physics of climate. New York: American Institute of Physics. pp.353–364.
[8] Heat Transport Compensation in Atmosphere and Ocean over the Past 22 000 Years, Yangand 5 co-authors, Nature 2015, https://doi.org/10.1038/srep16661
[10] Contributions of the Hadley and Ferrel Circulations to the Energetics of the Atmosphere over the Past 32 Years, Huang and McElroy, AMS 2014, https://doi.org/10.1175/JCLI-D-13-00538.1
[11] Increased ocean heat transport into the Nordic Seas and Arctic Ocean over the period 1993–2016, Tsubouchi and 7 co-authors, Nature 2021, https://doi.org/10.1038/s41558-020-00941-3
Technical note
It’s not an easy task to knead the satellite data files so that you can select and plot the data the way you want. This note is to help others with a guidance as to which softwares and methods are workable, reliable, and accessible without too much programming. I first download data in the NetCDF4 format, e.g. from Ceres. The data are then preprocessed in the program CDO (Climate Data Operators) in Linux (in my case Ubuntu under Windows). All the time series data are calculated as surface-weighted monthly values in CDO. (I highly recommend preprocessing data in CDO rather than attempting it in R or Python, as the command line operated CDO is very efficient, fast, and reliable.) After preprocessing, the selected data in the resulting .nc files were read into R/Rstudio where the figures were created with GGplot. The raster map plots were created with tidyterra:SpatRaster. All data and software are free to use/open source.
Gabriel Oxenstierna is a PhD at Stockholm University and one of the Clintel signatories.
The photo illustrating WGH in the vignette is the GateKeeper roller coaster.
If in doubt, attribute a quote to Churchill because he probably did say it at one time or another. It’s certainly been stolen many times over, and the mainstream media, BBC, Sky et al. have declared an emergency, broken the glass and pulled the dusty old axiom out of its case as the pictures of bloodied passengers and crew – pure gold to the climate catastrophisers – came in yesterday after the Singapore Airlines accident over Myanmar (Burma in old money). For aircraft accident it was, and as, sadly, a death was involved, and several severe injuries, this is how it will be treated by the Singapore aviation authorities. They are nothing if not thorough there and eventually the exact truth of the sequence of events will come out, but by then the caravanserai of the chattering classes will have emptied and the climate caravan will be somewhere, anywhere else. They only need to borrow the truth for a day or two, they don’t need to own it.
A troublesome incident for sure. A ‘perfect storm’ of events seems to have come together. Geographically, Singapore Airlines flight SQ321 was nearing the end of its journey from London and the passengers were being served ‘breakfast’, or whatever meals are called where local time has overtaken stomach expectations. Trollies were out, galleys were stacked with the detritus of 300-odd meals, and passengers were queuing for the loos to freshen up before the arrival into Singapore. All so normal.
It was approaching mid-afternoon local time, and it’s Monsoon season in that part of the world. Time for the thunderclouds to be developing. Happens every year at this time. Has to happen or it’s a crisis for farmers, fishermen and the local economies around the Bay of Bengal. Yes, if the Monsoon is a bit too vigorous places like Bangladesh suffer loss of life with floods, but sadly, t’was ever thus. It’s no coincidence that if the Monsoon is too (un)damp a squib, then it is described as ‘failed’. It’s that important and has been over the centuries.
It does bring in its wake what the met men describe as ‘chaotic skies’. Clouds everywhere at every level, biblical thunderstorms with electrical activity – and yet hundreds of aircraft full of passengers daily pick their delicate way through the Monsoon without serious incident.
It’s been happening like this since Ponticus was a pilot, as they say. I’ve been navigating these skies since I started commercial flying when I was 20. I learned from the old China-Hands who did it in the early days of what we would today recognise as perfectly normal aviation, not overflying most of the weather, but actually picking their way through it at dead of night with only rudimentary weather warning radar. The already red cockpit lighting turned right down to almost nothing so they could stare out into the night and try to spot the cumulonimbus with their name on it. The Flight Engineer would use a small torch to read the engine instruments so as not to disturb the pilot’s night vision. It was part of the job then. The old captains would joke that it was worse when they were doing this to spot a night fighter that would spoil their evenings more surely than any bloody fluffy white cloud. Yet they (and we) had the greatest of respect for the forces of Mother Nature, then and now. A night fighter will fill your aircraft and possibly you with holes. A cumulonimbus can take hold of you and rip you up like a paper aeroplane.
Planes are stronger now 50 years on, but pilots’ respect for weather ‘events’ remains as ever. The generally troubled atmosphere surrounding the Monsoon also leads to clear air turbulence which, as yesterday proved, can be just as nasty. It occurs when two air masses rub against each other, thrown together by the progress of the monsoon. Think a ship docking, and slightly overcooking its approach to the quay. The bang and shudder as the irresistible force meets the immovable object. Two air masses do the same, but they’re more difficult to spot and therefore prepare for. It’s similar on the North Atlantic. The famous jet streams are separate fast moving tubes of air which similarly rub up against the surrounding air mass and where they meet turbulence occurs. Always has. They tend to lie along the coastlines of New England and up into the Maritimes of Canada, especially in winter. I remember doing this route regularly in the 1970s and getting tossed around in my 707 mercilessly. I was convinced then that it got worse there annually. It didn’t and a decade later it settled down. Apparently sun-spot activity was very high around then, and there was the odd speculation that this may be linked to rougher winds on the North Atlantic. Nothing was proved and life went on. Grumbling, and slightly queasily we made our way back to Europe. Nobody thought of asking the politicians to alter the weather for us. No cult grew up around what was thought to be happening, organised by people it wasn’t happening to. No human sacrifices were made to placate the gods of wind. But, then there was no money sloshing around either. It was enough that we were understanding more about how things were happening, where they were likely to be happening, and the best way to avoid the worst whilst carrying on the essential task of living a normal life. We knew our limitations and inadequacies when dealing with Mother Nature. The thought of a character assassination of MN herself, or that it might be somehow ‘our fault’ would be enough to get you booted out of a position of responsibility. Now it’s the other way round, and only my generation who form a bridge between now and the sane 70s can recognise the huge gulf in attitudes. Two masses of thinking rubbing up against each other causing what seems to be catastrophic turbulence in mankind itself.
Back to Singapore. It’s very doubtful if a big nasty cloud caused the incident. They’re too easy to spot nowadays with sophisticated airborne weather radars. Clear air turbulence – not so easy. It can be and is forecast in the preflight met briefings. Only as a likelihood, though, not as a certainty nor in any one specific place. Occasionally there may be seat-of-the-pants warning. A slight rumble. A tremble going through the aircraft. That’s a signal to start monitoring the outside air temperature, the wind readouts and the skies ahead for slight changes to cloud patterns. I’ve erred on the side of safety enough in the past to annoy the cabin crew by warning them that it might get a bit bumpy soon. This throws their routine out of kilter, and they may decide to stop serving ‘hots’, and start gathering trays in. Anything more than a hunch and I’d tell them to secure the cabin, seat belt signs on, and if it’s getting really bad to sit themselves down and strap in immediately. There will be a mess to clear up after, but hopefully no injuries. Make an announcement to the passengers in best ‘resigned to inconvenience’ pilot voice to the passengers that it may be about to feel uncomfortable for a bit, but having been here many times before I know it won’t last for very long. That last bit is important. We’ve all been here before and lived to tell the tale.
Very rarely there is almost no discernible warning and it’s seatbelt signs on, PA to the cabin crew to be seated and hope that nothing flies around the cabin. Slow the plane down a bit, get on to ATC to request an altitude change as turbulent layers are shallow and a five or six thousand feet change in cruising level can help enormously.
The latter is what seems to have happened to SQ yesterday. No warning, a quick change of height authorised and sadly the damage control begun.
As I said, t’was ever thus. No change. The truth is out there, and it will come with the Singapore inquiry months down the line when it will only merit a brief mention in the mainstream media. They will be after another shibboleth by then.
James Leary is the pseudonym of a retired B747Captain.
Previously I have demonstrated that changes in atmospheric CO2 levels follow changes in Global Mean Temperatures (GMT) as shown by satellite measurements from University of Alabama at Huntsville (UAH).
Previously I have demonstrated that changes in atmospheric CO2 levels follow changes in Global Mean Temperatures (GMT) as shown by satellite measurements from University of Alabama at Huntsville (UAH). That background post is reprinted later below.
My curiosity was piqued by the remarkable GMT spike starting in January 2023 and rising through April 2024, the monthly anomaly increasing from -0.04C to +1.05C last month. The chart above shows the two monthly datasets: CO2 levels in blue reported at Mauna Loa, and Global temperature anomalies reported by UAH, both up to April 2024. Would such a sharp increase in temperature be reflected in rising CO2 levels, according to the successful mathematical forecasting model?
The answer is yes: that temperature spike results in a corresponding CO2 spike as expected.
Above are UAH temperature anomalies compared to CO2 monthly changes year over year.
Changes in monthly CO2 synchronize with temperature fluctuations, which for UAH are anomalies now referenced to the 1991-2020 period. CO2 differentials are calculated for the present month by subtracting the value for the same month in the previous year (for example April 2024 minus April 2023). Temp anomalies are calculated by comparing the present month with the baseline month. Note the recent CO2 upward spike following the temperature spike.
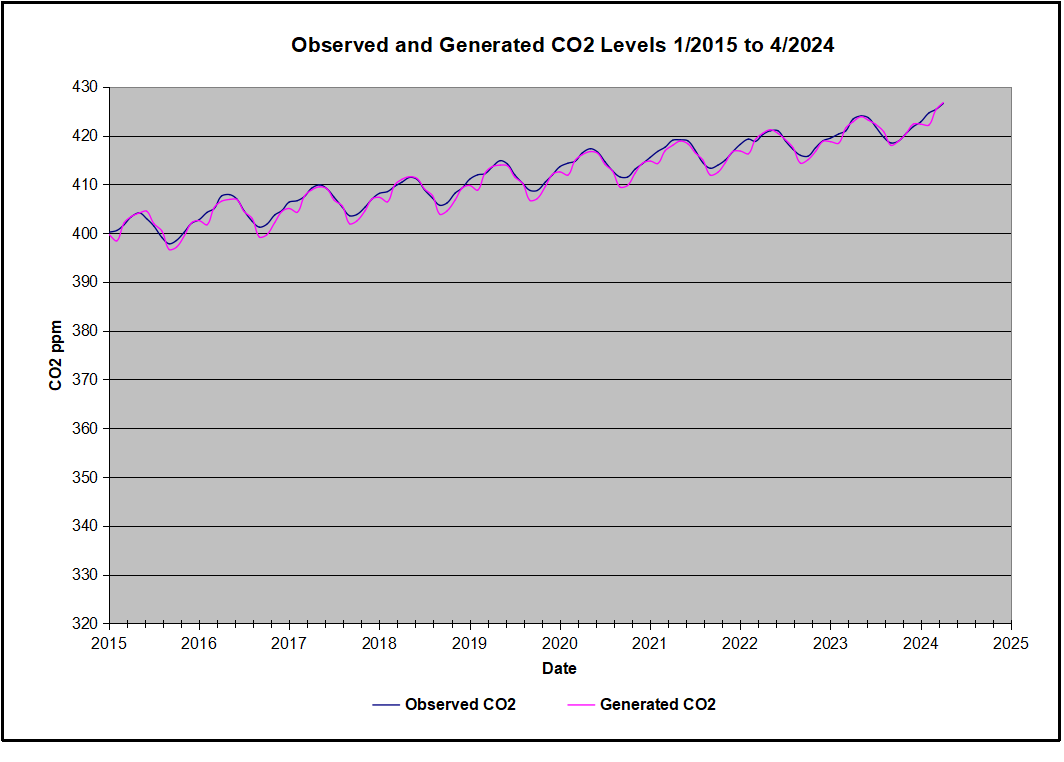
The final proof that CO2 follows temperature due to stimulation of natural CO2 reservoirs is demonstrated by the ability to calculate CO2 levels since 1979 with a simple mathematical formula:
For each subsequent year, the co2 level for each month was generated
CO2 this month this year = a + b × Temp this month this year + CO2 this month last year
The values for a and b are constants applied to all monthly temps, and are chosen to scale the forecasted CO2 level for comparison with the observed value. Here is the result of those calculations.
In the chart calculated CO2 levels correlate with observed CO2 levels at 0.9987 out of 1.0000. This mathematical generation of CO2 atmospheric levels is only possible if they are driven by temperature-dependent natural sources, and not by human emissions which are small in comparison, rise steadily and monotonically. For a more detailed look at the recent fluxes, here are the results since 2015, an ENSO neutral year.
For this recent period, the calculated CO2 values match the annual peaks, while some annual generated minimums of CO2 are slightly lower than those observed at that time of year, which tends to be Sept.-Nov. Still the correlation for this period is 0.9913.
Key Point
Changes in CO2 follow changes in global temperatures on all time scales, from last month’s observations to ice core datasets spanning millenia. Since CO2 is the lagging variable, it cannot logically be the cause of temperature, the leading variable. It is folly to imagine that by reducing human emissions of CO2, we can change global temperatures, which are obviously driven by other factors.
Background Post Temperature Changes Cause CO2 Changes, Not the Reverse
This post is about proving that CO2 changes in response to temperature changes, not the other way around, as is often claimed. In order to do that we need two datasets: one for measurements of changes in atmospheric CO2 concentrations over time and one for estimates of Global Mean Temperature changes over time.
Climate science is unsettling because past data are not fixed, but change later on. I ran into this previously and now again in 2021 and 2022 when I set out to update an analysis done in 2014 by Jeremy Shiers (discussed in a previous post reprinted at the end). Jeremy provided a spreadsheet in his essay Murray Salby Showed CO2 Follows Temperature Now You Can Too posted in January 2014. I downloaded his spreadsheet intending to bring the analysis up to the present to see if the results hold up. The two sources of data were:
Uploading the CO2 dataset showed that many numbers had changed (why?).
The blue line shows annual observed differences in monthly values year over year, e.g. June 2020 minus June 2019 etc. The first 12 months (1979) provide the observed starting values from which differentials are calculated. The orange line shows those CO2 values changed slightly in the 2020 dataset vs. the 2014 dataset, on average +0.035 ppm. But there is no pattern or trend added, and deviations vary randomly between + and -. So last year I took the 2020 dataset to replace the older one for updating the analysis.
Now I find the NOAA dataset starting in 2021 has almost completely new values due to a method shift in February 2021, requiring a recalibration of all previous measurements. The new picture of ΔCO2 is graphed below.
The method shift is reported at a NOAA Global Monitoring Laboratory webpage, Carbon Dioxide (CO2) WMO Scale, with a justification for the difference between X2007 results and the new results from X2019 now in force. The orange line shows that the shift has resulted in higher values, especially early on and a general slightly increasing trend over time. However, these are small variations at the decimal level on values 340 and above. Further, the graph shows that yearly differentials month by month are virtually the same as before. Thus I redid the analysis with the new values.
Global Temperature Anomalies (ΔTemp)
The other time series was the record of global temperature anomalies according to RSS. The current RSS dataset is not at all the same as the past.
Here we see some seriously unsettling science at work. The purple line is RSS in 2014, and the blue is RSS as of 2020. Some further increases appear in the gold 2022 rss dataset. The red line shows alterations from the old to the new. There is a slight cooling of the data in the beginning years, then the three versions mostly match until 1997, when systematic warming enters the record. From 1997/5 to 2003/12 the average anomaly increases by 0.04C. After 2004/1 to 2012/8 the average increase is 0.15C. At the end from 2012/9 to 2013/12, the average anomaly was higher by 0.21. The 2022 version added slight warming over 2020 values.
RSS continues that accelerated warming to the present, but it cannot be trusted. And who knows what the numbers will be a few years down the line? As Dr. Ole Humlum said some years ago (regarding Gistemp): “It should however be noted, that a temperature record which keeps on changing the past hardly can qualify as being correct.”
Given the above manipulations, I went instead to the other satellite dataset UAH version 6. UAH has also made a shift by changing its baseline from 1981-2010 to 1991-2020. This resulted in systematically reducing the anomaly values, but did not alter the pattern of variation over time. For comparison, here are the two records with measurements through December 2023.
Comparing UAH temperature anomalies to NOAA CO2 changes.
Here are UAH temperature anomalies compared to CO2 monthly changes year over year.
Changes in monthly CO2 synchronize with temperature fluctuations, which for UAH are anomalies now referenced to the 1991-2020 period. As stated above, CO2 differentials are calculated for the present month by subtracting the value for the same month in the previous year (for example June 2022 minus June 2021). Temp anomalies are calculated by comparing the present month with the baseline month.
The final proof that CO2 follows temperature due to stimulation of natural CO2 reservoirs is demonstrated by the ability to calculate CO2 levels since 1979 with a simple mathematical formula:
For each subsequent year, the co2 level for each month was generated
CO2 this month this year = a + b × Temp this month this year + CO2 this month last year
Jeremy used Python to estimate a and b, but I used his spreadsheet to guess values that place for comparison the observed and calculated CO2 levels on top of each other.
In the chart calculated CO2 levels correlate with observed CO2 levels at 0.9986 out of 1.0000. This mathematical generation of CO2 atmospheric levels is only possible if they are driven by temperature-dependent natural sources, and not by human emissions which are small in comparison, rise steadily and monotonically.
Comment: UAH dataset reported a sharp warming spike starting mid year, with causes speculated but not proven. In any case, that surprising peak has not yet driven CO2 higher, though it might, but only if it persists despite the likely cooling already under way.
Previous Post: What Causes Rising Atmospheric CO2?
This post is prompted by a recent exchange with those reasserting the “consensus” view attributing all additional atmospheric CO2 to humans burning fossil fuels.
The IPCC doctrine which has long been promoted goes as follows. We have a number over here for monthly fossil fuel CO2 emissions, and a number over there for monthly atmospheric CO2. We don’t have good numbers for the rest of it-oceans, soils, biosphere–though rough estimates are orders of magnitude higher, dwarfing human CO2. So we ignore nature and assume it is always a sink, explaining the difference between the two numbers we do have. Easy peasy, science settled.
What about the fact that nature continues to absorb about half of human emissions, even while FF CO2 increased by 60% over the last 2 decades? What about the fact that in 2020 FF CO2 declined significantly with no discernable impact on rising atmospheric CO2?
These and other issues are raised by Murray Salby and others who conclude that it is not that simple, and the science is not settled. And so these dissenters must be cancelled lest the narrative be weakened.
The non-IPCC paradigm is that atmospheric CO2 levels are a function of two very different fluxes. FF CO2 changes rapidly and increases steadily, while Natural CO2 changes slowly over time, and fluctuates up and down from temperature changes. The implications are that human CO2 is a simple addition, while natural CO2 comes from the integral of previous fluctuations. Jeremy Shiers has a series of posts at his blog clarifying this paradigm. See Increasing CO2 Raises Global Temperature Or Does Increasing Temperature Raise CO2 Excerpts in italics with my bolds.
The following graph which shows the change in CO2 levels (rather than the levels directly) makes this much clearer.
Note the vertical scale refers to the first differential of the CO2 level not the level itself. The graph depicts that change rate in ppm per year.
There are big swings in the amount of CO2 emitted. Taking the mean as 1.6 ppmv/year (at a guess) there are +/- swings of around 1.2 nearly +/- 100%.
And, surprise surprise, the change in net emissions of CO2 is very strongly correlated with changes in global temperature.
This clearly indicates the net amount of CO2 emitted in any one year is directly linked to global mean temperature in that year.
For any given year the amount of CO2 in the atmosphere will be the sum of
all the net annual emissions of CO2
in all previous years.
For each year the net annual emission of CO2 is proportional to the annual global mean temperature.
This means the amount of CO2 in the atmosphere will be related to the sum of temperatures in previous years.
So CO2 levels are not directly related to the current temperature but the integral of temperature over previous years.
The following graph again shows observed levels of CO2 and global temperatures but also has calculated levels of CO2 based on sum of previous years temperatures (dotted blue line).
Summary:
The massive fluxes from natural sources dominate the flow of CO2 through the atmosphere. Human CO2 from burning fossil fuels is around 4% of the annual addition from all sources. Even if rising CO2 could cause rising temperatures (no evidence, only claims), reducing our emissions would have little impact.
Coal and natural gas plants provide 60% of the U.S.’ affordable, reliable, and baseload power. In a time of increased electricity demand, America needs to double down on harnessing these sources—not abandon them.
Coal and natural gas plants provide 60% of the U.S.’ affordable, reliable, and baseload power. In a time of increased electricity demand, America needs to double down on harnessing these sources—not abandon them.
The Environmental Protection Agency (EPA)’s recently finalized Clean Power Plan 2.0 (CPP) rule, however, takes the country in the wrong direction. Under this regulation, one that is arguably illegal, existing coal and new natural gas power plants will be mandated to install emissions control technologies that aren’t yet commercially viable. Plants that don’t comply risk permanent closure. This unrealistic mandate is advanced under the guise of reducing greenhouse gas emissions 90% by 2032.
The Biden administration should nix this rule altogether given its many drawbacks to the American economy, all of which come with no environmental gain and are based on dubious authority. If it doesn’t reverse course, a forthcoming Congressional resolution of disapproval and newly-filed lawsuits could stop overreach here.
The EPA’s limited authority over-regulating greenhouse gas emissions was affirmed in the landmark June 2022 West Virginia vs. EPA decision. That case challenged the original Obama-era Clean Power Plan, and the Supreme Court ruled the EPA lacked the statutory authority to regulate greenhouse gas emissions. No change has been made to grant the EPA more authority over greenhouse gasses.
Moreover, the Clean Air Act says the EPA must craft achievable emission limitations standards that have been “adequately demonstrated.” Yet, the Carbon Capture technology that would be relied upon under this rule has never been “adequately demonstrated” on the scale that EPA is attempting to require.
The EPA rule would lead to grid instability because operators will be forced to adopt intermittent, unreliable, and costly sources like wind and solar. According to the Department of Energy, wind is only reliable 33.5% of the year while solar is dependable for just 24.9% of the time. Wind energy generation decreased for the first time last year. The federal government reports wind generation hit maturity with slower recorded wind speeds, despite adding 6.2 gigawatts of new wind capacity. Solar energy also had a bad 2023 with over 100 companies going bankrupt and expensive electricity rates. Many planned solar plants, including those receiving Inflation Reduction Act subsidies, are predicted to be canceled this year due to price collapse and waning demand.
The North American Electric Reliability Corporation (NERC) warned in its December 2023 Long-Term Assessment report that rigid policies like CPP 2.0 “have the potential to influence generators” to close down their plants. The risk of massive electric reliability issues across the country is by no means a political talking point. In 2023, FERC Commissioner Danly stated in a hearing to the Senate Energy and Natural Resources Committee that “there is a looming reliability crisis in our electricity markets.” In that same hearing, Commissioner Christie said “The United States is heading for a very catastrophic situation in terms of reliability.” These are the experts sounding the alarm that we need more grid capacity from baseload sources, not intermittent ones, or we could face not just loss of commerce but a loss of human life.
CPP 2.0 promises to reduce greenhouse gas emissions by 90% by 2032 by mandating coal and natural gas plants install carbon capture and storage (CCS) or face closure. But the EPA is downplaying the nascent technology’s shortcomings.
CCS, as it stands, is expensive and will diminish coal and natural gas plant efficiency by at least 14%. Moreover, natural gas and coal plants retrofitted with first-generation carbon capture technology reportedly can expect a 50% and 70 to 80% increase in electricity costs, respectively.
In the U.S., we already have highly effective emissions technology that enables coal plants to run in an incredibly environmental way. For example, just look at how states that rely heavily on coal have almost none of the air quality issues of China or India. That’s because of our emissions control technologies.
Let’s call this rule out for what it really is: It’s a vehicle to punish coal country which has left the president’s party in droves over the last 20 years, in favor of radical environmental non-governmental organization (NGO) donors who are a major constituency of this administration.
The finalized Clean Power Plan 2.0 rule is a bad deal for American energy producers and consumers. Congress should immediately pull the plug on this rule.
Gabriella Hoffman is director of Independent Women’s Forum’s Center for Energy and Conservation (iwf.org/CEC) and host of the District of Conservation podcast.
Christian Palich is Vice President of Government & External Affairs at Eagle Forge Services Company, one of the nation’s largest coal producers and a board advisory member for IWF’s Center for Energy and Conservation.
This article was originally published by RealClearEnergy and made available via RealClearWire.
Finally, the Green-left activists are starting to ask if Big Money is distorting their own environmental efforts
Twenty years too late, a few on the green patsy environmental side are starting to feel “uneasy” about the billions of dollars gifted into their accounts by the nice caring bankers and oligarchs. The money thrown at believers is so obscenely big even they are raising eyebrows.
They wonder if Jeff Bezos is controlling too much of the environmental charity funding, and that he really wants to set up carbon offset schemes which greens fear will be “greenwashed” corrupted and a waste of time. This is quite a rare hint that a few in the environmental circles are just starting to be suspicious that they are being used to support other money making agendas.
But this is a crack in the door for skeptics to wedge:
Launched with a skeleton team in February 2020, the Bezos Earth Fund aims to give away $10bn (£7.9bn) of the Amazon founder’s $200bn personal fortune to combat the climate crisis and biodiversity loss by the end of the decade. So far, it has issued more than 230 grants worth $2bn, funding initiatives from AI environmental solutions to clean energy for disadvantaged communities.
In the process, the Bezos Earth Fund has become one of the most influential voices in the climate and biodiversity sector, with its fellows, advisers and directors a high-profile presence at international negotiations.
Now they worry about the conflict of interest?
But privately in the climate and biodiversity sector, the mood around the Bezos Earth Fund has turned to one of growing unease. Researchers, climate policy advisers and NGO staff voiced concerns about the level of influence the organisation holds over critical environmental institutions for halting climate change and biodiversity loss, many of which now count Bezos Earth Fund among their biggest funders. Some did not want to be named due to concerns about the consequences for their own funding.
“We have seen millions of dollars paid to conservation and climate organisations. So many have taken money from the Bezos Earth Fund and I find it really worrying. There is obviously a risk of a conflict of interest,” says Holger Hoffmann-Riem from the Swiss NGO Go for Impact. “The credibility of the system relies on independence.”
The system needs independence indeed, but where were they when science needed independence? They were in bed with the bankers and bureaucrats, demanding carbon credits to save the world.
The aim of the Big Banker class was always to establish a carbon fiat currency brokered by them. It was potentially a $7 Trillion dollar money making venture (for bankers). Wouldn’t you love to be paid to profit from an invisible product where no one needed delivery of anything, yet you could claim to be saving the world? The only “commodity” in this market are paper certificates issued by third world bureaucrats, and checked by people who want jobs with the UN or HSBC? (We all know what HSBC is looking for in an employee, and it isn’t “independence”. (Remember Stuart Kirk’s story?)
More signs that the Green left are starting to fragment
Does Jeff Bezos really want to save the world? Green gravy train troughers are afraid to ask out loud:
One climate policy expert, speaking on the condition of anonymity, says: “In the few years since it started distributing enormous amounts of money for climate change and conservation, Bezos Earth Fund has established influence over many major initiatives and their board members.
“At this point, Bezos Earth Fund’s enormous presence in the climate and conservation space starts to look less philanthropical, and more like an attempt to take over the corporate governance system for its own interests and agenda.”
Things are cracking up in the Carbonista cabal because the impossible Net Zero targets can only be met by buying carbon credits from countries who have a massive dirty emissions industry they can clean up cheaply or who can fake it. The true (delusional but more honest) Greens sense that there is something wrong with this international money market idea. After all, people close to home won’t have to give up their air conditioners and cars if they can just pay some slave in Malawi to do it for them. Hence there was a big dummy-spit when Bezos group was seen supporting “carbon offsets”:
Many in the conservation and climate world say their concerns crystallised this year, when a bitter internal row erupted at the Science Based Targets initiative (SBTi), one of the world’s most important climate certification organisations. The SBTi, which received an $18m grant from Bezos in 2021, is the organisation responsible for assessing whether some of the world’s leading companies are decarbonising in line with the Paris agreement.
In April, the SBTi board unexpectedly announced plans to allow companies to meet their climate targets with carbon offsets from the unregulated voluntary carbon market for indirect emissions. The move provoked internal fury. Staff and technical advisers said they were not consulted about the announcement and warned it could open the door to greenwashing.
They expressed fears that the science-based process was being sidelined in favour of more company-friendly policies with weaker standards, with large polluters allowed to buy offsets instead of cutting emissions. Dozens of SBTi staff called for the resignation of the CEO, Luiz Fernando do Amaral, and board members, including the Bezos fellow Iván Duque, in an internal letter.
But ponder this –a lot of the green-left-industrial complex don’t want a real free market in carbon either. The renewables industry wants a half-baked one to support them, but doesn’t want want a full open free market in carbon because the sell products that are expensively stupid ways to reduce CO2. So if there is anything resembling a free market in carbon credits, they might lose market share to all the cheaper options. When Australia had a carbon auction system small tree farms used to win the bidding at $14 a ton of carbon “saved”. While wind and solar power were costing hundreds of dollars a ton. And electric vehicles are even worse.
So other big money guys who are using the greens have an interest in making sure the carbon market isn’t too free and only certain “low emissions” schemes can be accepted.
From the Bezos Fund site — obviously they don’t want a real free market, they want a rigged one, as long as they get to do the rigging, eh?
“The market economy can play a valuable role in shifting to a green future, but free markets alone can simply perpetuate past pollution and depletion. The Bezos Earth Fund is working to accelerate changes in goods and financial markets to create a virtuous cycle of investment, prosperity, jobs, innovation, emission reductions and ecosystem protection.”
But when you have $10 billion dollars to give away and Big Bankers for friends, what’s to say you can’t rig the market?
The end of fossil fuel is a fiction. The only downward pressure on fossil fuel use in Western nations is regulatory lunacy and the ongoing export of our manufacturing industry to other nations.
“… Even though we might be seeing record high prices at the moment, and therefore record high revenue for governments, the overall trend is going to be downwards. …”
The fingerprints of climate change are all over a budget navigating an economy in transition
By climate reporter Jess Davis and climate lead Tim Leslie Posted Sat 18 May 2024 at 5:35am
…
Modelling of natural disasters in different climate scenarios could see government spending increase exponentially.
…
Preparing for the end of the fossil fuel era
While it’s full of figures and tables, the budget also is an opportunity for the government to draw attention to things it thinks are important. And this year it highlighted an unexpected boon from record fossil fuel profits.
“Strong corporate profits, including from iron ore and coal prices in late 2023 and the very early part of 2024 exceeding those assumed in MYEFO and robust demand, contribute to an upgraded company tax outlook,” the papers say.
But it is also warning that we can’t keep relying on these profits in the future.
“Australia’s exports will be increasingly comprised of low carbon products. Over 97 per cent of Australia’s trading partners have set net zero targets,” the papers say.
Grattan Institute Energy and Climate Deputy Director Alison Reeve says Australia needs to be ready for this drop.
“As the world commits to net zero and coal, oil and gas start to decline, there should be less tax revenue coming into the government as well and that also has an effect on the budget,” she said.
This in my opinion is a prime example of the fantasy world climate believers live in.
The end of fossil fuel is a fiction. The only downward pressure on fossil fuel use in Western nations is regulatory lunacy and the ongoing export of our manufacturing industry to other nations.
That fossil fuel powered manufacturing is still happening, and we are very much still using the products of a coal based economy, but because the coal and gas burning is happening in other countries, greens frantically pretend we are somehow disconnecting our economies from burning carbon based fuels.
The only question is, what will our descendants do when the coal runs out? Because it is inevitable we will burn or otherwise use every scrap of recoverable fossil fuel on the planet.
Let us hope when fossil fuel finally runs out, many centuries from now, our descendants have figured out nuclear fusion, because the next best source of carbon after we run out of coal is either limestone or mining the ocean for its CO2 content, and doing either would take a lot of energy.





You must be logged in to post a comment.