Global warming, climate change, all these things are just a dream come true for politicians. I deal with evidence and not with frightening computer models because the seeker after truth does not put his faith in any consensus. The road to the truth is long and hard, but this is the road we must follow. People who describe the unprecedented comfort and ease of modern life as a climate disaster, in my opinion have no idea what a real problem is.
Leading energy chief executives argue a coal safety net to smooth the exit away from fossil fuel generation will keep the supply of power reliable and affordable, as 2030 climate targets are frustrated by the insufficient pace of new sources of renewables and transmission.
…
He said that in almost every aspect – whether social licence, the rising cost of capital and the need to attract skilled people to deliver the build-out – the situation had gone backwards in the last 18 months.
“That doesn’t mean the output has to be as high as coal-fired generators have been in the past, but it does mean that we see a transitional role and don’t just turn off and just expect that you can solve all weather conditions without the tools.”
Please understand folks, these aren’t long term coal plants which are being proposed, they are temporary coal plants, which will be switched off just as soon as the battery backup is ready.
The NSIDC website, IPCC’s reports and some scientific papers have announced that the Arctic Sea ice extent, when it is lowest in September month, in recent years has declined dramatically, and in few decades the sea ice is supposed to disappear completely in the summer. In that way new and shorter ships routes will open up north of the continents.
For ice extent in the Arctic, the bar is set at 15M km2. The highest daily average in the last 18 years occurs on day 61 at 15.08M before descending. Most years are able to clear 15M, but in recent previous years, 2017, 2018, 2019 and 2021 ice extents failed to clear the bar at 15M km2. On February 11, 2024 (day 42) Arctic ice extent already leaped over that bar 20 days early. Then extent dropped for several days, but has again topped 15 Wadhams with ice in Asian basins contributing greatly.
The animation shows Pacific ice growth in the last week. Bering Sea on the right changed little, while Okhotsk in the center added ice down to N. Japan, and now well above 2023 March maximum. The ice patch in far left is the harbor close to Beijing where the Yellow Sea added 20K km2 ice extent in two days.
The graph shows the rapid rise in Arctic ice reaching 15 M km2 extent already on Feb. 11 (day 42) Then the extent dropped down to 14.6M before rising again to reach a new high of 15.07M. Yesterday Arctic ice was 215k km2 above average, with nearly all the surplus appearing in Okhotsk. SII showed neither the first peak or the current one in February.
The table shows the distribution of ice compared to day 56 averages and other years on that day.
Region
2024056
Day 56 Ave
2024-Ave.
2006056
2024-2006
(0) Northern_Hemisphere
15039168
14823967
215201
14318117
721051
(1) Beaufort_Sea
1070983
1070317
667
1069711
1273
(2) Chukchi_Sea
966006
964499
1507
961796
4210
(3) East_Siberian_Sea
1087137
1087109
28
1086702
435
(4) Laptev_Sea
897845
897837
8
897773
71
(5) Kara_Sea
925734
916917
8818
899871
25864
(6) Barents_Sea
598915
606693
-7778
484567
114348
(7) Greenland_Sea
742472
612727
129745
577357
165115
(8) Baffin_Bay_Gulf_of_St._Lawrence
1391601
1508331
-116730
1365491
26110
(9) Canadian_Archipelago
854860
853163
1697
852715
2145
(10) Hudson_Bay
1260903
1260462
441
1257077
3827
(11) Central_Arctic
3220834
3210037
10797
3214577
6257
(12) Bering_Sea
619130
665856
-46727
629210
-10080
(13) Baltic_Sea
85666
98767
-13101
101029
-15363
(14) Sea_of_Okhotsk
1282477
1028678
253799
853467
429010
Note that moderate deficits in Bering Sea and Baffin Bay are more than offset by a large 254k km2 surplus in Okhotsk along with 130k km2 in Greenland Sea.
These results fly in the face of those claiming for years that Arctic ice is in a “death spiral.” More sober and clear-eyed observers have called out the alarmists for their exaggerations. A recent example comes from Allan Alsup Jensen at Nordic Institute of Product Sustainability, Environmental Chemistry and Toxicology, Denmark. His December 2023 paper is Time Trend of the Arctic Sea Ice Extent. Excerpts in italics with my bolds and added images.
Since 2007 no significant decline has been observed
Abstract
The NSIDC website, IPCC’s reports and some scientific papers have announced that the Arctic Sea ice extent, when it is lowest in September month, in recent years has declined dramatically, and in few decades the sea ice is supposed to disappear completely in the summer. In that way new and shorter ships routes will open up north of the continents.
The facts are, that the Arctic Sea ice extent measured by satellites since 1978 expresses annual variations and it has declined considerably from 1997 to 2007. However, before that time period, from 1978 to 1996, the downward trend was minimal, and in the last 17 years from 2007 to 2023 the downward trend has also been about zero. Therefore, there is no indication that we should expect the Arctic Sea summer ice to disappear completely, as predicted, in one or two decades.
Regarding the extent of the summer (February) sea ice at the Antarctic, the downward trend during the years 1979-2021 was very small but in 2022 and 2023 a considerable decline was observed, and a decline was also clearly observed for the whole period of 2007- 2023. That was in contradiction to what happened in the Arctic. The pattern of the annual levels was not the same for the Arctic and Antarctic, indicating different drivers in the North and the South.
Figure 4: The minimum extent of the sea ice at Antarctic in February month 1979-2023 (data from NSIDC.org)
These data show that there is no apparent correlation between the variable extent of the Arctic and the Antarctic Sea ice and the gradually increasing CO2-concentrations in the atmosphere as proposed by NSIDC, IPCC and others, also for these areas of cold climate.
Postscript Feb. 14
Some seek to deny the current plateau in Arctic Sea Ice by saying that extent measure is only surface, while volume would be a truer metric. That is true in theory, but in practice obtaining accurate and consistent data on sea ice thickness is a challenge yet to be reached. As you can imagine, detecting a depth dimension from satellites is fraught with errors, especially with drift ice not land anchored, moving around, sometimes piling up from winds. The scientific effort to measure volume has a short history and several uncertainties to ovecome before it can be trusted.
Unfortunately for those wanting an ice free Arctic (well, no more than 1 Wadham they say), the volume record so far shows the same plateau:
“Satellite derived sea ice thickness (CryoSat 2, AWI algorithm v2.6) shows an anomaly thickness pattern very similar to that from PIOMAS, but CS2 shows negative anomalies propagating north of the Canadian Archipelago into the central Arctic while PIOMAS has neutral conditions there. A positive thickness anomaly around Wrangle Island is spatially more extensive in CS2. January 2024 adds another month to the record of CS2 data which now spans 13 years. Neither CS2 nor PIOMAS show any discernible trend over that time period underlining the importance of internal variability at decadal timescales.” Source: Polar Science Center
Standing at the front of the room at an auto industry association’s new year reception in Berlin this week, BMW CEO Oliver Zipse had reason to feel vindicated.
Without subsidies, German EV sales set to drop 14% this year. Audi, VW are among those scaling back EV-related ambitions.
Standing at the front of the room at an auto industry association’s new year reception in Berlin this week, BMW CEO Oliver Zipse had reason to feel vindicated.
Onstage, Transport Minister Volker Wissing was preaching to the crowd of policymakers and industry executives about the importance of “technological openness” in reducing transit emissions.
A singular focus on battery-powered vehicles by policymakers and manufacturers is leaving Germany’s most important industry exposed, he said, with a forecast of slumping EV demand in Europe’s biggest car market hanging over his message. Bloomberg has the story.
Zipse has been making that same point for years, advocating for flexible production lines for combustion, hybrid and even hydrogen-powered cars. His cautious strategy — which chimes with his predecessor’s — was attacked as not aggressive enough on challenging electric leader Tesla Inc.
Now, Zipse appeared to have seen into the future. With EV adoption slowing and plug-in hybrids making a return from the sidelines, BMW’s careful approach no longer looks like such a bad idea.
“In Germany, demand for electric vehicles does not look good this year,” said Jan Burgard, head of automotive consultant Berylls strategy advisors. “The upper end of the EV market is almost saturated, and there is little on offer in the lower-end €25,000 segment.”
After years of surging growth, selling EVs is becoming tougher. Generous government incentives are disappearing in Europe and fewer vehicles qualify for them in the US. While a range of new models and commitment-light leasing options have attracted the attention of electric enthusiasts, some years into the EV revolution, infrastructure and price still remain roadblocks to widespread adoption.
In Germany, sales are set to drop 14% this year in response to the government yanking subsidies in December, the first decline since 2016, according to the VDA lobbying group. Globally, market watchers have trimmed forecasts amid the enduring reality that the vehicles are much less affordable than equivalent combustion-engine cars — despite a price war kicked off by Tesla.
Thursday’s event was an attempt to inject some optimism into an increasingly somber industry. Wissing praised German carmakers and extolled their technology as “celebrated abroad.” When asked what the government could do to bolster the German EV market, the transport minister offered one thought: “Charging infrastructure.”
Yet on this front, Berlin has lagged. In October 2022, Wissing rolled out an ambitious strategy to invest €6.3 billion ($6.85 billion) in a nationwide infrastructure that would increase the number of charging stations in Germany to one million in 2030.
That hasn’t gone as quickly as planned. As of last September, there were only about 105,000 functional public charging stations in Germany, according to the infrastructure authority.
At the current rate of construction, VDA noted, Germany will need to triple its pace if it wants to hit its 2030 goal.
The charging conundrum, and who pays for it, remains unresolved many years into the EV transition. While policymakers and car industry representatives at the VDA event agreed that charging was key to reigniting interest in EVs, none wanted to say who should finance such an infrastructure expansion — or how. Rising electricity prices have further tamped down demand, according to a Deutsche Bank analyst note.
The article is full of people hyperventilating about the imaginary effects of a claimed three-foot (one meter) sea level rise in “a few decades”.
Riiight … not happening.
The article is full of people hyperventilating about the imaginary effects of a claimed three-foot (one meter) sea level rise in “a few decades”.
Riiight … not happening.
I will admit, however, that their claims of a high rate of sea level rise at Humboldt Bay surprised me. Sea levels along much of the northern west coast of North America are small or negative, because of the geological uplift of the land. I expected Humboldt would be the same. Instead, when I went to the NOAA sea level site I found the following. Eureka in the map below is the city on the shores of Humboldt Bay.
So the article is correct in one regard. Measured sea level is indeed rising fast in Eureka … but curiously, the next two tide stations to the north, Crescent City California and Port Orford Oregon, show falling sea levels.
Say what?
I was surprised because the west coast of North America is constantly being wedged upwards by the Pacific tectonic plate. The Pacific plate is diving downwards under the North American plate as they collide. This forces the entire west coast up vertically over geological time.
And surprisingly, in many areas the rate of uplift of the land is greater than the rate of sea level rise, leading to all the scenic cliffs you see in photos of the North Coast. As shown on the map above, the two tide gauge stations nearest to Eureka (Humboldt Bay) are Crescent City, CA, where the sea level is dropping, not rising but dropping, at -0.8 mm per year; and Port Orford, Oregon, which is barely negative but still dropping at -0.06 mm per year.
So Humboldt Bay is an anomaly, with a sea level rise of 5.0 mm per year. What’s going on?
Now, in my fortunately misspent youth, I crab-fished commercially one winter out of Humboldt Bay, freezing my fingers breaking up frozen bait for the crab pots at 5 AM on the way out through the entrance shown below. So I have some understanding of the local turf. Humboldt Bay is a type of bay that is unusual on the west coast of the US but is very common on the east coast. It consists of a long narrow bay created by a long thin natural sand barrier offshore from the mainland, in the form of long sandspits and or sand barrier islands parallel to the mainland coast.
Humboldt is formed by two such long sand spits, imaginatively called “North Spit” and … well, you guessed it. The natural opening between them has been artificially extended by a seawall at the end of each spit, as seen below.
Humboldt Bay, Bay Entrance and City Of Eureka, 40.1°N
Humboldt is a fearsome bay for fishermen, because during the year an underwater sand bar forms across the entrance. This means that at certain somewhat unpredictable states of wind and tide, you can get a sudden “sneaker wave” that breaks all the way across the space between the seawalls, closing out the entire entrance with whitewater … ugly.
Or the wind can whip the waves up and it breaks constantly across the entire entrance, and the Coast Guard declares the entrance closed, and if you’re outside, it’s a long way and dangerous way to the nearest harbor. Only the Coast Guard goes in or out then, and it’s not pretty.
(And as a man who has worked on the ocean as a commercial fisherman from Monterrey Bay to the Bering Sea, I must take a moment to thank the women and men of the US Coast Guard for putting their lives on the line and being a commercial fisherman’s best friend in time of danger. You folks have the profound appreciation of every commercial fisherman I know.
… an important digression, but a digression nonetheless … so now we return you to your regularly scheduled programming.)
To keep the Humboldt Bay entrance open, it’s necessary to dredge it out every year. The dredged material is ~ 90% sand, 10% silt.
And that brings up an interesting question—the silt is coming from the rivers that feed Humboldt Bay. But where is the endless supply of sand coming from?
The answer is, a beach on the west coast of the US is more accurately described as a hesitation in a slow river of sand flowing endlessly southwards. All the sand almost anywhere on the coast is constantly being moved south by the combined action of the prevailing currents, the beach waves, and prevailing northwest winds. All of these are incessantly picking up bits of sand and moving them just a bit southward.
You can see the shoreside ocean depths by color in the aerial view above. And you can see that having the two artificial seawalls has impeded the southward flow of water and sand. The shallows extend outwards in a circle around the mouth of the seawalled entrance to Humboldt Bay.
Now, if you were putting a tide gauge, would you put it out on the tip of one or the other of the shifting, moving North and South sand spits … or would you put it over on the mainland side of the bay?
Well, one assumes for valid historical reasons, the tide gauge is actually located at the Coast Guard station at the edge of the Samoa Dunes State Recreation Area on the North Spit, in the location shown both above and below.
But not on shore, of course. On a pier. Or to be more accurate, taking up an entire concrete pier. Per the station home page:
The bench marks are on the Coast Guard Base property. The tide gauge is at the east end of the southern pier of two finger piers directly east of the 3-story Coast Guard station building. Station Description: Instruments are hanging in the loft of the Coast Guard Boat House.
Here’s a photo and an overhead view. Looks like a combination two-boat boathouse and tide gauge station.
Further complications abound. Check out the nautical chart below.
The docks and buildings on the upper right side of the graphic above are the Coast Guard station and the location of the NOAA tide gauge.
In the chart above you can see the effect of the north breakwater on the slow southward-flowing river of sand. On the north side, the sand has filled in the corner between the north breakwater and North Spit. It has extended and grown the beach outwards in that corner, and the shallows now extend to the tip of the breakwater.
Sand on the move.
Next, note the regularly dredged entrance channel shown in white. It extends well into the bay. And it’s dredged right up to the edge of the Coast Guard docks to allow for the docking of large vessels.
So: To review the bidding:
• The NOAA tide gauge is located, not on solid ground, not even on mainland ground, but on an offshore barrier spit made of … sand.
• Its nearest neighbor is the Samoa Dunes State Recreation Area, which like North Spit in general is made entirely of … sand.
• The tide gauge is sitting in a large building on massive heavy concrete piers that extend down into … sand.
• The area just farther into the bay from the tide gauge is dredged annually to remove … the sand.
• The local sand flows and the shape of North Spit have been greatly impacted by the construction of two large offshore breakwaters, and by the annual dredging of the entrance channel.
And with that as prologue, are you surprised that the wildly anomalous sea level record strongly suggests that the North Spit tide gauge is slowly sinking into … sand?
The good news is, other than for the small towns of Fairhaven, Manila, and Samoa which were foolishly built right on North Spit, the Humboldt Bay sea level catastrophe is canceled—sorry, no refunds for those who bought tickets.
Those small towns may or may not be sinking—after all, the spits have been there a long, long time. That means that historically, the sand constantly being removed from the spit by wind and water has been replaced by new sand moved onto the spit by wind and water from the ocean side. So for those towns, likely no immediate threat.
The other good news is, I’m sensing a whiff of desperation from the crowd pushing the “EVERYONE PANIC, IN A DECADE WE’LL BE DEAD” line of patter … after five decades of failed serial doomcasting, seems more folks are starting to wise up.
And the best news? That would the fact that I’m still on the green side of the grass, not the brown side … and at 77 years old I give thanks for that every day.
My best to all, hold your friends and family close, seize the day, life is far too short,
w.
My Usual Ask: When you comment, please quote the exact words you are discussing. Makes things clear.
PS: Why doesn’t NOAA adjust the data for the land subsidence? I suspect it’s from a lack of data. According to Sonel, the “Co-located GPS” is RedwoodsCCCN2004… which is way down at the south end of the Bay and not located on either of the spits. It shows subsidence, but only at -0.85 mm/year, clearly less than that of the tide gauge at North Spit.
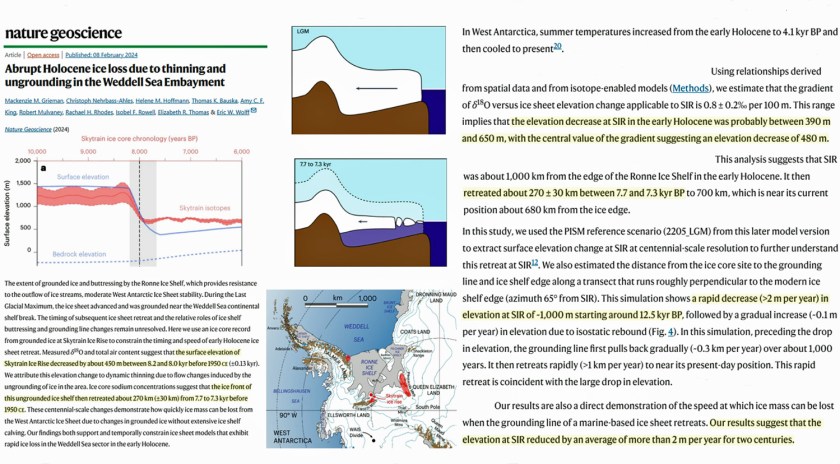
Retreat rates for the West Antarctic Ice Sheet (WAIS) were massive during the Early Holocene, when CO2 concentrations were low and stable (~265 ppm), dwarfing any retreat rates witnessed in the modern era.
Retreat rates for the West Antarctic Ice Sheet (WAIS) were massive during the Early Holocene, when CO2 concentrations were low and stable (~265 ppm), dwarfing any retreat rates witnessed in the modern era.
New research published in Nature Geoscience (Grieman et al., 2024) assesses the elevation of West Antarctica’s ice sheet fell by ~480 m within just 200 years from about 8,000 to 8,200 years ago, a drop of more than 2 meters per year.
The scientists also document an ice area retreat of 270 kilometers at the study site within only 400 years, from ~7,300-7,700 years ago. That’s an area retreat rate of about 675 meters per year.
No modern WAIS recession rates are even remotely comparable to those achieved naturally during the Early to Mid Holocene.
Politicians and activists alike have warned of a looming climate catastrophe for decades. “Biden urged to declare climate change a national emergency,” reported NBC last year. “Climate Changes Threatens Every Facet of U.S. Society, Federal Report Warns,” announced Scientific American.
Dr. Mike Hulme says scientists and activists are exaggerating the threat.
Politicians and activists alike have warned of a looming climate catastrophe for decades. “Biden urged to declare climate change a national emergency,” reported NBC last year. “Climate Changes Threatens Every Facet of U.S. Society, Federal Report Warns,” announced Scientific American.
Cambridge University climate scientist Mike Hulme disagrees. “Declaring a climate emergency has a chilling effect on politics,” he tells Public. “It suggests there isn’t time for normal, necessary democratic process.”
Climate activists may dismiss Hulme as a “climate denier,” but he agrees the planet is warming due to human activities and specifically says we should prepare for more heat waves.
Moreover, Hulme’s credentials are undeniably impressive. He is a Professor at the University of Cambridge and founding Director of the Tyndall Centre for Climate Change Research. Hulme has advised everyone from the United Nations to the UK Government and earned a personalized certificate from the Nobel Peace Prize committee for his work with the UN’s Intergovernmental Panel on Climate Change (IPCC).
Now, in his new book, Climate Change Isn’t Everything, Hulme strongly denounces “climatism,” which he describes as the “unyielding belief that stopping climate change is the pre-eminent yardstick against which all policies must be measured.”
Protesting farmers surrounded a government building Monday in Belgium as they sprayed police with liquid manure, according to The Associated Press (AP).
Protesting farmers surrounded a government building Monday in Belgium as they sprayed police with liquid manure, according to The Associated Press (AP).
The farmers expressed their frustration with the Belgian government’s reliance on cheap imports from foreign countries by targeting the European council building and combating Brussels police, The AP reported.
“The European Quarter in Brussels looks like a warzone,” Media outlet Remix News and Video wrote on Twitter, alongside a video from the demonstration.
Quite astounding scenes in Brussels today as farmers destroy police barricades around the EU quarter, drive tractors at police, dump produce on roads and set light to traffic infrastructure.
Farmers drove approximately 900 tractors to the city and made their way to the European council building, where the government’s agriculture ministers were meeting, according to The AP. They proceeded to throw eggs and flares at officers, who took cover behind concrete barriers and barbed wire.
Demonstrators also used their tractors to block traffic and public transportation as smoke clouded the area, the outlet reported. Police countered the protest by reportedly firing tear gas and water cannons at the farmers.
Tensions continue to rise among protesting farmers and the governments across the European Union (EU). The demands of farmers have apparently been acknowledged by the EU presidency. The executive branch conceded to protesting farmers earlier in February by cancelling an anti-pesticide proposal, according to The AP.
An article published in BNN Breaking News by author Aqsa Younas Rana, titled “Climate Change to Plunge 200 Million Africans into Severe Hunger by 2050” asserts that climate change will result in widespread hunger, starvation, and agricultural revenue decline in Africa by 2050. The claims are unsubstantiated and contrary to real world data and trends on food production and revenue.
An article published in BNN Breaking News by author Aqsa Younas Rana, titled “Climate Change to Plunge 200 Million Africans into Severe Hunger by 2050” asserts that climate change will result in widespread hunger, starvation, and agricultural revenue decline in Africa by 2050. The claims are unsubstantiated and contrary to real world data and trends on food production and revenue.
The article opens describing a dystopian future in Africa:
Imagine waking up one day to find that the very ground under your feet, once fertile and life-giving, has turned barren. The streams that meandered through your village, brimming with life, now barely whisper. The crops that danced in the wind, promising a bountiful harvest, stand withered. This isn’t a scene from a dystopian novel; it’s a looming reality for millions in Africa, as recent studies project a grim future where 200 million Africans could face severe hunger by 2050 due to the impacts of climate change.
The story doesn’t reference any data or a single study as basis for its prediction of the future, rather it issues a one sentence warning, “[a]ccording to recent findings, agricultural productivity is expected to plummet, with crop revenue forecasted to decrease by 30%.
There is no reference or citation given for the predicted 30 percent decline that Rana warns of, and the evidence that does exist actually indicates that during the recent modest warming, African crops and agricultural revenue have been regularly setting records.
Data clearly show that the IMF’s claims about warming causing a decline in African crop production is patently and obviously false. Crop production in Africa in general, and Ethiopia in particular increased dramatically over recent decades, even as the planet has experienced a warming of more than 1℃. To reiterate the point, as warming has occurred, crop production and yields have increased, not decreased. Also, real world data and peer reviewed agronomy research provides no reason for believing these trends will change in the future, absent political interference in to use of fossil fuels to plant, fertilize, harvest, and deliver crops.
This graph showing agricultural yields and production for primary cereal grains dramatically increased since 1990 at the same time that climate change was supposedly warming the continent of Africa:
Rana mentions Ethiopia, Kenya, and Malawi as specifically threatened by crop losses, yet since 1990 foundational cereal crops and roots and tubers have increased dramatically in each of those countries. Since 1990 (1993 Ethiopia), the U.N. Food and Agriculture Organization reports that:
In Ethiopia, despite civil strife, cereal crop production grew by approximately 496 percent, and root and tuber production increased by a little over 176 percent;
In Kenya, cereal crop production expanded by about 35 percent, and root and tuber production enlarged by almost 97 percent;
In Malawi, cereal crop production expanded by about nearly 185 percent, and root and tuber production grew by an astonishing 3,082 percent. (see the figure below)
Africa in general has seen dramatic increases in agriculture, as demonstrated in numerous other Climate Realism posts, like, here, here, here, and here. Clearly, climate change is not causing a decline in African crop production or harming African farmers.
Agriculture is the top source of income in most of the countries on the African continent with a few exceptions, and economic growth in Africa has been strong in recent decades. “Growth has been present throughout the continent, with over one-third of African countries posting 6% or higher growth rates, and another 40% growing between 4% and 6% per year, reports the World Bank.
With these facts in evidence, the obvious question is: where is the damage to agriculture from climate change claimed by BNN?
The BNN article misses the most obvious factor that has restrained crop production in recent years in some African countries, and caused dramatic fluctuations in others, namely political and civil unrest. According to the website African business, civil unrest is at a six-year high:
A surge in civil unrest in Africa, fueled by political tensions, food insecurity, and government inefficiencies threatens stability, disrupts businesses, and stirs up social and economic crises in the region, new report finds.
…
36 African countries experienced a surge in risk between 2022-Q2 and 2023-Q2, marking the continent’s largest annual increase since the dataset’s inception in 2017, Verisk Maplecroft’s Civil Unrest Index reveals.
The number of African countries now categorized as high or extreme risk for civil unrest has also risen to 37, a significant jump from 28 just six years ago.
Civil unrest threatens farmers’ livelihoods. Even when farms and farmers themselves aren’t in a war zone, such unrest and political fighting often limits farmers access fuel, fertilizer, seeds, and makes it hard, if not impossible, to transport their crops to market. War, rebellion, and civil unrest presents a far more immediate and disruptive danger to agricultural production in Africa, than the gradual warming of the climate over the past 100 years, or any potential warming one might realistically expect by 2050.
None of these facts stopped BNN from writing a poorly researched and unreferenced opinion piece claiming that climate change was the primary problem threatening agricultural production in Africa. Facts just get in the way when the media source wishes to push an alarming climate change narrative.
“In general, we look for a new law by the following process. First we guess it. Then we compute the consequences of the guess to see what would be implied if this new law that we guessed is right. Then we compare the result of the computation nature, with experiment or experience, compare it directiy with observation, to see if it works. If it disagrees with experiment it is wrong. In that simple statement is the key to science. It doesn’t make any difference how beautiful your guess is. It does not make any difference how smart you are, who made the guess, or what his name is — if it disagrees with experiment it is wrong.”
— Dr Richard Phillips Feynman, Nobel Laureate, The Character of Physical Law (1999)
Would that we had Dr Feynman’s ethical approach today! His thinking about the scientific process went beyond comparing theory with experiment. He was also well aware of other ways science could go wrong. In 1974 he gave the CalTech commencement speech. He titled it “Cargo Cult Science.” This speech is arguably the greatest speech on science ever presented. Why? Because in it, he examines completeness. Sadly, I have not found a video of him presenting it.
For those who are unfamiliar with the Cargo Cult, it appeared in various forms in Melanesia during the early to mid-20th Century. The best known, and the one to which Dr Feynman refers, was the John Frum Movement. During World War II, these cultists observed the belligerents using aircraft to move cargo, either by air-drop or landing on airstrips. Wanting this wealth for themselves, though knowing nothing about aviation, they tried to replicate factors they had observed. As Dr Feynman put it:
During the war they saw airplanes land with lots of good materials, and they want the same thing to happen now. So they’ve arranged to make things like runways, to put fires along the sides of the runways, to make a wooden hut for a man to sit in, with two wooden pieces on his head like headphones and bars of bamboo sticking out like antennas — he’s the controller — and they wait for the airplanes to land. They’re doing everything right. The form is perfect. It looks exactly the way it looked before. But it doesn’t work. No airplanes land. So I call these things Cargo Cult Science, because they follow all the apparent precepts and forms of scientific investigation, but they’re missing something essential, because the planes don’t land.
Dr Feynman then goes on to explain researchers should not only describe their findings; they should also report anything they know of that might make their findings invalid.
And that is the link to the Climate Cargo Cult. Global Climate Warming Change alarmism is replete with examples of cherry-picked data, irrelevant data, bad logic, deception, and stuff that is just plain wrong. There is also a lot of wishful thinking and, of course, fear-mongering. Alarmist claims are often ridiculously easy to debunk.
A recent example relates to Greenland. A University of Leeds team, as described in a press release, claims melting ice is causing all kinds of problems there:
An estimated 11,000 sq miles or 28,707 sq kilometres of Greenland’s ice sheet and glaciers have melted over the last three decades, according to a major analysis of historic satellite records.
The total area of ice loss is equivalent to the size of Albania, and represents about 1.6 % of Greenland’s total ice and glacier cover.
Where there was once ice and snow, there is now barren rock, wetlands and areas of shrub.
The press release publicizes this paper, which contains a lot of whining about climate change and its effect on Greenland. The paper opens, “Land cover responses to climate change must be quantified for understanding Arctic climate, managing Arctic water resources, maintaining the health and livelihoods of Arctic societies and for sustainable economic development. This need is especially pressing in Greenland, where climate changes are amongst the most pronounced of anywhere in the Arctic.”
How fast is the ice melting? 30 years to melt 1.6% is 0.000533% 0.053% per year. That does not seem very fast. Indeed, at that rate it will take 18,750 187,500 years for the ice to disappear; but only if the ice is not replaced during future winters.
That is Climate Cargo Cult science.
Julius Sanks is an engineer and manager with experience developing weather forecasting systems and environmental satellites, among other things.






You must be logged in to post a comment.