Global warming, climate change, all these things are just a dream come true for politicians. I deal with evidence and not with frightening computer models because the seeker after truth does not put his faith in any consensus. The road to the truth is long and hard, but this is the road we must follow. People who describe the unprecedented comfort and ease of modern life as a climate disaster, in my opinion have no idea what a real problem is.
The Lake Nyos disaster demonstrated an uncontrolled urban release of concentrated CO2 has the potential to kill millions of people. But this risk doesn’t seem to bother companies chasing funding.
h/t Dr. Willie Soon; The Lake Nyos disaster demonstrated an uncontrolled urban release of concentrated CO2 has the potential to kill millions of people. But this risk doesn’t seem to bother companies chasing funding.
At least 475 carbon-capture lobbyists attending Cop28
Exclusive: Figures reveal growing push by fossil fuel sector for technologies that scientists say will not stop global heating
Cop28 organisers granted attendance to at least 475 lobbyists working on carbon capture and storage (CCS), unproven technologies that climate scientists say will not curtail global heating, the Guardian can reveal.
The figure was calculated by the Centre for Environmental Law (Ciel) and shared exclusively with the Guardian, and is the first attempt to monitor the growing influence of the CCS subset of the fossil fuel industry within the UN climate talks.
CCS, or CCUS (which includes “utilisation”) is being pushed hard at the summit by fossil fuel and other high-pollution industries, as well as by the biggest greenhouse gas emitting countries. CCS backers say the technologies will enable polluters to trap carbon dioxide emissions and bury them under the ground or the seabed, or use the CO2 in the production of fuels or fertilisers.
Carbon dioxide was blamed for the deaths of around 1700 people in Cameroon, west Africa, in 1986 when a massive release of gas occurred from Lake Nyos, a volcanic crater lake. The clinical findings in 845 survivors seen at or admitted to hospital were compatible with exposure to an asphyxiant gas. Rescuers noted cutaneous erythema and bullae on an unknown proportion of corpses and 161 (19%) survivors treated in hospital; though these lesions were initially believed to be burns from acidic gases, further investigation suggested that they were associated with coma states caused by exposure to carbon dioxide in air. The disaster at Lake Nyos and a similar event at Lake Monoun, Cameroon, two years previously provide new information on the possible medical effects of large scale emissions of carbon dioxide, though the presence of other toxic factors in these gas releases cannot be excluded.Read more: https://www.ncbi.nlm.nih.gov/pmc/articles/PMC1836556/
The reason only 1700 people were killed is Lake Nyos is sparsely inhabited – probably because every few centuries the lake belches CO2 and other volcanic gasses, and kills everyone living nearby.
Some of the people who died were over 10 miles from the lake at the time of death.
Imagine a similar CO2 belch from a carbon capture containment facility near a major city. CO2 is heavier than air, so it hugs the ground. The released CO2 would spread across the land, creating an unbreathable layer of gas across a vast area, suffocating everyone unlucky enough to be caught in the affected region. People in tall buildings or on hills might survive, or anyone smart enough to realise what was happening in time to flee the gas cloud, but anyone caught at street level would have very little chance of escape.
A serious city scale carbon capture plan would have to capture CO2 on a similar scale to the lake Nyos disaster every few weeks.
Industry safety reassurances are unconvincing in my opinion, because there would be immense pressure on capture sites. Operating a demonstration plant is very different from attempting to operate a full scale system. In my opinion a full scale capture system would suffer inevitable backups and endemic near capacity storage in holding centres, as capture sites reached their geological limit and the difficulties handling such an immense volume of CO2 disrupted the chain of distribution. In my opinion, it would only be a matter of time until a terrorist attack or accident at one of these holding centres leads to an immense loss of life.
For years, astronomers have worried that Betelgeuse might explode. Instead, it’s about to disappear. On Dec. 11th (USA) and 12th (Europe), main belt asteroid Leona will pass directly in front of Betelgeuse, a first-magnitude star in the shoulder of Orion. Millions of people in a narrow path stretching from South Florida to Italy and Greece can look up and see the red giant dim or even vanish.
Dec. 10, 2023: (Spaceweather.com) For years, astronomers have worried that Betelgeuse might explode. Instead, it’s about to disappear. On Dec. 11th (USA) and 12th (Europe), main belt asteroid Leona will pass directly in front of Betelgeuse, a first-magnitude star in the shoulder of Orion. Millions of people in a narrow path stretching from South Florida to Italy and Greece can look up and see the red giant dim or even vanish.
“This represents an extraordinary and unique opportunity to analyze the diameter and brightness distribution of Betelgeuse with extreme angular resolution,” says astronomer J. L. Ortiz of the Instituto de Astrofísica de Andalucía, lead author of a newly-released preprint about the occultation.
Betelgeuse is not a typical star. Its diameter is 760 times the sun’s, so it appears as a disk 40 milliarcseconds across the sky, much larger than most other stars. High resolution images of Betelgeuse seem to reveal a star in turmoil with giant convection cells bubbling up to the surface. The passage of the asteroid across Betelgeuse may allow astronomers to map these cells and evaluate their role in a possible future supernova explosion.
Above: Images of Betelgeuse taken by the European Southern Observatory’s Very Large Telescope
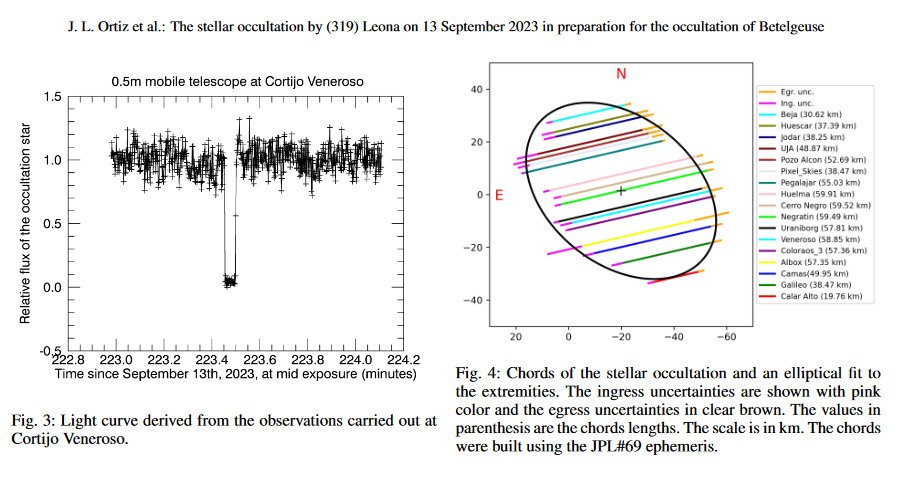
Much is unknown about this occultation. The shape of the asteroid itself is an X-factor. In Sept. 2023, Ortiz and colleagues watched the asteroid occult another star from 17 different locations on Earth. They found that Leona has an oblong shape with dimensions 80 x 55 km, whereas most predictions of the occultation assume the asteroid to be spherical. Leona’s odd shape, plus the fact that it is rotating, could produce some surprises. The occultation path may be wider than expected, and there could be interesting “partial eclipse” effects visible even near the center of the path.
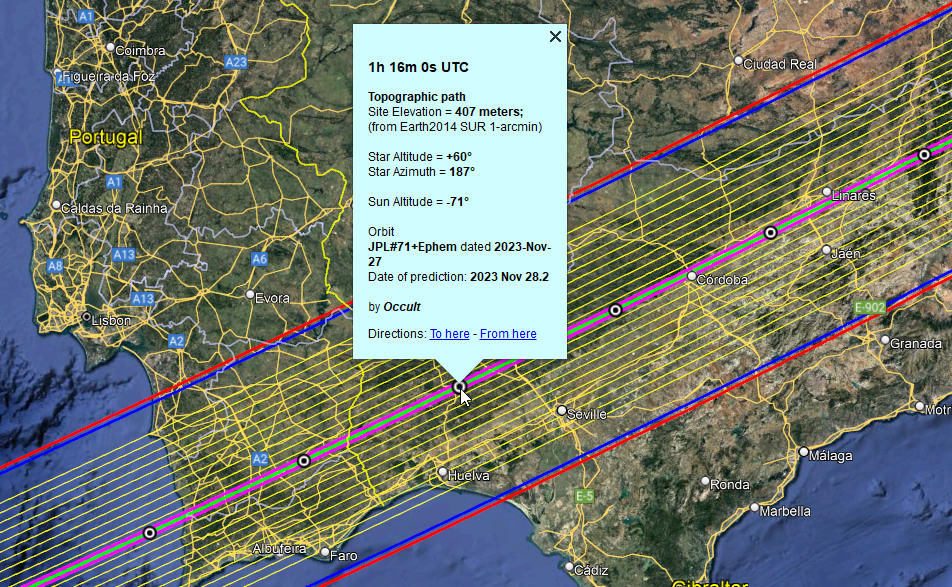
There are huge population centers in the occultation path, especially in south Florida where Leona’s shadow crosses Miami and Fort Lauderdale. For observers there, Betelgeuse will wink out for about 10 seconds on the evening of Dec. 11th just before 8:25 pm Eastern Standard Time. In Europe, the occultation happens on Dec. 12th between 1:10 UT and 1:16 UT. To find out when to look from your location, we recommend downloading this excellent Google Earth file; when viewing the map, click on the little dots for occultation times.
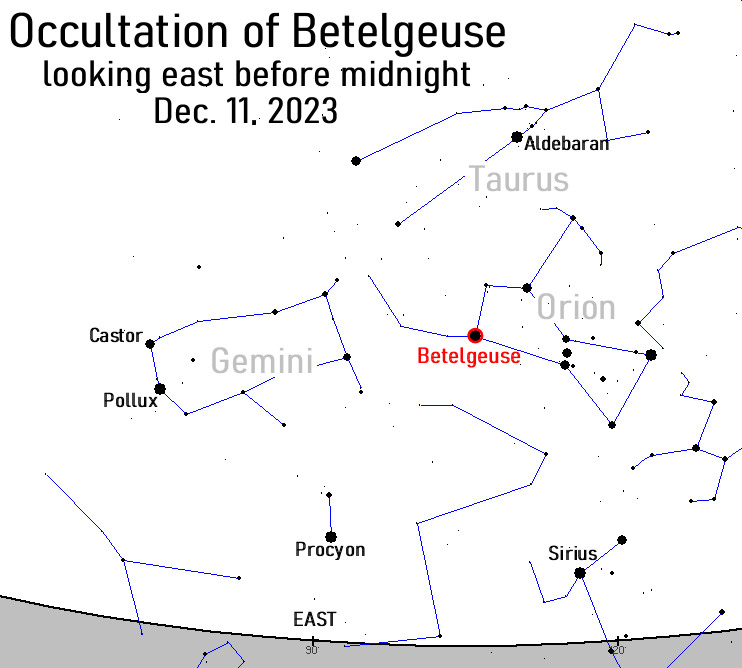
Amateur astronomers who wish to collect research quality light curves are encouraged to read these observing tips from the International Occultation Timing Association. For casual naked-eye observers, here’s a simple sky map.
That Australia, among the world’s largest uranium exporters, doesn’t rely on nuclear power astonishes those from the 30 countries where you’ll find nearly 450 nuclear reactors currently operating – including the French, Americans, Canadians, Japanese and Chinese. Another 15 countries are currently building 60 reactors among them. Nuclear power output accounts for over 11% of global electricity production. But not a lick of it in Australia.
As the climate cult and those profiteering from the great wind and solar scam gather in Dubai, Australia’s embarrassing refusal to embrace nuclear power is drawing fire from anyone gifted with something approximating common sense, as these pieces from The Australian outline below.
Anthony Albanese under pressure to lift nuclear ban from senior Labor, union figures The Australian Geoff Chambers and Rosie Lewis 5 December 2023
Senior Labor and union figures are pushing the Albanese government to lift the ban on nuclear energy to help shield jobs and achieve net zero emissions, as new polling reveals urban voters support cheaper and reliable energy supply ahead of the renewables rollout.
After Emmanuel Macron and former Labor minister Joel Fitzgibbon called on the government to remove prohibitions on nuclear energy at the COP28 summit, Australian Workers’ Union national secretary Paul Farrow said nuclear energy must be on the table to protect heavy industry.
Ahead of Chris Bowen flying to Dubai for the UN climate change conference on Wednesday, Mr Farrow said “if you really believe climate change is a crisis you should be open minded to every single emission reduction option on the table”.
The AWU national secretary, who in July replaced long-time nuclear energy advocate Daniel Walton, said it is “better for the planet if Australia makes steel and aluminium and glass than if those products are made in less regulated countries”.
“But if we want those industries to stay standing we need to accept that some combination of coal, gas or nuclear power is necessary. If nuclear power doesn’t stack up on cost today, that’s one thing. But objecting because of outdated twentieth century ideology is another,” Mr Farrow told The Australian.
“Right now Australia cannot sustain, let alone grow, its heavy industry sector on renewables alone. One day we’ll get there, but anyone serious will tell you that day is a fair way off.”
Mr Fitzgibbon, a former defence and agriculture minister who represented the coalmining electorate of Hunter for 26 years, said the nuclear ban “makes no sense” because every option should be considered.
As the Coalition ramps-up pressure on the government over its renewables-only focus, Mr Fitzgibbon said the world won’t meet its net zero emissions aspirations without installing more nuclear plants.
Another senior Labor figure, who didn’t want to speak publicly, said there was an inevitability in the science community that there’d be a public debate on the uses of nuclear energy, which was only accentuated by the AUKUS agreement.
Mr Fitzgibbon, who led pushback inside Labor ranks following the 2019 election to present a more realistic climate change plan, warned too much faith in a few favoured technologies was a “recipe for failure and economic harm”.
“On the question of whether Australia should also embrace nuclear generation, that should be a matter for the market. Therefore, the prohibition on nuclear generation in Australia should be lifted. It simply makes no sense and every electricity generation option should be readily available to us,” Mr Fitzgibbon said.
“Having said that, if the ban was lifted, it would be a long time – if ever – before we saw a nuclear generator in Australia. It’s hard enough to secure an approval for gas extraction, let alone for a nuclear plant.”
Mr Macron on Sunday urged Australia to lift its nuclear ban, declaring that nuclear energy is a “source that is necessary to succeed for carbon neutrality in 2025”.
The Australian understands Mr Bowen will enter negotiations in Dubai over a push to phase down unabated fossil fuels but no position has been finalised. While there is overwhelming consensus on tripling global renewable generation capacity, COP28 negotiators will finalise the wording around fossil fuels before the conference ends next Tuesday.
The Coalition for Conservation group is hosting Liberal and Nationals MPs and senators at COP28 including opposition energy spokesman Ted O’Brien, Bridget McKenzie, Kevin Hogan, David Gillespie, Dean Smith, Andrew Bragg and Perin Davey.
A US-led pledge on the COP28 sidelines to triple global nuclear capacity by 2050, which the government shunned, was endorsed by more than 20 countries. Of the 22 countries who joined the pledge, 18 have existing nuclear energy industries. Fourteen countries with nuclear energy industries, including Germany, did not sign the pledge.
Peter Dutton said it was sensible for Australia to embrace nuclear energy just as other developed countries had done, labelling Mr Macron’s call to revoke the nuclear power ban “a cry of common sense”. The Australian
Coalition push to unleash uranium reserves and nuclear power The Australian Geoff Chambers 8 December 2023
Opposition climate change and energy spokesman Ted O’Brien will advocate for removing uranium mining and exploration bans – in addition to lifting the nuclear power moratorium – because “Australia has a moral obligation to provide the world its uranium”.
In a World Nuclear Association speech on the sidelines of the UN COP28 climate change summit in Dubai on Saturday, Mr O’Brien will argue Australia’s world-leading uranium reserves must be unlocked to achieve net-zero emissions by 2050.
Mr O’Brien will broaden the Coalition’s push for nuclear power to include the consideration of uranium mining and exploration across all Australian jurisdictions. Under existing rules, uranium mining is allowed in South Australia, Northern Territory and Western Australia, while exploration is approved in NSW. Uranium mining is banned in NSW, Queensland, Victoria and Tasmania.
Mr O’Brien will tell World Nuclear Association delegates and business leaders investing in nuclear technologies that Australia has the world’s largest reserves of uranium and “we should use it”.
As the Albanese government pursues hydrogen and renewables to establish Australia as a clean energy superpower, the Queensland LNP MP will say “we already are … we just need to step up to the plate and start doing something about it”.
Mr O’Brien will issue a call to arms for the West to “take back” global energy security, which has been dominated in recent decades by China and the Middle East.
“We have what the world needs,” he will say. “It’s time we took back energy security for the West. And we should do so ambitiously for we have the capacity as a nation to do more than just supply uranium but also develop capabilities in other areas of the nuclear fuel cycle to become an indispensable part of a broader supply chain.
“Much has been said about the moratorium on nuclear energy in Australia, but it is also a lesser-known fact that the mining and exploration of uranium too is banned in some jurisdictions.
“Not only must Australia consider the removal of the nuclear energy ban, but I would also encourage a rethink on the moratorium on the mining and exploration of uranium.”
Mr O’Brien on Saturday will join World Nuclear Association director-general Sama Bilbao y Leon, Westinghouse Electric Canada president Eddie Saab and Coalition for Conservation chief executive Cristina Talacko on a panel about “Australia’s nuclear energy potential”.
Seven Coalition MPs have travelled to Dubai with Mr O’Brien, including frontbenchers Bridget McKenzie, Paul Fletcher, Perin Davey and Kevin Hogan.
After 22 nations signed a pledge to triple global nuclear energy capacity by 2050, Mr O’Brien will say it is a “wake-up call to Australia that we have a role to play in helping our allies and partners shore up their own energy security as they decarbonise while keeping their power prices down and lights on”.
“Energy security is important to all nations, especially those which are geographically constrained for choice. We have what they need,” he will say.
“It’s not just an enormous commercial opportunity, but a moral obligation for us. Even if our own government remains blind to the need for zero-emissions nuclear energy for Australia, they can’t deny that the rest of the world sees things differently and they need what we have – our uranium. It’s fair to assume that tripling the capacity of nuclear energy is likely to triple the demand for the raw material used to power plants around the world.”
Labor has pushed back against the nuclear pledge, because 18 of the 22 countries that signed up already had nuclear energy industries. Mr Bowen has backed the centrepiece COP28 pledge to triple renewable energy capacity, along with 117 other countries.
Mr O’Brien will say: “A conclusion I have drawn after considerable due diligence is that Australia cannot reach net-zero without nuclear energy. It’s not a silver bullet solution, but it has to be part of our future energy mix. No nuclear, no net zero. Nuclear energy keeps power prices down because it reduces total system costs. On security, nuclear energy can provide baseload power with new and emerging nuclear reactors able to ramp-up and down to load follow renewables, accommodating their intermittency.”
[Note to Ted: recouping the capital costs of nuclear plants requires running them around-the-clock, ie delivering safe, reliable and affordable power 24 x 365 and earning a continuous stream of revenue. Nuclear plants are not designed as load followers; they’re not meant to be ramped up and down. The only justification for wind and solar was based on the myth that they’re capable of reducing carbon oxide gas emissions in the electricity generation sector – there’s not a shred of evidence to support that, by the way, indeed all the evidence is to the contrary. Moreover, by the time Australia scraps its ban on nuclear power plants and has its own nuclear plants up and running, every wind turbine and every solar panel that is occasionally delivering power at present will have been junked – thousands of turbine blades and millions of toxic panels nestling together in landfills. With nuclear power plants there simply is no need for parasitic wind and solar. Nuclear power plants are the only stand-alone power generation source that does not generate carbon oxide gas in the process; no need for batteries, no need for back up. It’s that simple. The sooner the Liberals stop pandering to the wind and sun cult, the better.]
Ahead of a summer when the energy grid will come under stress, Mr O’Brien will warn Australia is at a “fork in the road” and if the country chooses the wrong path “the consequences will be dire”. “At present, Australia is venturing down the wrong path … An alternate path exists.” The Australian
18 months ago the coral on John Brewer Reef was dead according to The Guardian, but Jennifer Marohasy, Peter Ridd and Rowan Dean took the risk of going back to the same dead reef to make a short documentary on it and found the same coral, 80 kilometers offshore and it, and the whole area around it, is flourishing.
According to the Great Barrier Reef Marine Park authority, the area was surveyed in April 2022 and the damage was classed as “severe”. According to them, 60-90% of the reef was bleached. It was so bad that when the Sydney Morning Herald wrote about “500 kilometers of severe bleaching” it was John Brewer Reef that they picked for the feature photo.
Scientists, apparently, were dreading the damage to come (of the reef that recovered):
If the John Brewer reef was sick, most of the Great Barrier Reef was bound to be sick too, said Graham Readfearn:
“This is one of the healthiest reefs off Townsville and one of the best reefs on the whole Great Barrier Reef. So for these corals to be stressed and damaged … well, it’s likely it’s the same at other reefs down here.”
But here in the real world, the formerly bleached coral now is a normal “cafe latte” brown color, showing it has recovered from the bleaching. The growing tips are always white, apparently, so it’s all good. Jennifer wrote all the details up on her blog.
The coral threw out the zooxanthellae last year, but this year it has new ones…
The John Brewer reef, right now, is full of colorful fish and very alive corals.
As Jennifer Marohasy says, it was a risk to return to the “The centre of the sixth mass coral bleaching”. The 15 minute video of the trip to John Brewer Reef is below.
But some official agencies that diagnose the doomed reefs do it from a plane. Here’s an example of the same reef from 120 meters above sea level. For some reason nearly everything deeper than 2 meters is hard to see, and vertical walls of coral are, invisible.
The Australian government gave $1 billion dollars to save the reef in January 2022. Perhaps it worked? You’d think The Guardian might want to tell the world, but they don’t seem to want to give a healthy reef the same attention they gave to a momentarily bleached one.
Though alarmists are losing the head, John Brewer reef is anything but dead, With its colourful coral, Spread like bouquets floral, Where parrot fish swim and are fed.
CNN Travel: “Holidaymakers should prepare to change their travel habits now, before this change is forced upon them.”
CNN Travel: “Holidaymakers should prepare to change their travel habits now, before this change is forced upon them.”
“The negative impacts of tourism on the environment have become so severe that some are suggesting drastic changes to our travel habits are inevitable. In a report from 2023 that analyzed the future of sustainable travel, tour operator Intrepid Travel proposed that “carbon passports” will soon become a reality if the tourism industry hopes to survive. …
What is a carbon passport? The idea of a carbon passport centers on each traveler being assigned a yearly carbon allowance that they cannot exceed. These allowances can then “ration” travel. … The average annual carbon footprint for a person in the US is 16 tons – one of the highest rates in the world. In the UK this figure sits at 11.7 tons, still more than five times the figure recommended by the Paris Agreement … the average global carbon footprint needs to drop to under two tons by 2050. This figure equates to around two roundtrip flights between London and New York.
Intrepid Travel’s report predicts that we will see carbon passports in action by 2040. For emission reductions to have any meaningful effect, ticket prices would have to rise by 1.4% each year, discouraging some people from flying. …
Some European countries are beginning to take measures to reduce air travel. As of April 1, 2023, passengers on short-haul flights and older aircraft in Belgium have been subject to increased taxes to encourage alternative forms of travel.
Less than two months later, France banned short-haul domestic flights where the same trip can be made by train in two-and-a-half hours or less. Spain is expected to follow suit.
A similar scheme could also be on the horizon for Germany. In 2021, a YouGov poll found that 70% of Germans would support such measures to fight climate change if alternative transport routes like trains or ships were available.
An investigation by the European Federation for Transport and Environment in 2023 found that cruise ships pump four times as many sulphuric gases
Holidaymakers should prepare to change their travel habits now, before this change is forced upon them.
#
Yahoo Finance: Could a ‘carbon passport’ be introduced for holidaymakers? – A carbon passport, as envisioned by Intrepid Travel, would be a passport that assigns each traveller an annual carbon footprint, which they cannot surpass.“By 2040, we can expect to see limitations imposed on the amount of travel that is permitted each year.” They added: “By 2040, it will be unusual to see members of Generation Alpha without a carbon-footprint tracker on their smartphones. Every Uber ride, plane journey, and trip to the supermarket will be logged in their devices, noting their carbon footprint in real time.” Related:
The summer of 2023 was very significant for the travel industry. By the end of July, international tourist arrivals globally reached 84% of pre-pandemic levels. In some European countries, such as France, Denmark and Ireland, tourism demand even surpassed its pre-pandemic level.
This may be great news economically, but there’s concern that a return to the status quo is already showing dire environmental and social consequences.
Tourism is part of the problem. The tourism sector generates around one-tenth of the greenhouse gas emissions that are driving the climate crisis.
The negative impacts of tourism on the environment have become so severe that some are suggesting drastic changes to our travel habits are inevitable. In a report from 2023 that analyzed the future of sustainable travel, tour operator Intrepid Travel proposed that “carbon passports” will soon become a reality if the tourism industry hopes to survive.
What is a carbon passport?
The idea of a carbon passport centers on each traveler being assigned a yearly carbon allowance that they cannot exceed. These allowances can then “ration” travel.
This concept may seem extreme. But the idea of personal carbon allowances is not new. A similar concept (called “personal carbon trading”) was discussed by UK Parliament in 2008, before being shut down because of to its perceived complexity and the possibility of public resistance.
The average annual carbon footprint for a person in the US is 16 tons – one of the highest rates in the world. In the UK this figure sits at 11.7 tons, still more than five times the figure recommended by the Paris Agreement to keep global temperature rise below 1.5 Celsius (2.7 Fahrenheit) above pre-industrial levels.
Globally, the average annual carbon footprint of a person is closer to 4 tons. But, to have the best chance of preventing temperature rise from overshooting 2 Celsius, the average global carbon footprint needs to drop to under two tons by 2050. This figure equates to around two roundtrip flights between London and New York.
Intrepid Travel’s report predicts that we will see carbon passports in action by 2040. However, several laws and restrictions have been put in place over the past year that suggest our travel habits may already be on the verge of change.
Targeting air travel
Between 2013 and 2018, the amount of CO₂ emitted by commercial aircraft worldwide increased by 32%. Improvements in fuel efficiency are slowly reducing per passenger emissions. But research from 2014 found that whatever the industry’s efforts to reduce its carbon emissions, they will be outweighed by the growth in air traffic.
For emission reductions to have any meaningful effect, ticket prices would have to rise by 1.4% each year, discouraging some people from flying. However, in reality, ticket prices have been falling.
Some European countries are beginning to take measures to reduce air travel. As of April 1, 2023, passengers on short-haul flights and older aircraft in Belgium have been subject to increased taxes to encourage alternative forms of travel.
Less than two months later, France banned short-haul domestic flights where the same trip can be made by train in two-and-a-half hours or less. Spain is expected to follow suit.
A similar scheme could also be on the horizon for Germany. In 2021, a YouGov poll found that 70% of Germans would support such measures to fight climate change if alternative transport routes like trains or ships were available.
Cruises and carbon
It’s not just air travel that’s being criticized. An investigation by the European Federation for Transport and Environment in 2023 found that cruise ships pump four times as many sulphuric gases (which are proven to cause acid rain and several respiratory conditions) into the atmosphere than all of Europe’s 291 million cars combined.
…
…
Whatever the solution may be, changes to our travel habits look inevitable. Destinations across the globe, from Barcelona to the Italian riveria and even Mount Everest are already calling for limits on tourist numbers as they struggle to cope with crowds and pollution.
Holidaymakers should prepare to change their travel habits now, before this change is forced upon them.
Ross Bennett-Cook is a visiting lecturer, School of Architecture + Cities, University of Westminster
“By 2040, we can expect to see limitations imposed on the amount of travel that is permitted each year.” They added: “By 2040, it will be unusual to see members of Generation Alpha without a carbon-footprint tracker on their smartphones. Every Uber ride, plane journey, and trip to the supermarket will be logged in their devices, noting their carbon footprint in real time.”
Dear Citizen 1138, we regret to inform you that your request to travel has been denied as you have reached the limit of your carbon allowance for this period. pic.twitter.com/qJ6B8YPC7X
Biden said on Jan. 31 that “if we don’t stay under 1.5° Celsius” or 2.7° Fahrenheit, “we’re going to have a real problem.” If a 0.0009° F reduction costs $369 billion, then Biden’s 2.7° F goal would devour — brace yourself — $1.107 quadrillion — with a Q.
Through Dec. 12, the “Climate!” crowd is swarming COP28, Dubai’s carbophobia cavalcade. The fact that these global-warming alarmists are surrounded by Earth’s deepest pools of fossil fuels makes their Hajj infinitely ironic.
Also astonishing is the nearly immeasurable impact of these people’s gyrations. They blow trillions of dollars, bludgeon human freedom, and yet do shockingly little to fix their vaunted “climate crisis.”
One practically needs an electron microscope to find their promised reductions in allegedly venomous CO2 or supposedly lethal temperatures.
According to #ActInTime’s Climate Clock, high above Manhattan’s Union Square, humans have — at this writing — five years and 227 days until we boil to death in a cauldron of steaming carbon. Since The End is scheduled for Saturday, July 21, 2029 (mark your calendars!)
Big Government Democrats offer jaw-droppingly paltry climate benefits, despite their spine-chilling predictions and unbridled interventionism.
Clean Power Plan Cost/Benefit
Obama-Biden’s proposed Clean Power Plan was a diamond-encrusted specimen of do-nothingism. According to a May 2015 analysis by their own Energy Information Agency, between 2015 and 2025, the CPP would have slashed real GDP by $993 billion, or an average of $39.7 billion per year.
It would have sliced real disposable income by $382 billion, or $15.3 billion annually. It also would have chopped manufacturing shipments by $1.13 trillion, or $45.4 billion per year.
EIA forecast a decrease of 0.035° Fahrenheit. This would have cranked a thermometer from 72° F way down to 71.965°. As Billy Joel once sang, “Is that all you get for your money?”
IRA Funded Green Energy Projects Cost/Benefit
Biden’s blessed Inflation Reduction Act budgeted $369 billion for green-energy projects. Goldman Sachs subsequently slapped a $1.2 trillion price tag on the IRA.
Danish environmental expert Bjorn Lomborg ran the IRA through the United Nations’ climate models. “Impact of new climate legislation,” Lomborg specified. “Unnoticeable: 0.0009°F to 0.028°F in 2100.” This would chill thermostats from 72° to 71.9991°. If we get lucky: 71.972°.
Biden said on Jan. 31 that “if we don’t stay under 1.5° Celsius” or 2.7° Fahrenheit, “we’re going to have a real problem.” If a 0.0009° F reduction costs $369 billion, then Biden’s 2.7° F goal would devour — brace yourself — $1.107 quadrillion — with a Q.
Biden EV Mandate Cost/Benefit
Emperor Biden’s electric-vehicle decree would require that at least 67% of new cars sold in 2032 be electric. This edict already is stalling the auto industry. On Nov. 29, 3,902 U.S. car dealers in all 50 states wrote Biden. Message: Stop tailgating! “Already, electric vehicles are stacking up on our lots,” the dealers complained. “The majority of customers are simply not ready to make the change.”
This chaos aside, Biden’s mandate would limit CO2 by 10 billion tons through 2055. Alas, China is expected to generate 320 billion tons of carbon in the next 32 years. So, Biden’s “savings” will asphyxiate in a giant Chinese carbon cloud.
Holman Jenkins of The Wall Street Journal calculates that Biden’s EV order will decrease planetary emissions by a whopping 0.18%. “The climate effect of the extravagantly expensive Biden plan will steadily approach zero,” Jenkins anticipates.
Bans on Gas Stoves and Heaters Cost/Benefit
Rather than jail criminals or deport illegal aliens, Governor Kathy Hochul, D-N.Y., bans gas stoves and demands that gas heaters yield to electric heat pumps — never mind that her constituents freeze to death during post-blizzard blackouts.
“The global effect of the costly program of compulsory electrification will be a reduction in greenhouse gas emissions of less than 0.05%,” the Empire Center for Public Policy calculates.
Summation
Obama, Biden, Hochul and their comrades might respond that no single bauble will fix everything, and every shiny object helps. Maybe. But these four schemes alone carry an enormously high price in shredded freedomandincinerated taxpayer dollars, yet still leave at least 99.82% of emissions untouched.
To quote another Briton, William Shakespeare, perhaps this “sound and fury, signifying nothing” is not about cutting emissions or curbing Earth’s temperatures.
Maybe it’s designed to help Democrats spend trillions of dollars to signal virtue, bark orders at the American people, and lavish taxpayers’ hard-earned cash on their politically connected pals— from the Potomac to the Persian Gulf.
Footnote:
The estimates of lowering temperatures come from IPCC-approved models, which presume that Global Mean Temperature (GMT) rises in response to rising atmospheric CO2. In fact that premise is itself dubious since basic physics requires that a cause precede an effect in time. The evidence points to changes in CO2 lagging rather than leading GMT changes. This is true on all time scales, from last month’s observations to ice cores spanning millenia.
Very recently a link to the CO2 Coalition and a paper by Wijngaarden and Happer (henceforth W&H) offered a series of models of Earth’s atmosphere, with supplemental information, as a tutorial (primer they called it) on the atmosphere and greenhouse effect.
Very recently a link to the CO2 Coalition and a paper by Wijngaarden and Happer (henceforth W&H) offered a series of models of Earth’s atmosphere, with supplemental information, as a tutorial (primer they called it) on the atmosphere and greenhouse effect. I am unsure what the target audience is. It seems far too complex to serve as a tutorial for the general public. Besides presenting challenging material, at 32 pages in length it takes some determination to power through it.
The models were each one example of a series of increasing complexity. The thread led to many interesting comments, objections to the paper and objections to comments, counter objections, and on and on. The sub threads make for lively reading, but they become long, making arguments hard to follow, encourage people miscommunicating, and sometimes simply end without any resolution of the argument. Some people claimed the paper presented numerous errors. One person gave it only a C+ grade. The paper gave me much material for thought, including thoughts on disagreements that seem to me pertinent to topics at WUWT.
W&H adopted a per molecule point of view for their development of models. I think this leaves most people, even technically savvy people, somewhat cold. Our physical experience is with bulk quantities like temperature, pressure, volume and so forth. In fact, it’s difficult to connect molecules, which have energy levels, with bulk concepts like temperature and pressure, or even with a concept like work without statistical mechanics. A couple of the models seemed beyond peoples’ experience. My personal view is it might have been based on thermodynamic state variables.[1] Entropy in particular is far easier to understand and use if viewed as simply a state variable conjugate to temperature.
On page 20 W&H summarized what they’d hoped readers had absorbed from their simple models (isothermal, adiabatic, and gray) of atmospheres. Let’s go through their points one by one.
1 Greenhouse gases [sic, consistently below] cool the upper atmosphere by radiating heat to space.
2 For a gray atmosphere, surface radiation to space is attenuated by factor e−τo where τo is the vertical optical depth from the surface to outer space. Absorbed surface radiation is replaced by radiation emitted by greenhouse gases higher in the atmosphere.
3 For optical depths, τo >> 1, atmospheres develop a lower troposphere where convection by parcels of warm air floating upward and parcels of cold air sinking downward transport most of the solar energy absorbed by the surface. Greenhouse gases radiate heat to space from altitudes close to the tropopause. Radiation to space from the surface and from greenhouse molecules in the lower troposphere is negligible.
3a Radiative heat transport is negligible compared to convective heat transport below the tropopause.
3b Convective heat transport is negligible compared to radiative heat transport above the tropopause.
4 Without greenhouse gases, the adiabatic temperature profile of the troposphere would evolve into an isothermal profile with the same temperature as the surface.
5 Greenhouse gases increase the temperature of the surface, compared to the surface temperature in an atmosphere without greenhouse gases.
Analysis:
Item 1 is not controversial.
Item 2 simply means that a “pencil”[2] of radiation in a gray atmosphere originating at the surface will have its original intensity decline by the factor e−τo by the time it exits at top of atmosphere. This shouldn’t be controversial because it simply states Beer’s law – a well established principle. However, that pencil of radiant intensity will have a value as it exits the atmosphere that includes contributions from the atmosphere above the ground surface. It is a statement of the transport equation which W&H state on page 24 as Equation 69. There should be no controversy over this statement at all.
Items 3, 3a, and 3b are all one issue. The crux of this issue is this: “τo >> 1”. This is an indeterminate condition. To fully see that what W&H said is substantially correct but incompletely stated, we need a fact that I do not recall ever having read at WUWT or any internet site for that matter. W&H’s Equation 69, the equation of transfer, does not provide a solution of the temperature distribution in a medium. It only describes radiant intensity. It has to be augmented with what is called the energy equation and the energy equation itself only rarely includes provisions for factors other than heat.[3]
What about this “energy equation”? If a person considers the three modes of heat transport, the energy equation involves a vector quantity for each describing the magnitude and direction of heat transport rate. Setting the divergence [4] of the sum of these vectors plus local heat generation (latent heat and absorption of radiance) equal to the change of temperature with time multiplied by the heat capacity of the medium, is a partial statement of the First Law of Thermodynamics – partial only because it does not address the additional impact of work. If work input (free convection) is involved, an equation describing fluid dynamics might have to augment the energy equation.
Solving the energy equation simultaneously with the transport equation of Schwarzchild (Eq. 69) is a daunting task made even more so by including fluid dynamics. Rather than pursue such a task, people (engineers typically) make an analysis based on dimensional analysis.
The rate at which heat moves by thermal conduction is related to the local temperature gradient and a material property called the thermal conductivity. Few gasses possess enough thermal conductivity to move significant amounts of heat in a planetary atmosphere – exceptions occur near the ground where there are large temperature gradients.
The rate at which heat is transported by convection, bulk material flow, depends on the heat capacity of the medium and the correlation (dot product more properly) of the local temperature gradient and local velocity vector.
The rate at which thermal radiation transports heat away from a surface is related to the Stefan constant, temperature raised to the fourth power, index of refraction, and the emissivity. However, radiation beyond the emitting surface must also depend on the extinction coefficient of the gaseous medium.
Ratios of these various constants combined with characteristic distances of a problem provide a method to evaluate the relative contribution to total heat transfer by each means. Unfortunately there are two possible length scales in the energy equation. In a free atmosphere the extinction coefficient, which has units of inverse length, provides a natural scale factor for radiation; alternatively the scale height of the atmosphere provides a characteristic length for free convection. Details regarding this are unhelpfully complex for discussion here and are available elsewhere[5], but for optically thick atmospheres the ratio of bulk transport to radiation transport is proportional to optical depth.[6] As the optical depth tends toward infinity convection dominates, and as it tends to zero radiation dominates. Thus, τo >> 1 is the true consideration involved, but only in the context of the energy equation, which W&H never mentioned in their tutorial.
We might wonder if (τo =5), which pertains to their model, is far enough beyond 1 to qualify as a convection dominated model. An isothermal atmosphere (τo =0) is a simple place to start this discussion. Outgoing infrared irradiation equals the irradiance absorbed at the surface for the simple reason there are no other means for heat transfer. That’s it.
A gray atmosphere analysis is best begun with a comparison to some real Earth atmosphere. Let’s use Equation 69 to compute radiative transport in a gray atmosphere and compare the results to a real Earth atmosphere as MODTRAN sees it. I wrote a numerical solution to Equation 69 for a gray atmosphere using Excel and a second order Runge-Kutta method.
Keep in mind that the gray atmosphere model of W&H has a specified temperature profile (specified lapse rate). Thus no solution of the energy equation is required, but without the energy equation’s involvement there is every possibility that the assumed temperature profile is not consistent with assumed irradiance.
A midlatitude summer atmosphere in MODTRAN is calculated as having 19% transparency out to TOA which translates to an optical depth of 1.69. At midsummer, solar irradiance at midlatitudes would amount to 320W/m2 assuming an albedo of 0.3. This same emitted power would come from a black surface (e=0.97) at a temperature of 276K. Surface temperature in the gray atmosphere is 296K while the MODTRAN model is 294K.
Figure 1. Comparison of radiant flux (W&H Equations 69 and 71).
What leaves the atmosphere in the MODTRAN calculation (TOA) is only 255W/m2 which is inadequate to remove the 320W/m2 input locally. The midsummer atmosphere is free to transport heat laterally (net northward) in order to maintain steady temperature. At the ground surface upward directed irradiance (411W/m2) exceeds downward (326W/m2) but this difference is inadequate to maintain steady surface temperature, so a large proportion of heat must be conveyed from the surface by diffusion, convection, and latent heat.
The gray model (τo =1.69) mimics this pattern with obvious departures. First, the upward minus downward directed irradiance is (435-84) 351W/m2 which is more than adequate to remove surface emitted power and maintain a steady ground temperature. At TOA, however, the difference is 257W/m2 net upward which is not quite adequate to maintain steady model temperature; so the gray atmosphere must transfer heat vertically by other means or its assumed temperature profile is inconsistent. One very apparent difference between the models is that net upward irradiance in the gray model decreases with height while in the real atmosphere it grows with height. This is another indication of the need for convection and latent heat to make a consistent picture.
The MODTRAN calculated irradiances are far more curved with height than that of the gray model which is mainly a reflection of water vapor being far more concentrated near the surface than the atmospheric pressure gradient which is what determines the vertical profile of “grayness”.
Figure 2 shows what happens when the optical depth approaches (τo = 5), which corresponds with W&H’s model. The difference at the surface is (435-157) 278W/m2 which cannot maintain a steady surface temperature; At TOA the outgoing irradiance is only 137W/m2 which is about a third of what is needed to maintain a model temperature.
Figure 2. Gray model of optical depth equal to 5. I used less assumed surface irradiance than W&H did and a sub-adiabatic lapse rate, to make the figures more easily compared.
What is apparent is that as optical depth increases radiation becomes less important as a transfer mechanism. What occurs in detail, however, can’t be settled without letting our temperature distribution free to vary and bringing the energy equation and other phenomena into the analysis. This is an instance of Einstein’s dictum “Make things as simple as possible, but no simpler.” The statement W&H made is undoubtedly correct, but without complete context.
Item 4 is of interest because of something from item 3. The non-greenhouse atmosphere is nothing more than bulk matter, albeit low density, which cannot interact through radiation, but can exchange heat only at its boundary with the surface. It can redistribute heat through diffusion. Thermal diffusion in this simple situation involves Poisson’s equation[7] and a result from potential field theory is that the steady temperature distribution in the domain of such a problem cannot be greater than the boundary maximum nor less than the boundary minimum. Since the ground surface in this case has only one temperature, the only steady solution is an isothermal atmosphere. Figure 3, which is from a paper by NASA scientists[8], shows the remarkable resemblance of every known “thick” planetary atmosphere. Each shows a sort of adiabatic atmosphere up to a height at which energy input to a mesosphere becomes significant. This resemblance persists over large variations in surface pressure and over variations in composition and gravitational acceleration. None, despite billions of years to evolve, has become isothermal because each contains some amount of greenhouse gas.
Item 5 is not, or shouldn’t be, controversial.
Figure 3. Temperature with height (pressure) in a number of atmospheres in the solar system. From [8].
Conclusion
I found the tutorial by W&H interesting because its foundation was molecular physics rather than the usual foundations from classical thermodynamics. Unfortunately, I can’t figure out its intended audience because it is a heavy lift intellectually. One can only conclude that such simple models end their usefulness fast because, as W&H say,”…no one knows just how the complicated climate system of Earth’s atmosphere will respond to the small forcings [of GHGs].”
References:
1- Thermodynamic state variables for an ideal gas include temperature, entropy, pressure and volume.
2- By pencil of radiation I mean a very slim cone of solid angle originating at a point and oriented in a particular direction. All such pencils integrate to a value of 4 pi steradians area in a sphere of unit radius.
3-The First Law concerns changes to the internal energy of a system, which in this case means an atmosphere of nearly ideal gasses. dU=dQ-dW translated means that changes in internal energy (U=heat capacity times temperature in this case) are equal to inputs of heat (Q) less outputs in work (W). Work is rarely included in the energy equation, but might be an essential part of the energy equation as applied to an atmosphere in free convection.
4-Divergence is the net transfer in (negative divergence) or out (positive divergence) of a small volume centered at a point.
5-See for example M. Necati Ozisik, 1973, Radiative Transfer, Wiley. Chapters 12 and 13. A very large collection of dimensionless groups are used in solutions of transport or energy equations by combined phenomena – Peclet number, Nusselt number, Thring number, etc. Quite a collection of such are found in the CRC Physics and Chemistry Handbook.
6-There are many ways to think about this. One is that the product of extinction coefficient and the atmosphere’s scale height forms a characteristic transport distance. If this is a large value, then the transport length of convection becomes much greater than that of radiation, which is taking place through many small jumps. A sequence of many small jumps makes radiation behave like a diffusion process. Convection looks far more organized in comparison and dominates heat transport. If, on the other hand, the product is quite small then the transport distance for radiation is large and eventually becomes so large that it is impossible to beat radiation by any other means as it occurs at nearly the speed of light (gasses have an index of refraction nearly equal to 1); or as W&H say it is “ballistic” transport to space.
7-Poisson’s equation thus has some consistent connection to the Second Law of Thermodynamics.
New Statesman analysis of climate and trade data exposes how much the UK’s net-zero agenda depends on cheap foreign coal power, particularly from China.
The UK’s top four trade partners are Germany, the US, China and the Netherlands.
All four of these countries have a significantly larger share of coal-fired electricity in their energy supply than the UK does. This means that goods produced in factories in those countries will typically have a higher emissions footprint than those produced in UK factories.
China’s power grid is particularly carbon-intensive, with coal-fired power plants running 60 per cent of its grid. The UK has capitalised on cheap imports made using low-cost Chinese coal power, with imports from China to the UK more than doubling in value over the past decade.
For its part, China has positioned itself as a leader in the production of clean technologies such as batteries and solar panels (80 per cent of the global supply of which is manufactured in China). These too are made using cheap coal-fired electricity, which helps China to undercut other countries. China is also trying to dominate the extraction and processing of minerals key to the energy transition. It is responsible for 60 per cent of global production of rare earth elements, which are crucial for low-carbon technologies.“For other countries, the choice is between making use of China’s low-cost supply chain, but with the risk of reliance on China, or building their own supply chains using a combination of trade protectionism and subsidies to offset China’s subsidies and cost advantages,” said Lauri Myllyvirta of the Centre for Research on Energy and Clean Air.
The UK’s reliance on China’s low-cost clean tech and mineral exports can be seen in HMRC trade data, which reveals how the UK imported large shares of its energy transition technologies and products from China in 2022 – including 64 per cent of rare earth metals and 49 per cent of lithium batteries.
Via its Belt and Road initiative, China was for many years by far the largest financier of new coal power plants worldwide – until Xi Jinping, the Chinese president, told the UN General Assembly in September 2021 that China would build “no new coal power plants abroad”. There have been loopholes, however, that have enable China to finance the construction of some coal-fired plants that power industrial facilities rather than the national grid. These are known as “captive” power plants.
China-backed captive power plants are a particularly significant phenomenon in Indonesia. The country uses captive coal power to smelt nickel, a metal central to the production of batteries used in electric vehicles. Indonesia is the world’s largest producer of nickel. A 2020 ban in Indonesia on the export of unprocessed nickel ore, designed to maximise the value of Indonesian nickel within Indonesia itself, has further increased demand in the country for nickel smelters powered by captive coal power plants.
For several years click-bait media has terrorized guilt-ridden people with headlines like “The Ocean Is Suffocating, and It’s Our Fault”. But there is hope!
For several years click-bait media has terrorized guilt-ridden people with headlines like “The Ocean Is Suffocating, and It’s Our Fault”. But there is hope! An open mind and critical thinking can free people from the shackles of their stupidity. The ocean’s oxygen(O2) content is dependent on atmospheric O2 concentration, photosynthesis, respiration and decay, temperature, and ocean circulation dynamics. Indeed, some regions can become so depleted in O2, those oxygen minimum zones (OMZ) are called “dead zones”. However, a lack of awareness or misunderstanding of the important dynamics blind people with undue fear.
Here are 7 dynamics to consider to overcome stupidity.
1. Misunderstanding atmospheric concentration graphs: Scripps has been monitoring atmospheric concentration for 3 decades and reports an O2 decline (graphic #1), which they blame on burning fossil fuels. Not being familiar with measurements of “per meg”, most people get scared by the graph’s steep decline. However, the graph’s scale exaggerates the dynamic. Scripps’ declining O2 trend of 19 ‘per meg’ per year corresponds to losing just 19 O2 atmospheric molecules out of every million each year. In more familiar and realistic terms, after 100 years O2 concentration would only fall from 21.00% to 20.96%, a very small and insignificant change that is not a threat to any living creature.
2. O2 Minimum Happens in Dark Colder Water: Global warming alarmists push the simplistic factoid that warmer water will hold less O2 . However, the red curve in (#2) shows oxygen is steadily depleted where photosynthesis stops and respiration and decay of organic matter in dark colder water continues to consume oxygen. Maximum O2 depletion happens around 1000 meter depths.
3. Offsetting CO2 fertilization effect: The highest concentration of O2 is in the oceans warm sunlit layer, the photic zone, (#2) where photosynthesis generates O2 by splitting water molecules. Some small OMZ regions sometimes develop at night but disappear the next day when photosynthesis resumes.
Photosynthesis produces the organic matter which is the foundation for all marine life. Ocean photosynthesis also maintains about 50% of the atmospheric O2 required by land animals and more CO2 promotes more photosynthesis. Scientists now report our current climate is driving more frequent and extensive phytoplankton blooms.
4. Misapplied Temperature Factoid: Illustrations #3 & #4 show the relationship between the latitudinal gradients of ocean surface temperatures and surface O2 . Warmer temperatures indeed hold relatively less O2 . The warm tropics average the lowest surface O2 relative to the colder polar regions. But declining O2 happens independently of that temperature gradient.
5. Nutrient Supply Drives O2 Depletion: Locations of coastal O2 depletion (hypoxia), red dots in #5, are more common in the more oxygen rich waters outside the tropics. This human caused hypoxia is due to respiration and decay of high nutrient sewage waste-water and agricultural run-off. Severe coastal hypoxia can indeed cause temporary but suffocating dead zones that remain for days or months throughout the warm summer. However only stupid people believe driving an electrical vehicle will stop coastal suffocation. In contrast, intelligent environmentalists understand the only real remedy is better management of nutrient run-off.
6. Natural Nutrient Upwelling Produces the Greatest Abundance of Marine Life: The decay and respiration of organic matter in deeper waters below the photic zone releases critical nutrients. Thus, deeper waters that are rich in nutrients will always be oxygen poor. Regions with upwelled deep water recycle those nutrients to the photic zone and produce the greatest profusion of marine life. However, climate alarmists ignore this wonderful bountiful dynamic, preferring to focus on scary narratives about the accompanying oxygen depletion.
The blue areas in #5 represent oxygen poor water at 300 meter depths, resulting in permanent subsurface dead zones. Graphic #6 shows these same regions happen where colder water with extremely depleted O2 is upwelled. The waters off the coast of Peru represent less than 0.1% of the world ocean surface but presently producing about 10% of the world fish catch; and simultaneously the world’s greatest OMZ.
7. Climate Change has Increased Ocean Productivity: Studies of ocean productivity off the coast of Peru determined oxygen levels were the highest during the Little Ice Age (#7) but correlated with the region’s lowest levels of productivity (#8). As upwelling and productivity increased after 1850, O2 levels plummeted.
Only stupid people would hope for reduced marine productivity to raise oxygen levels. But if plans by climate idiots like Bill Gates to dim the sunlight happen, it just might grant the stupid alarmists’ death wish.
Aside from the usual commitments to reduce emissions (which continue to rise globally) and redistribute income (primarily from middle-to-lower earners to corrupt governments and well-heeled members of the climate cartel), attendees at the just-concluded COP28 conference in Dubai took a break from grazing at the many sumptuous receptions to call for farmers the world over to change their ways and practice “climate-friendly” agriculture.
Aside from the usual commitments to reduce emissions (which continue to rise globally) and redistribute income (primarily from middle-to-lower earners to corrupt governments and well-heeled members of the climate cartel), attendees at the just-concluded COP28 conference in Dubai took a break from grazing at the many sumptuous receptions to call for farmers the world over to change their ways and practice “climate-friendly” agriculture.
Cattle, sheep, and other farm animals now stand accused of endangering the planet by producing methane. Methane is routinely cited as a “potent” greenhouse gas, one which must be ruthlessly suppressed. Humans are being told, in no uncertain terms, that they must reduce, and eventually eliminate, their consumption of meat. Substitutes include lab meat and, everyone’s favorite, insects.
“A U.N. report last year held that about 7 gigatons of CO2 reductions – about as much emissions from global natural-gas combustion – would have to come from people eating meat,” Allysia Finley noted in her “Life Science” column in the Wall Street Journal (Dec. 4). “Livestock production accounts for about 11% to 17% of global greenhouse-gas emissions and about 32% of the world’s methane, which is 28 times as potent as carbon dioxide. Pound for pound of protein, beef production generates nearly 18 times as much greenhouse gas — and pork, four times as much – as tofu. Blame cow burps and manure.”
Livestock have joined SUVs, 18-wheelers, gas stoves, and gas furnaces on the ever-growing list of climate culprits. Sen. Chuck Grassley (R-Iowa) noticed that COP28 was “targeting farmers” and he is not moved by claims by environmentalists and climate officials who say change must come to the farm if the “climate crisis” is to be averted.
“I’m one farmer that’s not ready to do that,” he told E&E News (Dec. 6). Grassley, 88, is a hog farmer, and Iowa id the nation’s leader in hog production and in corn, grown mainly for livestock feed, as well as for ethanol. The Hawkeye State ranks in the top 10 for cattle, according to the Department of Agriculture.
Grassley rightly worries that government agencies will force companies to report their climate-related emissions throughout their supply chains, down to the farm level. This is exactly the approach taken by the Biden Securities and Exchange Commission (SEC), which is working on a rule to require reporting on such “Scope 3” emissions from some publicly traded companies. Farms and ranches, of course, are not publicly traded companies, but they could be caught up in the regulatory web the Biden administration wants to throw over as many entities as it can.
Reduce the Supply and Increase the Cost
The Journal’s Finley sees what game is being played.
“The climate lobby knows that restricting people’s consumption of meat and dairy products would be unpopular, if not unconstitutional,” she points out. “Instead, they urge that governments use regulation, taxes, and subsidies to reduce the supply and increase the cost of meat, as they are doing with fossil fuels.”
While elites will continue to dine well under the regime being put in place, she notes, “The world’s poor will have to continue subsisting on nonnutritious gruel, just as they will have to do without cars, air conditioning, and refrigerators to achieve the global left’s net-zero nirvana.”
Microsoft co-founder Bill Gates is putting his money where the COP28 pledges are. He’s buying up tens of thousands of acres of prime U.S. farmland, not to plant crops to feed the world’s 8 billion people, but to use the land for projects that will reduce CO2 levels in the air. This will reduce agricultural productivity, but that is a problem for the poor, not the rich.



You must be logged in to post a comment.